


Services on Demand
Article
 English (pdf)
 Article in xml format
 Article references
Indicators

Related links
-
 Cited by Google
 -
 Similars in Google
Share

 Permalink
Water SA
On-line version ISSN 1816-7950
Print version ISSN 0378-4738
Water SA vol.40 n.3 Pretoria Jun. 2014
http://dx.doi.org/10.4314/wsa.v40i3.18
Revision of regional maximum flood (RMF) estimation in Namibia
GC CloeteI, II, *; GR BassonII; SA SinskeII
IKnight Piésold, PO Box86062, Eros, Windhoek, Namibia
IICivil Engineering Department, Stellenbosch University, Private Bag XI, 7602, Stellenbosch, South Africa
ABSTRACT
Extreme flood hydrology in Namibia for the past 30 years has largely been based on the South African Department of Water Affairs Technical Report 137 (TR 137) of 1988. This report proposes an empirically established upper limit of flood peaks for regions called the regional maximum flood (RMF), which could be associated with an annual recurrence interval of 10 000 years. This paper revisits the Kovacs RMF flood model applicable to Namibia, and incorporates 30 years of additional systematic data as well as palaeoflood data into the model. A revised graphical distribution of the K-value zones for Namibia is presented and is proposed to replace the current model. The results confirm the work previously done by Kovacs and, in some places, increase the bounds of the RMF zones. The proposed new model may also contribute to a South African update of the Kovacs model, providing useful information along the southern and eastern borders of Namibia.
Keywords: extreme floods, regional maximum flood, RMF Namibia, palaeoflood
INTRODUCTION
Understanding the magnitude and frequency of extreme floods is critical for the design of hydraulic structures such as dams (Benito et al., 2006) or other civil engineering structures which pose a risk to people during floods: railways, culverts, bridges, main roads, etc. Extreme flood hydrology in Namibia has been based on the empirically established upper limit of flood peaks, namely the regional maximum flood (RMF); however, other models have also been applied. The RMF for Namibia is described in Technical Report 137 (TR 137) 'Regional Maximum Flood Peaks in Southern Africa', of the South African Department of Water Affairs (Kovacs, 1988). Practitioners of the RMF method consider these floods to have annual recurrence intervals of up to 10 000 years. (Van der Spuy, 2008)
In TR 137 Kovacs mentions that the K-value boundaries for Namibia are tentative due to the relatively small database, the short representative periods, and less accessible hydro-logic parameters such as the 3-day maximum storm rainfall. One way to address the 'small database' is to gather more data on flood peaks by constructing more river gauging stations. However, it could take several decades of data capturing before any significant extreme flood data will become available. According to Tasker and Stedinger (1987) useful flood information can be obtained for the pregauged period by incorporating paleoflood data, and, in so doing, supplement the systematic gauge record at a site. Palaeoflood hydrology is a reconstruction of the magnitude and frequency of recent, past, and ancient floods (approximately 50, 500 and 5 000 years ago, respectively) using geological evidence (Baker et al., 2002). In hyper-arid regions such as the drier parts of Namibia, flood evidence is well preserved in the form of sediment deposits. These sediment deposits, also known as slackwater flood deposits, are stage indicators of floods and can be preserved in stratigraphic sequences (Benito et al., 2003a).
This paper addresses the concerns of Kovacs (1988) by adding 37 additional flood peak sites to the existing 64 flood peaks which were used in TR 137, and also by increasing the flood peaks of 4 of these 64 floods. The flood peak data increased from 2 759 years of recorded data used in TR 137, to 4 169 years, taking into account the additional 37 stations as well as the longer recording period for several of the original stations. Six palaeofloods are also included in the data: two in the south-flowing Fish, two in the Kuiseb, one in the Gaub (Grodek et al., 2013), one in the Khan River (Greenbaum, 2011), and all west-flowing rivers. The Fish River flood peaks and one of the Kuiseb River floods are considered upper-bound floods for these rivers, i.e., floods which had not been exceeded in a very long time at the scale of thousands of years (Grodek et al., 2013). Note that the research on the Fish River has not yet been published.
The Kovacs K values were revisited with the new data, and taking into consideration the maximum 3-day rainfall peaks, the topography and geology, new K-zones were delineated and are presented in this paper. Note that the K-value zone boundaries are likely to increase as data records are extended over time: recorded extreme flood peaks have a low probability of being exceeded; however, if they are exceeded the regional K-value will move upwards. By employing palaeoflood hydrology at more of the remote river systems in Namibia, a significant contribution can be made to flood data, which will assist future researchers in populating the open spaces of Namibia where no flood data are presently available.
ALTERNATIVE EXTREME FLOOD MODELS
Three basic methods are available for the estimation of extreme flood peaks: empirical, probabilistic and deterministic methods. These are only discussed briefly here, together with concerns related to the validity of the models.
Extreme flood models
The empirical method
In this approach maximum flood peaks observed in a hydro-logically homogeneous region are plotted against catchment area and an envelope curve is drawn for the points, which is then considered as the upper limit of expected flood peaks, Qmax (Kovacs, 1988). The popularity of this method dwindled from the 1930s to the 1960s with the development of probabilistic and deterministic methods. However in 1967 the empirical approach was revived by Francou and Rodier (Kovacs, 1988) with their regional maximum flood (RMF) peak envelope curves.
The probabilistic method
This approach predicts flood peaks based on the extrapolation of a theoretical probability distribution fitted to annual maximum flood peak records in the same river or region. A low probability of 0.0001 is allocated to extreme flood events.
The deterministic method
This approach predicts a hydrograph and an associated flood peak based on storm rainfall input and estimated storm losses. For extreme flood peaks, the presumption is that the 'probable maximum precipitation' (PMP) is falling on a saturated catchment area, and this produces the 'probable maximum flood' (PMF). By definition the PMF has no annual recurrence interval but was arbitrarily assigned a return period of 10 000 to 1 000 000 years at the upper and lower confidence limits for flood frequency analysis (National Research Council, 1985).
Concerns regarding the probabilistic and deterministic models
The probabilistic model
The maximum peak is associated with a very low probability, most often P = 0.0001, i.e., an annual recurrence interval of 10 000 years, which is entirely arbitrary. Also the estimate is obtained from extrapolation of a theoretical probability distribution fitted to annual maximum flood peaks. The extrapolated period is usually 100 to 500 times longer than the period of record. The representativeness of such a short period sample is unknown (Kovacs, 1988).
The deterministic model
A remark by Enzel et al. (1993 p. 2294) regarding the PMF is worth noting: 'The inconsistency between PMF estimates and the actual regional data (gauged, historic, and palaeofloods) is a cause of concern'. It may indicate, for this hydrological region either that the understanding of extreme rainfall events used in constructing the PMP and the subsequent basin responses is deficient, or failure in the model construction. Benito et al. (2006 p. 2119) commented on the reliability of the PMF methodology: 'In the USA the extrapolated discharges of the 10 000 year palaeoflood annual recurrence interval are between 5 to 20% of the calculated PMF'.
STUDY AREA
The study area discussed in this paper is limited to the national boundaries of Namibia and does not include neighbouring countries. The RMF K-values for rivers shared with neighbours need to be revisited taking into consideration the hydrology of the entire catchment area. Co-operation and data sharing with these neighbouring countries will assist in this regard. For example, a palaeoflood study by Boshoff and Kovacs in 1993 in the lower Orange River determined that approximately 550 years before present a flood peak of 28 000 m3/s passed down the river. This finding could increase the K-value for the Lower Orange River from 2.8 to 3.18 (Boshoff et al., 1993). Further studies to verify these results, using newer palaeoflood techniques, will assist in updating TR 137 for this shared river, which will benefit both neighbouring countries.
Some areas within Namibia are poorly represented regarding flood peaks and rainfall data, such as the Namib Desert, the northwest and parts of the Kalahari. Data capturing in these remote areas will assist in increasing the reliability of flood modelling in Namibia.
Note: this study only considers catchment areas larger than 1 km2. The 'storm zone' for areas smaller than 1 km2 is not included and can be used as described in TR 137 (Kovacs, 1988).
PALAEOFLOOD HYDROLOGY
The term 'palaeo' refers to ancient or old in geological scales, however the majority of palaeoflood studies involve the study of prehistoric (last 5 000 years), historic (last 1 000 years) and modern (last 50 years), and even more recent floods in ungauged basins. It is not the time scale of flooding that defines palaeoflood hydrology but the fact that flood evidence derives from the lasting effects of floods on natural recording indicators (palaeostage indicators) (Benito et al., 2004).
Critics of palaeoflood hydrology discredit it due to the indirect approach of determining the flood peak of floods which occurred long ago. But it must be noted that in this modern day extreme floods may damage or wash away stage recorder instruments and in these cases the indirect approach is also used by hydrologists to determine the flood peak (Enzel, 2009). There is no difference in the indirect approach applied to a modern day flood or applied to a flood which occurred several hundred years ago; the stage indicator must simply be clearly defined.
Bedrock channels are the most suitable geomorphologic settings for reconstructing palaeoflood discharges because of their stable geometry (Benito et al., 2004). Incision of a river into the bedrock is very slow and occurs over geological time. Therefore the cross-sectional profile of a bedrock river is assumed to have remained stable since the time when the flood occurred (Enzel, 2009).
Upper bound to flood magnitudes
Since palaeoflood hydrology contains evidence of the largest floods over millennial timescales, this can be used to prove that there is an upper bound to floods. In the past some authors (e.g. Klemes, 1987) have hypothesised that there is no upper limit to flood magnitude in a given basin because there could always be 1 mm more rain than there is in any conceivable rainstorm. However, Enzel et al. (1993) has pointed out that this is a fallacious argument following from the inability of the human mind to stop extrapolating.
The palaeoflood method
The palaeoflood sites used in Namibia were selected in river channels incised into bedrock. These sites are in mountainous areas or in canyons. During floods, valley margins are inundated and subjected to eddies, backflood-ing, flow separation and water stagnation. The significant reduction in flow velocities in these areas (<1 m/s) promotes rapid deposition of the fine-grained fraction of the suspended load. The resulting slack-water flood deposits commonly contain sedimentary structures and textures reflecting flow energy, direction and velocities. Slack-water depositional environments commonly include: (i) areas of channel widening, (ii) severe channel bends, (iii) obstacle hydraulic shadows where flow separation causes eddies, (iv) alcoves and caves in bedrock walls, (v) back-flooded tributary mouths and valleys, and (vi) on top of high alluvial or bedrock surfaces that flank the channel (Baker and Kochel, 1988; Benito et al., 2003a).
Vertical excavations in the flood sediment banks in the tributaries expose the stratigraphic layers associated with individual flood events. Textures are commonly dominated by sand and silt deposits. Flood chronology can be obtained from optical stimulated luminescence dating. Samples are collected by hammering opaque PVC cylinders (diameter at least 10 mm and length approximately 300 mm) into a clean vertical exposure until completely filled with sediment. The elevation of the top of each layer is determined relative to the river channel, and is used as an indication of minimum flood discharge associated with the stratigraphic unit. The determination of flood ages and discharges associated with the flood stratigraphic evidence are then the basis for flood frequency analysis.
The hydraulic model
The discharge estimates associated with the palaeoflood slack-water deposits are calculated using the energy equation applied in a one-dimensional flow model. Flood stage indicators are surveyed, as well as several cross-sections in the river channel upstream and downstream of the palaeo stage indicator sites. At each cross-section, signs of upper bound floods are searched for and also surveyed.
Applying the step backwater Hec Ras model (Hydrologic Engineering Centre, 2001), the roughness coefficients are selected which best represent the upper bound flood marks along the river channel. These roughness coefficients are then applied to the model for lower stage indicators as well.
Two principal sources of error are: (i) an underestimation of the palaeodischarge due to the unknown level of the flood waters above the deposited sediments, and (ii) changes in the valley cross-section. The first can be approached by the study of sedimentology of the flood deposits, which has shown that the top of the deposit is very close to the flood stage. The second can be dealt with by conducting the palaeostudy in a bedrock channel, which is significantly more stable than alluvial flood-plain channels, for example, and will not have been substantially altered over the past centuries to millennia (Benito et al., 2004).
DATA SOURCES AND METHODS
The data required for this study was the 3-day maximum rainfall and the monthly instantaneous flood peak data. The extreme rainfall data were required to aid in the identification of K-value zones or isolines used in the RMF method. These data were obtained from the Namibia Meteorological Service in Windhoek and from the Hydrology division of the Namibia Department of Water Affairs.
Rainfall data
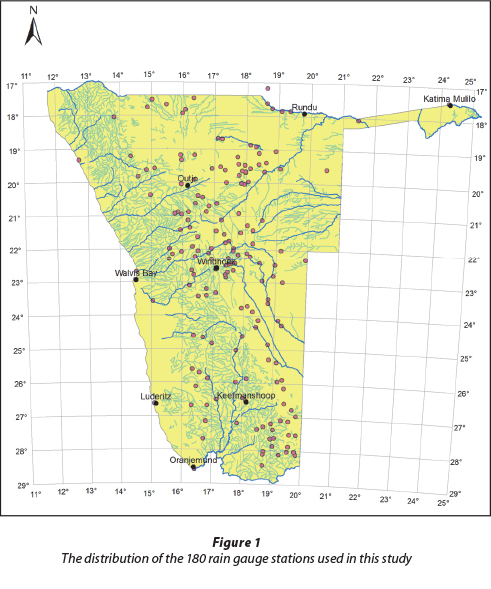
The Namibia Meteorological Office in Windhoek made available daily rainfall data from 434 rain gauge stations spread throughout Namibia. The total number of recorded years of data is 14 100 years. After a process of removing several gauge stations with incomplete geo-referencing, and also reducing the list to only stations with more than 30 years of recorded data, the list shrank to 180 gauge stations with a combined data record of 10 343 years. Figure 1 shows the distribution of the 180 rain gauge stations that were used in this study.
In TR 137, Kovacs used approximately 110 rain gauge stations. The combined data record length of these stations is unknown.
To resolve two cases of missing rain gauge data, the following approach was followed:
- The missing daily data, represented by a star (*) in the original record, was replaced with a zero rainfall value. This was required for the algorithm to determine the 3-day maxima. Note that in most of the cases of missing daily data, the rain gauge data before and after the day(s) with gaps was zero. No cases were found where there was missing data with significantly high rainfall recorded in the days before and after the missing data. Therefore this approach, i.e., to replace missing data with zero rainfall, is deemed to provide realistic results and the 3-day maxima are not expected to be underestimated because of this approach.
- In the case of the missing months, those data were omitted in further calculations. This occurrence of missing months is only a small fraction of all data, and in many cases outside the rainy season. Generally, when significant rainfall occurs, the individuals recording the data are more attentive to properly record the data and therefore it is expected that the results of the 3-day maxima are representative of the actual events.
The sum of 3 consecutive days of rainfall was calculated for each day of the 14 100 years of data. This was done by summing the total precipitation on the day before the reference day, on the reference day itself, and on the day after.
For each rain gauge station, having obtained the 3-day sum of rainfall for every day of recorded data, the maximum for each month was determined as well as the maximum for the recorded history of the station.
Flood peak data
The Namibia Department of Water Affairs (NDWA) provided maximum monthly instantaneous flood peak data for 55 river gauging stations throughout Namibia. From these 55 stations a total of 1 887 station years of gauged data are available. On average, each of these stations has been operational for 33 years. This corresponds to the age of most of the stations which were commissioned in the late 1970s to the early 1980s. Exceptions are the Kavango and Zambezi Rivers in the north, which have records exceeding 60 years, and the Fish River in the South at Seeheim with more than 50 years of data.
In TR 137, there are a total of 64 gauging stations with recorded flood peaks which were used to calculate K-values for Namibia. Eighteen of these gauging stations are duplicated in the latest NDWA list of 55 gauging stations. Note that of these 18 gauging stations, 4 recorded newer flood peaks which exceeded those used in TR 137. The other 14 in TR 137 are still the largest recorded floods. Therefore, after omitting the 14 flood peaks which duplicate those in TR 137, the latest NDWA list of gauging stations reduces to 41.
The TR 137 data set was reduced from 64 to 60 by omitting the 4 stations which are also found in the new data set, but with larger floods. Therefore a systematic gauging station data set of 101 flood peaks was used in this study; 60 flood peaks from the TR 137 and 41 flood peaks from the latest NDWA list.
Raw data
The data for each individual river gauging station or flood-recording site consisted of the year and month, and the size of the recorded peak discharge in cubic metres per second for each month, as well as the NDWA Quality Code for each month's peak. Note that some months have zero discharge, so the 'peak' for the month is zero. Note that the NDWA Quality Code indicates whether the recorded flood peak was obtained from a good continuous record (Code 1), good quality edited data (Code 2), or generated recession (Code 10), etc.
A separate file was provided by NDWA which indicated the geographical position of the gauge station in degrees and minutes, and also the size of the catchment area of each of the gauging sites. Refer to Fig. 2 below for the distribution of flood peak sites in Namibia used in this study.
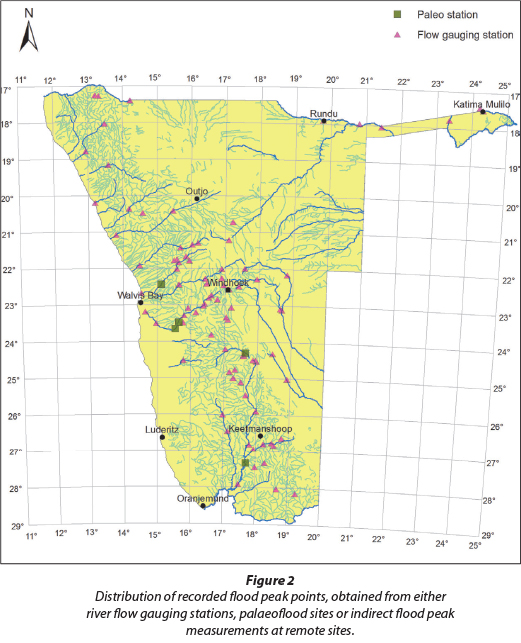
For the duration of the recorded data, the maximum peak discharge was selected for hydrological year cycles, 1 October to 30 September. From all the selected annual peaks, the highest peak was then selected for each specific station as the maximum flood peak. The quality code for the specific peak was also attached for later evaluation of the data quality.
This process could have been simplified by selecting only the largest peak from the bulk of the data for each station. However, from the approach followed here, other valuable information is made available such as distribution of the peak months; refer to Fig. 3 below for the monthly distribution of the flood peaks.
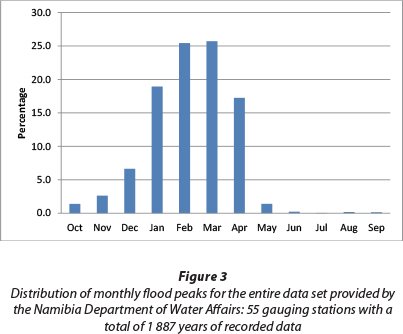
It is interesting to note that of the 1 887 recorded years of newer data, 369 hydrological years recorded zero flow. This is equal to approximately 20% of the time.
Validation of the new data
Validation of the 41 additional flood peaks consists of 2 checks; the first is the NDWA Quality Code for each flood peak. The second is a comparison of the gauged flood peak with the calculated 10-year flood peak for each specific gauge point. This is to ensure that the flood peak will have a significant contribution to determining the K-value.
Data quality
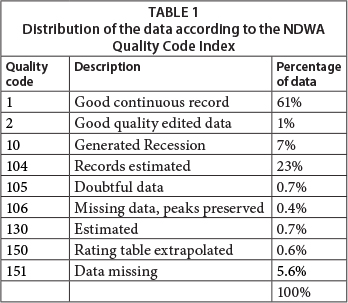
Refer to Table 1 for the distribution of the data quality. The quality of the data received from NDWA is not questioned since, in the least, a quality control process applied to measured data is indicative of a mature data collection system and is commendable. This discussion focuses attention on the distribution of the quality of the data; 61% of all the flood peaks are from a good continuous record; 23% of the flood peaks are estimated records; less than 1% of the data is questionable; and 6% is missing. Note that the NDWA quality code guide extends further than the nine codes indicated in Table 1; these were the only ones applicable to the selected flood peaks of the 41 new stations used in this paper.
Verifying flood peaks as large floods
In order to validate that the magnitude of the floods used in this study is larger than the 10-year flood, the measured flood peaks were compared with flood peaks estimated from the river channel parameters which are indicators of the 10-year flood, i.e., the width of the natural stream measured between the riparian vegetation on the left and right bank of the river. The 10-year flood is the discharge that has the dominant impact on river channel fluvial morphology, as determined by Beck and Basson (2003).
Several regime equations for calculating the river width are available and are based on parameters such as the channel width between the riparian vegetation. One of these equations, contained in the work of Beck and Basson (2003), is applicable to bankfull discharge in sandy/silty bed rivers. The units in the equation are in feet (ft); the equation reads as follows:
where:
P = the wetted perimeter of the bankfull river channel in feet (ft). Note that for this exercise the wetted perimeter is assumed to approximate the width of the bankfull channel; ephemeral river channels in Namibia are relatively flat and shallow.
Qb = the bankfull discharge in cusec (ft3/s)
Satellite images (Google Earth) were used to determine the bankfull width of the river for each of the gauging stations used. If a weir was detected at the site of the flood peak, then the width of the river was measured several hundred metres upstream or downstream, away from the influence on stream width caused by the weir. Applying Eq. (5.1), the estimated 10-year flood peak for each site could be determined, and could be compared with the flood peak data received from NDWA. In all cases the NDWA flood peak discharges were larger than the calculated 10-year discharge.
Completeness of the data set
It should be noted that there are large areas in Namibia without any gauging stations or recorded flood peaks. These are the north-western and south-western parts of the Namib Desert, and also the Kalahari Desert in the north-east and east where runoff does not occur or very seldom occurs. Flood peak data should be gathered in these areas to get a better representation of flood data over the entire country. Palaeoflood techniques can be employed to gather this data. Note however that drainage channels seldom make their way through the dunefields of the deserts, and most of the time the rivers disappear in the desert, like the Tsauchab River. Hence, searching for flow data in the dune fields is impractical.
Palaeoflood peaks
Several palaeoflood studies have recently been conducted in Namibia; the WADE study (Flood Water Recharge of Alluvial Aquifers in Dryland Environments) in the Kuiseb and Gaub Rivers from 2006 to 2009, as well as studies in the upper and lower Fish River in 2009, and in the Khan River in 2006. Six high flood peaks were estimated at these sites with evidence indicating that four of these peaks are upper bound, i.e., the highest floods in possibly thousands of years.
Two of the upper-bound peaks were estimated in the upper and lower Fish River with discharges estimated at 6 400 m3/s at Vogelkranz upstream of Hardap Dam, and 16 140 m3/s at Echo campsite in the Gondwana Wilderness Park near the Fish River Canyon. One upper-bound flood peak of 1 600 m3/s was estimated at Khan Mine downstream of Usakos (Greenbaum, 2011). Two flood peaks in the Kuiseb River, of which one is an upper-bound flood, were estimated at a site approximately 2 km upstream of its confluence with the Gaub River (1 450 m3/s). The two remaining floods were not considered upper bound but were still seen as significant; one in the Kuiseb River approximately 35 km downstream from its confluence with the Gaub River with a peak of 800 m3/s and the other in the Gaub River just upstream of its confluence with the Kuiseb River estimated at 400 m3/s (Grodek et al., 2013).
THE K-VALUES
Franco and Rodier (Kovacs, 1988) found that when flood peaks were plotted against corresponding catchment areas, then the envelope curves for hydrologically homogeneous regions were straight lines, specifically for catchment areas larger than about 100 km2. Refer to Eq. (6.1).
where:
Q = flood peak (m3/s)
106 = mean annual discharge from all drained land on earth (m3/s)
A = the drainage area (km2)
108 = the total drained land surface on earth (km2)
K = the regional coefficient expressing relative flood peak magnitude
Kovacs proposed in TR 137 that the gross catchment area should be changed to the effective catchment area, i.e., the part that actually contributes to flood generation. Hence in Eq. (6.1), the area (A) in km2 is replaced with effective area (A) in km2. In Namibia however the gross catchment area was used to determine the K-values.

Assuming that the RMF = Qmax for the maximum flood peak measured/estimated at each gauging site, then the equation can be rewritten to find the K-value for a flood peak:
The K-value was calculated for each flood peak.
K-value results
As calculated in TR 137, the highest K-value, of 5, occurs around Windhoek in Central Namibia. The lower Fish River however has a K-value of 4.6 which is higher than the 4.0 indicated in TR 137. This resulted from a palaeoflood study performed there in 2009 (author's own unpublished data). In general the new values are the same as in TR 137; however, the additional flood peaks extended the flood zone boundaries in the central Kalahari, and in northern and southern Namibia.
As discussed in TR 137, negative K-values do occur where the catchments are very flat, permeable, dry or large and swampy. Such cases were encountered with the Black Nossob River which runs through the Kalahari. It has a dry flat catchment area of 8 160 km2 measured upstream of gauging station Mentz, with a maximum measured flood of only 33.6 m3/s. In this case the K-value equalled -0.93. Another case is the Kwando River which flows from Angola, crosses the Caprivi Strip at Kongola, and passes on into Botswana. Upstream of Kongola, the catchment area is 170 000 km2, with flat marshland in Angola, and the maximum flood peak measured is only 120 m3/s. This produces a K-value of -4.15. Refer to Table A1 in the Appendix.
The transition zone
The flood data points indicate that 100 km2 provides an 'upper boundary' for the transition zone of all of the K-values in Namibia. This approach is similar to the work of Franco-Rodier (Kovacs, 1988). By applying this approach, one reduces the size of the RMF in the transition zone for K-regions 2.8, -3.4 and -4.0. Refer to the new equations for the transition zones as displayed in the Appendix, Figs A6 to A10.
DELIMITATION OF MAXIMUM FLOOD PEAK REGIONS
The parameters which govern the delimitation of the regional flood boundaries are the calculated Franco-Rodier K-values, the maximum recorded 3-day storm rainfall depths, the topography, geological features (soil permeability) and, to a lesser extent, the vegetation types. Of these factors the K-value is the most important, followed by the 3-day rainfall. Note that the 3-day rainfall is relatively high in the east and north-eastern part of the country; however, the K-values are not. This can be attributed to the unconsolidated sediments of the Kalahari Desert: vegetation in the central and northern Kalahari is tree savannah and woodland which indicates significant rainfall, but the small slope (1:4000) and high infiltration significantly reduce the flood peak discharge. A rainfall-runoff (or non-runoff) event in the western Kalahari at the farm Uhlenhorst is also worth noting:
The Uhlenhorst anomaly
An event worth noting occurred near the Uhlenhorst settlement, which lies on the western rim of the Kalahari, roughly 100 km northeast of the town Mariental. The average rainfall in this area is 250 mm per annum. In 1960 a significant rainstorm, measuring between 400 and 489 mm, fell over a period of 12 h on several neighbouring farms, an area of approximately 115 km2 (Schalk, 1961).
It started on 24 February 1960 at approximately 23:00 and ended at 11:00 the next morning. In the 24 h prior to this downpour there was approximately 35 mm of rain in the same area. Hence the soil was already drenched before the large rainstorm.
A larger area of approximately 1 000 km2 surrounding the Uhlenhorst area received at least 100 mm of rainfall. Schalk (1961) estimated that approximately 230 million m3 of water had precipitated. He also determined by measurement that approximately half of the water infiltrated into groundwater reserves/aquifers and the balance was lost through evapotran-spiration. After 3 months, all the pans and wetlands were dry again. Overland flow occurred where water collected in the natural pans commonly found in the area, and also in depressions between the dunes. As the pans filled up, they started spilling toward the southeast in the natural drainage direction. The flowing water however was stopped by dunes and could not reach the Auob river channel several kilometres south of the flood area (Schalk, 1961).
A sudden infiltration of a large portion of the rainwater can be attributed to seepage underground through aligned karstic hollows (Goudi, 2002). There are numerous depressions and pans in the area. According to Goudi (2002) the southwestern part of the Kalahari, called the Weissrand, is underlain with calcretes with considerable thickness; over 30 m at places. These thick pure calcretes may be susceptible to karstification. Karst is highly permeable and hence would have contributed significantly to a loss of surface run-off.
Delimitation of the maximum flood peak regions
Several parameters were considered in determining the boundaries for the K-value isolines. These were applied in sequential order from the most important parameter, the K-values, to the least influential parameter, the vegetation distribution. Revisiting the initial parameters after completing the delimitation process allowed for some fine tuning. The flood zones are grouped similarly to TR 137, starting at 2.8 and increasing incrementally in steps of ΔK = 0.6 up to K = 4.6 and then with ΔK = 0.4 up to K = 5. K = 5 is the highest K-value for Namibia. The steps were as follows:
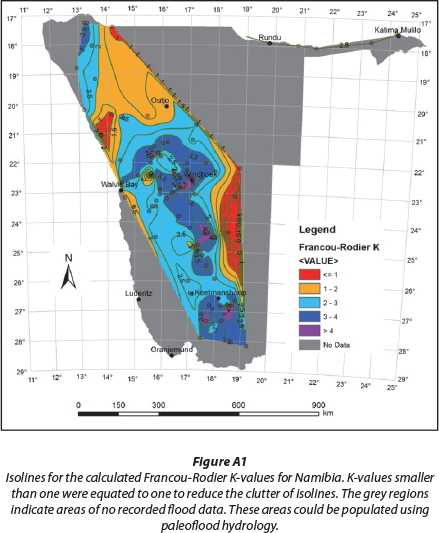
- The K-values: The K-values were plotted using GIS, and isolines connected the points of equal value. Initially the raw calculated K-values were used, but the negative K-values created large variations over short distances in some cases. This cluttered the workspace with unnecessary lines and subsequently all negative values and values smaller than one (1) were replaced with a one (1). Refer to Fig. A1 in the Appendix.
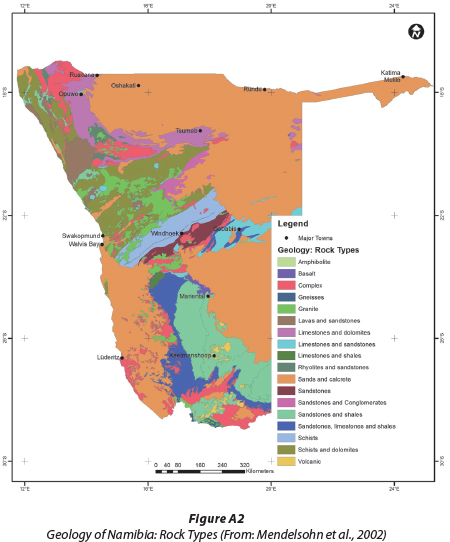
- The geology: Although the geology of Namibia is not ranked higher than the 3-day rainfall, the reason it is considered first is to delineate the desert boundaries. With reference to the Uhlenhorst cloudburst with no significant flooding of any rivers, it is quite obvious that relatively high 3-day rainfall in the Kalahari will not produce as much runoff as a similar rainfall in the mountainous central parts of Namibia. Refer to Fig. A2 in the Appendix.
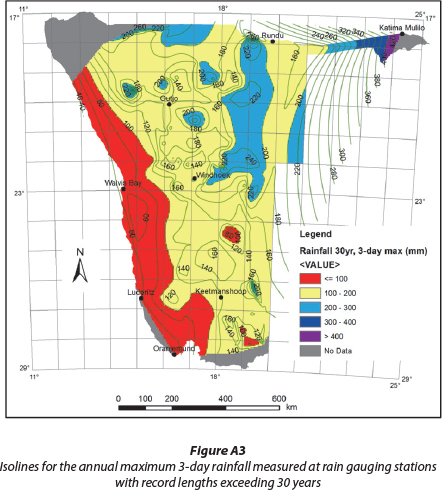
- The 3-day maximum rainfall: The 3-day rainfall points were also plotted in a GIS model space with isolines connecting points of equal rainfall depth. Using the rainfall lines as a background, the K-value isolines were altered to follow the rainfall lines where few or no K-value points were available. Although the north-eastern Kalahari had relatively high 3-day rainfall, the runoff potential of the Kalahari remained low; hence this area is represented by the lowest K-value; 2.8. Refer to Fig. A3 in the Appendix.
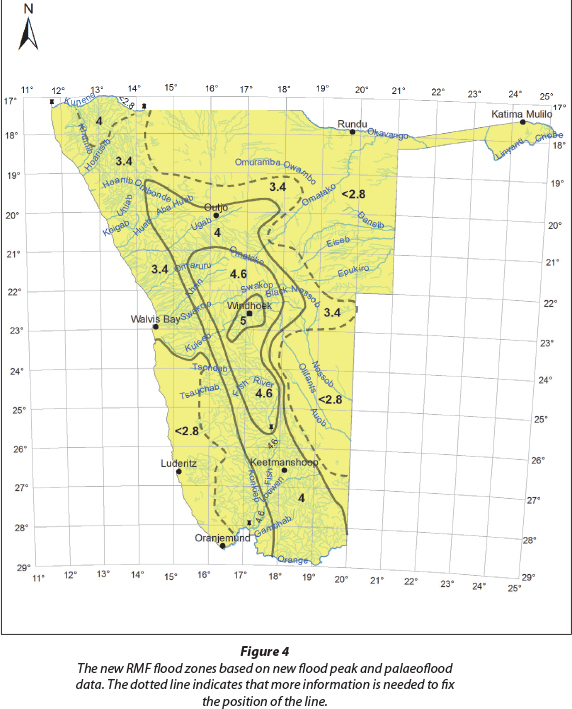
- Existing rivers: Several large river channels had K-values relatively higher than the surrounding K-values or larger than the local rainfall depths would tend to predict. These rivers have their origin in the central highlands which have a higher rainfall and hence high flood-generating potential. These rivers then flow through the drier southern or coastal parts of the country. In these cases the flood zone K-value will be dominated by the local K-values/rainfall, while the river channel would receive a unique K-value. Such as the lower Fish River where the local K-value is 4; however, the river channel receives a K-value of 4.6 due to the palaeoflood data. Refer to Fig. 4.
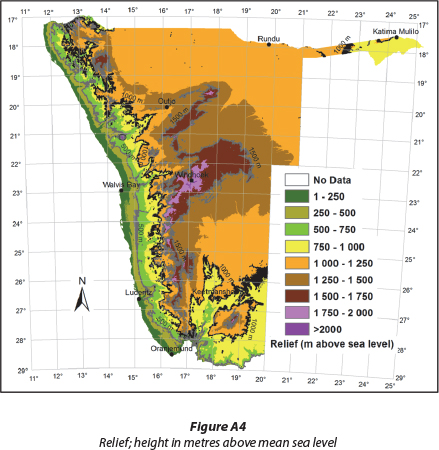
- Topography: The flood zone lines generated in the previous step are then placed on a contour map of Namibia. The coastal escarpment plays a dominant role regarding rainfall patterns; therefore this escarpment line provided a guideline for nearby flood zone lines to follow. The topography also provides guidance regarding the edge of the flat Oshona region in the north which drains into the Etosha Pan, which delineates the higher run-off potential to the south and the lower run-off potential to the north for the same 3-day rainfall figures. Refer to Fig. A4 in the Appendix.
- Revisit geology: The central Kalahari Desert, from east of Windhoek to the town of Gobabis, has a limestone and sandstone protrusion which is also clearly visible on contour maps. This elevated stretch of land also forms the watershed between the north-flowing and south-flowing rivers of the Kalahari. This area is not covered with sand and has numerous river channels incised into the rock. The low Kalahari K-value line was moved around this area, making this flood zone K = 3.4. This K-value better suits the rainfall patterns and geology of the central Kalahari. Also visible in the geology is the dolomitic area to the south-west of the Etosha Pan. Although the elevation and rainfall predict high runoff potential, this area has few streams flowing out of it. Therefore this area receives a low K-value.
- The river systems: After the delineated lines had received a second geology-map pass, the newly altered flood zone lines were placed on top of a map indicating all river channels which were generated from satellite survey data (topography of Namibia). This check was only done to increase the flood zone boundaries where required, and not to reduce them. This allowed some adjustment around the edges of the dolomitic area in the north as well as the limestone/sandstone zone in the east through the central Kalahari.
- Vegetation map: At this stage the flood zone lines were well defined and delineated with the available data. The flood zone lines were superimposed on the vegetation map merely as a check for any possible anomalies. It was found however that the flood zone lines and areas correspond well with the vegetation types since the vegetation boundaries are closely linked to the topography, the geology and the rainfall patterns. Therefore no changes were made on account of the vegetation map. Refer to Fig. A5 in the Appendix.
- Sparse or no data: As a last check, the areas with sparse or no data regarding rainfall or flood peaks were revisited. Such areas are found in the southern and southwestern part of Namibia where low rainfall predicts low runoff. However, the uncertainty in actual K-values forces these flood zones to a higher increment of K-values.
RESULTS
The flood zones delineated in this report correspond well with the zones indicated in TR 137, which would be expected since many of the same flood peaks used in TR 137 are still the dominant peaks today. The additional data points, however, have expanded the boundaries of the flood zones in some parts. This can be expected since the previous data set which generated the TR 137 flood zones will remain dominant unless a larger flood or K-value forces the zone line to enclose a larger area.
Four of the TR 137 listed flood peaks were exceeded in the past 30 years. One of these is the Tsauchab River at Sesriem (on the eastern edge of the Namib Desert), which increased in flood size from 222 m3/s to 360 m3/s. This changed the K-value from 2.44 to 2.87. These were incorporated in the delimitation of the new zones.
The palaeoflood data also made a significant contribution, not only in providing upper-bound flood peak data, but also because it populated remote areas with new data. The RMF flood zones were increased due to the contributions made by the palaeoflood data.
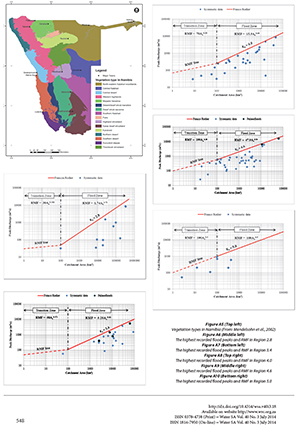
Refer to Fig. 4 for the new flood zones of Namibia. Also refer to Figs A6 to A10 in the Appendix for the distribution of the highest recorded flood peaks in each of the zones, as well as the relevant RMF line. Equations for the calculation of the RMF flood are included in Figs A6 to A10.
ANNUAL RECURRENCE INTERVAL OF THE RMF FLOOD
By utilising probabilistic methods one can estimate the annual recurrence interval of extreme events and the RMF. The maximum instantaneous flood peak of each year is selected to represent the random behaviour of the stream (Górgens, 2000). Although the high end tails of frequency distributions are not well defined, using mathematical probability distribution functions which are known to have appropriate high-end tails one can quantify the magnitude of design floods.
The best-fit distribution was selected from the Log Normal, the Log Pearson 3, and the General Extreme Value models. In some cases the average of two or three of the distributions was used if it produced a better representation. A problem encountered with the probabilistic approach in an arid country is the many zero flood peaks, i.e., no flow during a year. At some gauging stations the annual zero flow data occurs 30% of the recorded time. A discussion with the Flood Hydrology Division of the South African Department of Water Affairs (Rademeyer, 2013) pointed out that zero flow lies on the lower end of the distribution. Hence, when treating zero-flow data in the same way as one would treat missing data, one can still get a representative plot on the upper tail of the distribution of the data. This approach was adopted in this work.
The recurrence of the RMF is where the magnitude of the RMF crosses the best-fit distribution of the data. The recurrence interval of the RMF can then be estimated from the graph. Refer to the Appendix for data on the river gauging points, as well as the estimated annual recurrence interval for the RMF's as determined above.
For the river gauging stations with systematic data which were used in this study, 86% of the RMF floods have annual recurrence intervals equal to or exceeding 10 000 years, 2% have recurrence intervals exceeding 5 000 years but not exceeding 10 000 years, and 12% have recurrence intervals exceeding 1 000 years but not exceeding 5 000 years.
DISCUSSION
The flood zone boundaries as indicated in TR 137 were extended in several places as a result of the new data presented in this report. The boundary between the Transition Zone and the Flood Zone is now 100 km2 for all five of the K regions applicable to Namibia; these regions are 2.8, 3.4, 4.0, 4.6 and 5.0. In TR 137 the boundary is 500 km2 for K = 2.8 and 300 km2 for K = 3.4 and -4.0. This change implies that the Transition Zone RMF flood peaks will be marginally smaller than before. Thirty years of additional flood recording, as well as several new gauging stations, increased the systematic data record from 2 759 years of recorded data, which was used to generate the flood zones in TR 137, to 4 169 years for this present study.
Palaeoflood data, especially the upper-bound data, provided flood peak information in remote areas. This helped to populate the surface of Namibia with flood peaks and hence helped to increase or verify the boundaries of the K-value zones. Since the hyper-arid regions of Namibia preserve flood stage indicators very well, more palaeoflood studies can be performed which would increase the distribution of flood data in the country, especially in the arid regions where it is impractical to build and maintain gauging weirs. This also counts for K-region 2.8 and -3.4 where very little flood peak data is available for areas smaller than 100 km2.
CONCLUSIONS
From the findings of this report, the following conclusions are drawn:
- The extended data records of the TR 137 flood stations, as well as the new flood gauge stations and palaeoflood peaks presented in this report significantly increase the available flood peak data and contribute to the new delimitation of RMF flood zones in Namibia.
- Generally, any new flood data can only increase the influence area of the RMF flood zones, and not reduce it: if any newer flood peaks in an area produce K-values smaller than the previous values, then the largest value will dominate, hence keeping the flood zone as it was. However, should a newer flood produce a larger K-value, then the newer value dominates and will likely have an influence on a nearby flood zone line by increasing the zone area.
- Palaeoflood studies provided valuable upper-bound flood data and also provided this data in remote areas where it would otherwise be difficult to obtain.
- More palaeoflood investigations should be done to increase the database into remote areas where, alternatively, it would take considerable capital investment and years of data capturing before any significant flood data were available. New investigations should also include flood peak data for catchments smaller than 100 km2 in the K regions 2.8 and 3.4.
- RMF values in the transition zone will reduce marginally from those presented in TR 137.
- The new delineated RMF flood zones may be applied to determine extreme floods in Namibia.
- Probabilistic analysis of annual recurrence intervals of the predicted RMF's generally are equal to or exceed 10 000 years, similar to the findings of Van der Spuy (2008).
ACKNOWLEDGEMENTS
The author wishes to thank the late Mr Guido van Lagenhove of the Namibia Department of Water Affairs and also Ms Siglande Somses of the Namibia Meteorological Office in Windhoek for providing the flood peak and the rain gauge data, respectively. Thanks also to staff from the Namibia Water Corporation, in particular Ms Janine Vorster and Mr Sabbat Hauwanga, for assisting in data processing for this research. I would also like to thank Messrs Danie van der Spuy and Pieter Rademeyer of the Flood Studies division of the South African Department of Water Affairs for their assistance regarding the probabilistic analysis of the data.
REFERENCES
BAKER VR and KOCHEL RC (1988) Flood sedimentation in bed-rock fluvial systems. In: Baker VR, Kochel RC and Patton PC (eds.) Flood Geomorphology. John Wiley & Sons Ltd., New York. 123-137. [ Links ]
BAKER VR, WEBB RH and HOUSE PK (2002) The scientific and societal value of paleoflood hydrology. In: House PK, Webb RH, Baker VR, Levish DR (eds.) Ancient Floods, Modern Hazards: Principles and Applications of Paleoflood Hydrology. Water Science and Application Series Vol. 5. American Geo-physical Union, Washington DC. 127-146. [ Links ]
BECK JS and BASSON GR (2003) The Hydraulics of the Impacts of Dam Development on the River Morphology. WRC Report No. 1102/1/03. Water Research Commission, Pretoria. [ Links ]
BENITO G, RICO M, THORNDYCRAFT VR, SÁNCHEZ-MOYA Y, SOPENA A, DÍEZ HERRERO A and JIMENEZ A (2006) Paleoflood records applied to assess dam safety in SE Spain. In: Ferreira R, Alves E, Leal J, Cardoso A (eds.) International Conference on Fluvial Hydraulics, 6-8 September 2066, Lisbon, Portugal. 2113-2120. [ Links ]
BENITO G, SANCHEZ-MOYA Y and SOENA A (2003b) Sediment-ology of high-stage flood deposits of the Tagus River, central Spain. Sedimentology 157 107-132. [ Links ]
BENITO G and THORNDYCRAFT VR (2004) Systematic, Paleoflood and Historical Data for the Improvement of Flood Risk Estimation: Methodological Guidelines (1st edn.). CSIC, Madrid. 116. [ Links ]
BOSHOFF P, KOVACS Z, VAN BLADEREN D and ZAWADA PK (1993) Potential benefits from palaeoflood investigations in South Africa: technical note. J. S. Afr. Inst. Civ. Eng. 35 (1) 25-26. [ Links ]
ENZEL Y, ELY LL, HOUSE PK and BAKER VR (1993) Paleoflood evidence for a natural upper bound to flood magnitudes in the Colorado River basin. Water Resour. Res. 29 2287-2297. [ Links ]
ENZEL Y (2009) Personal communication, October 2009. Prof Yehouda Enzel, The Freddy and Nadine Herrmann Institute of Earth Sciences, The Hebrew University of Jerusalem, Givat Ram, Jerusalem 91904, Israel. [ Links ]
GORGENS AMH (2000) Chapter 5, Probabilistic Methods. Hidrologie 414 (Vloedhidrologie) lecture notes, Stellenbosch University, Engineering Faculty, Civil Engineering. [ Links ]
GOUDIE AS (2007) Desert landforms in Namibia - a Landsat interpretation. In: Goudie AS, Kalvoda J (eds.) Geomorphological Variations. P3K, Prague. 19-36. [ Links ]
GREENBAUM N (2011) Personal communication, January 2011. Department of Natural Resources and Environmental Management, University of Haifa, Haifa, Israel. [ Links ]
GRODEK T, BENITO G, BOTERO BA, JACOBY Y, PORAT N, HAVIV I, CLOETE G and ENZEL Y (2013) The last millenium largest floods in the hyperarid Kuiseb River basin, Namib Desert. J. Q. Sci. 28 (3) 258-270. [ Links ]
HYDROLOGIC ENGINEERING CENTER (2001) HEC-RAS, River Analysis System, Hydraulics Reference Manual. US Army Corps of Engineers, Washington. [ Links ]
KLEMES V (1987) Hydrological and engineering relevance of flood frequency analysis. In: Singh VP (ed.) Hydrologic Frequency Modelling. D Redel, Norwell, Mass. 1-18. [ Links ]
KOVACS Z (1988) Regional Maximum Floodpeaks in Southern Africa. Technical Report TR 137, Directory of Hydrology, Department of Water Affairs, Pretoria, South Africa. [ Links ]
MENDELSOHN J, JARVIS A, ROBERTS C, ROBERTSON T (2002) Atlas of Namibia: A Portrait of the Land and its People. Namibian Ministry of Environment and Tourism. David Phillip, Cape Town. [ Links ]
NATIONAL RESEARCH COUNCIL (1985) Safety of Dams, Flood and Earthquake Criteria. National Academy Press, Washington. 321. [ Links ]
RADEMEYER P (2013) Personal communication, 14 March 2013. Mr Pieter Rademeyer, Scientific Manager - Flood Studies, Directorate: Hydrological Services, Department of Water Affairs, Pretoria. [ Links ]
SCHALK K (1961) The water balance of the Ulenhorst cloudburst in South West Africa. CCTA Publication 66. Nairobi 1961. [ Links ] TASKER GD and STEDINGER JR (1987) Regional Regression of Flood Characteristics Employing Historical Information. J. Hydrol. 96 255-264. [ Links ]
VAN DER SPUY D (2008) Personal communication, April 2008. Mr Danie van der Spuy, Specialist Engineer - Flood Studies, Directorate: Hydrological Services. Department of Water Affairs, Pretoria. [ Links ]
Received 26 November 2013;
Accepted in revised form 27 June 2014.
* To whom all correspondence should be addressed.+264-61-307297; email: gcloete@knightpiesold.com


