


Servicios Personalizados
Articulo
 Inglés (pdf)
 Articulo en XML
 Referencias del artículo
Indicadores

Links relacionados
-
 Citado por Google
 -
 Similares en Google
Compartir

 Permalink
Water SA
versión On-line ISSN 1816-7950
versión impresa ISSN 0378-4738
Water SA vol.40 no.3 Pretoria jun. 2014
http://dx.doi.org/10.4314/wsa.v40i3.17
Treatability of South African surface waters by enhanced coagulation
KP Lobanga*; J Haarhoff; SJ van Staden
Department of Civil Engineering Science, University of Johannesburg, PO Box 524, Auckland Park, 2006, South Africa
ABSTRACT
The majority of South African inland surface water sources are compromised due to a long-standing national policy of mandatory return flows. With renewed emphasis on the removal of organic carbon in the latest SANS 241 water quality standard, many South African water treatment managers may need to consider adoption of enhanced coagulation (EC) in the near future to achieve both turbidity and NOM removal. From the study of 4 South African inland waters, this paper demonstrates that UV254 absorbance provides a more accessible, reliable and rapid way of monitoring NOM at treatment plant level. This report also provides a detailed procedure for determining the dosages for EC in terms of UV254 absorbance at jar test level. Using ferric chloride as coagulant, a correlation was established to estimate the coagulant dosage for any desired level of UV254 absorbance removal. This correlation enables a preliminary assessment of EC as a means of planned NOM removal. Should EC promise to be a candidate process for NOM removal, it should be verified at jar test level using the proposed procedure.
Keywords: Natural organic matter, enhanced coagulation, ferric chloride, jar test, UV absorbance, modelling
INTRODUCTION
In conventional water treatment practice, coagulation is generally used for multiple objectives that include maximising particle and turbidity removal, maximising total organic carbon (TOC) and disinfection by-product precursor (DBP) removal, minimising residual coagulant, minimising sludge production and minimising operating costs (Edzwald and Tobiason, 1999). Enhanced coagulation (EC), on the other hand, requires higher coagulant dosage to achieve the single objective of better removal of natural organic matter (NOM) (Edzwald and Tobiason, 1999; USEPA, 1999; Xiao et al., 2013). With renewed emphasis on the removal of organic carbon (exemplified by the inclusion of dissolved organic carbon (DOC) in the latest water quality standard SANS 241), many South African water treatment managers may need to consider the adoption of EC in the near future to achieve both turbidity and NOM removal, a process deemed to be one of the best available technologies for the latter (Uyak and Toroz, 2007). Enhanced coagulation is a practical option only when appropriate coagulants are used. Organic polymeric coagulants, despite their advantages of being less pH-dependent, producing less sludge and lower costs, are not used for EC because they are not good at removing NOM; they may even increase the TOC level in water (USEPA, 1999; Nozaic et al., 2001; Bolto and Gregory, 2007). Inorganic coagulants such as aluminium sulphate (Al2(SO4)3∙18H2O) and ferric chloride (FeCl3∙6H2O) are much better at NOM removal. Although both these coagulants are effective at NOM removal, there is emerging consensus that ferric chloride is marginally more effective than aluminium sulphate (Crozes et al., 1995; Bell-Ajy et al., 2000; Uyak and Toroz, 2007; Wang et al., 2011). The decrease in NOM by EC is mostly determined by measuring (TOC), but other measures of NOM such a trihalomethane formation potential (THMFP) and ultraviolet absorbance at 254nm (UV254) have also been used (USEPA, 1999; Bell-Ajy et al., 2000; Freese et al., 2007). Uyak and Toroz (2007), for example, found that conventional coagulation removes about 15% of TOC (range 9% - 20%) while EC removes up to 71% TOC with ferric chloride and 67% with alum. In terms of the THMFP, Garcia (2011) found that the water after EC never exceeded the guidelines, contrary to water treated by conventional coagulation only.
Other than the choice of coagulant, the success of EC depends on a number of factors. The first is the coagulant dosage, with more coagulant providing more metal ions for complexa-tion of organic compounds, which increases NOM removal (Edzwald, 2013). Uyak and Toroz (2007) found that, for 3 different waters, increasing the ferric chloride dosage from 40 mg∙ℓ-1 to 80 mg∙ℓ-1 resulted in an increase in DOC removal from about 18% (range 16% - 20%) to 36% (range 28% - 41%). The second is pH, with lower pH making NOM compounds more hydropho-bic and adsorbable, thus increasing their removal (Crozes et al., 1995; Bell-Ajy et al., 2000; USEPA, 2001; Uyak and Toroz, 2007). At a constant dosage of 80 mg∙ℓ-1 of ferric chloride, Uyak and Toroz (2007) found that the DOC removal increased from 36% (range 28% - 41%) to 60% (range 43% - 71%) after adjusting the pH to 5.5. Crozes et al. (1995) found that decreasing the pH to 6 increased NOM removal by as much as 65% - with the corresponding UV254 absorbance removal improving from 49% (range 32% - 61%) to 71% (range 47% - 84%). Other authors confirmed that the optimal pH of EC is between 5.0 and 6.5 (for example, Harrington et al., 1992; Bell-Ajy et al., 2000). The addition of more acidic coagulant and the lowering of pH are interrelated -more coagulant depresses the pH to a lower level. The alkalinity of the water, therefore, also comes into play. With high alkalinity, the addition of more coagulant only has a small effect on pH, which might inhibit NOM removal somewhat. In addition to coagulant dosage and pH, NOM removal is also a function of its initial concentration and the nature and composition of NOM in terms of charge, molecular weight and hydrophobicity (USEPA, 2001; Eikebrokk et al., 2006; Edzwald, 2013). The specific ultraviolet absorbance (SUVA) has proven to be a valuable and rapid determinant in estimating NOM removal by EC (Edzwald and Tobiason, 2011). High values of SUVA suggest a higher degree of hydrophobicity and better NOM removal. The USEPA has captured the main determinants of EC performance, in terms of TOC, in the two-way table presented as Table 1, quantifying the roles of TOC and alkalinity (USEPA, 1999).

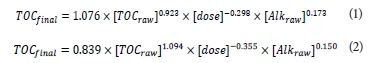
This USEPA table shows that when SUVA < 2 the use of EC for TOC removal is not required. This is because source waters with low SUVA values contain high fractions of non-humic matter that are less amenable to removal by enhanced coagulation (USEPA, 1999). Before conducting expensive laboratory investigations or plant trials, water treatment plant managers naturally wish to be able to estimate, first, how much NOM is likely to be removed by EC and, second, how much additional coagulant is required. A number of such prediction methods have been proposed - some based on adsorption theory and others using statistical correlation. The adsorption theory models have to assume that only a part of the total NOM is sorbable, with the rest not removable by EC. The removal of the sorbable part is then modelled with the Langmuir isotherm (Edwards, 1997; Tseng and Edwards, 1999; Kastl et al., 2004; Kastl et al., 2008). The statistical correlation models do not assume any underlying mechanisms for removal, but simply rely on the best-fitting curves, linking NOM removal, coagulant dosage, and other available parameters (Moomaw et al., 1992; Harrington et al., 1992; Zhu, 1995; Wang et al, 2011). Numerous models have been proposed to establish a relationship between NOM removal and coagulant dosage for both alum and ferric chloride. Some models require analytically sophisticated inputs, for example, size exclusion chromatography (Wang et al., 2011). Most models use the coagulation pH (it is the pH after the coagulant is added) as one of the input parameters, and therefore require prior testing. A number of models do not use the coagulation pH explicitly, but include the coagulant dosage and the raw water alkalinity which collectively determine the coagulation pH. An example of such a model is (Zhu, 1995):
where:
Alkraw : the initial alkalinity of the raw water expressed in meq∙ℓ-1as CaCO3.
TOC raw and TOCfinal : the total organic carbon of the raw water and final water after EC, respectively. dose: expressed in meq∙ℓ4 as Al2(SO4)3.18H2O and FeCl3.6H2O for Eq. (1) and (2), respectively.
The SUVA values for many South African raw waters, due to a long-standing national policy of mandatory return flows to surface sources, are characteristically low in comparison with the research reported internationally. Moreover, many smaller treatment plants do not have access to frequent and reliable TOC measurement. The objectives of this paper are threefold:
- To suggest a standardised test method for EC based on the measurement of UV254 absorbance.
- To evaluate EC for 4 water sources in the inland region, sampled both in winter and in summer or spring.
- To develop preliminary correlations to estimate the likely UV254 absorbance removal and associated ferric chloride demand associated with EC.
MATERIAL AND METHODS
Source water
Four inland South African raw water sources were selected, all compromised in terms of quality and low in colour. Samples were collected in 25 ℓ plastic containers and immediately stored at 4°C in the dark. Each water was collected in 2 different seasons, winter and early summer or spring, making a total of 8 samples. Table 2 summarises the raw quality parameters as well as the sampling sites. Six samples had a SUVA of about 2; only the Vereeniging samples had SUVA values between 2 and 3.

Jar test enhanced coagulation
A day before testing, the water sample was brought to room temperature by removing it from the refrigerator and leaving it in the laboratory. A titration experiment was first conducted on 900 mℓ of raw water using a 20 000 mg∙ℓ-1 solution of FeCl3.
Figure 1 shows an example of a titration curve obtained from the Rietvlei sample collected on 28 August 2012. From the titration curve, the FeCl3 dosages to reach a pH of 7.0, 6.0, 5.5, 5.0 and 4.5 were determined. The jar test experiment was conducted on 900 ml samples using a 6-paddle jar test apparatus FC6S with 1 000 ml beakers. The 5 dosages obtained from the titration curve were used in the first 5 jars, the 6th jar being a control with no coagulant added. The operational procedure consisted of 2 min rapid mixing at 200 r-min-1, followed by 10 min slow mixing at 30 r-min-1 and settling for 30 min. After 30 min, about 50 mℓ of settled water was collected from the middle of each jar. About 10 mℓ of the collected water was used to measure the UV , absorbance after filtration through a 0.45 µm filter while the remaining 40 ml were used to measure the turbidity. The remaining water in the beaker was used to determine the pH, conductivity and temperature. The UV254 absorbance data from the jar test were used to fit a third-order polynomial, as shown in Fig. 2. From the curve obtained the ferric chloride dose to reduce the UV254 , absorbance by 60% was determined.


Analytical methods
Electrical conductivity, pH and temperature were measured by a HANNA HI 98130 combination waterproof pH, EC/TDS and temperature meter. UV254 absorbance was measured with an ULTROSPECT II: UV/Vis spectrophotometer. DOC was measured with a TELEDYNE TEKMAR TOC fusion total organic carbon analyser. Alkalinity was measured by titration and expressed in mg∙ℓ-1 as CaCO3.
Curve-fitting techniques
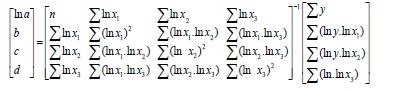
Two model structures were considered for this research. They have the following forms, here demonstrated for 3 independent parameters:
The constants were derived from the use of sum of squares, matrix analysis and the matrix manipulation capabilities of Microsoft Excel. For example, the equations for the regression constants for a three-parameter multiplicative model, in matrix form are:

The constants are determined as:
RESULTS AND DISCUSSION NOM
in raw water
Figure 3 summarises the DOC, UV254 absorbance and SUVA values of the 4 raw waters collected 7 times from 2010 to 2013, including the 2 last rounds of sampling mentioned earlier in this paper (Haarhoff et al., 2013). It shows that their DOC values are generally greater than 5 mg∙ℓ-1. Therefore, these waters are likely candidates for NOM removal in the future. Other studies also found that the DOC of many South African surface waters is greater than 5 mg-l-1 (Nkambule et al., 2012; Haarhoff et al., 2013). Many South African surface waters might therefore require treatment for NOM removal should the DOC limit be reduced in future SANS 241. The range of UV254 absorbance values is between 10 and 35 m-1. Their SUVA values are generally in the medium range, between 2 and 4 ℓ ∙m-1-mg-1.

Predicted efficiency of enhanced coagulation
The USEPA Stage 1 Disinfection By-Products Rule (USEPA, 1999) stipulates the required TOC removal percentage when using EC. For the purpose of this paper, it provides an estimate of the TOC removal by EC based on the initial values of TOC and alkalinity of the raw water (See Table 1). Since it has been shown that 94% to 100% of TOC is in the form of DOC (Zhu, 1995; Guo et al., 2003; Edzwald and Tobiason, 2011), the DOC value can be used in Fig. 4 in place of TOC. Figure 4 suggests that EC should achieve 40% DOC removal for one Rietvlei water sample, 30% removal for 2 water sources namely Olifantsvlei and Vereeniging, 30% removal for the other Rietvlei raw water sample and 25% DOC removal for the Olifantsvlei water source. Based on Fig. 4, the range of DOC removal is anticipated to be between 25% and 40%. This study used an arbitrary EC target of 60% removal of UV254 absorbance, a value higher than the anticipated DOC removal, to account for the fact that DOC removal is not exactly the same as UV 254 absorbance removal, and to cover a coagulant dosage range beyond the minimum required for EC.

Measured effects of enhanced coagulation
Enhanced coagulation tests were conducted on 4 raw water samples collected in winter (Round 6), and another 4 samples in summer or spring (Round 7). It was found that 60% of UV254 absorbance removal corresponded to about 60% of DOC removal for all the Olifantsvlei and Midvaal waters, while it corresponded to 55% and 50% of DOC removal for Rietvlei Rounds 6 and 7, respectively, and 40% and 25% for Vereeniging Rounds 6 and 7. The SUVA values did not vary much, with the exception of Vereeniging Round 7 where the initial SUVA of greater than 3 dropped to a final SUVA of less than 2, as shown in Fig. 5. Figure 5 shows the initial (before coagulation) and final (after enhanced coagulation) values of the UV254 absorbance, DOC and SUVA of the eight water samples. With the exception of the Vereeniging samples, all of the raw water SUVA values were about 2 ℓ∙m-1∙mg-1. The initial and final SUVA values were in the same range of values (i.e. either the initial and final SUVA values are all greater than 2 or all less than 2), except the Vereeniging samples. Edzwald and Kaminski (2009) developed a criterion for water plants that was to select coagulant dosage to achieve a treated water of UV254 absorbance between 3.0 and 3.5 m-1, corresponding to DOC 2 mg∙ℓ-1 or less. A similar approach can be adopted for the South African water treatment plants. Figure 5 shows that when the treated water UV254 absorbance is about 5 m-1, the resulting DOC is between 2 and 3 mg∙ℓ-1. Therefore the final UV254 absorbance value of 5 m-1 can be used as a preliminary goal by South African water treatment plants.
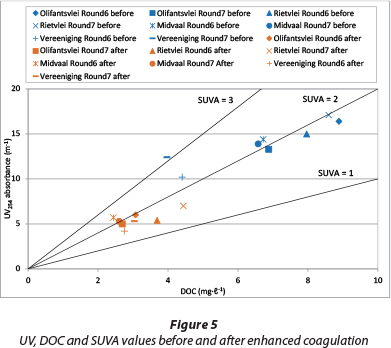
Figure 6 shows that the coagulant dosages required to remove 60% UV254 absorbance for all of the water samples are in the same range, except the Vereeniging samples which need less coagulant. To verify the applicability of this observation, two more arbitrary UV254 absorbance removal criteria of 40% and 50% were chosen. Their results, also presented in Fig. 6, show similar findings as those for the 60% UV254 absorbance removal criterion. Figure 6 also shows that the coagulant dosage required for removing 50% and 60% of UV254 absorbance is roughly 1.4 (standard deviation 0.04) times and 2.0 times (standard deviation 0.14) the dosage requirement for 40% UV254 absorbance removal, whereas the corresponding absorbance loadings on coagulant do not change much. Figure 6 confirms that higher values of SUVA (Vereeniging Rounds 6 and 7) correspond to a larger degree of adsorbability of NOM.

Modelling
Mathematical models were initially developed based on the following 5 analytical parameters: UV254 absorbance, DOC, SUVA, alkalinity and coagulant dosage measured as Fe. The models had the objective of correlating the removal of UV254 absorbance with Fe dosage. All of the models therefore included the coagulant dosage as a parameter. It should be noted that UV254 absorbance, DOC and SUVA parameters represent only two degrees of freedom because SUVA is a combination of the two first parameters. If any two are known the third is determined. SUVA was therefore removed as a modelling parameter. For practical application at water treatment plants, the measurement of DOC is normally not available as an operational parameter, therefore also eliminating DOC modelling parameters. For each of the 8 water samples, 5 jars were dosed with ferric chloride, yielding a total of 40 data points for correlation purposes. A comparison between the additive and multiplicative models showed that the multiplicative models yielded higher coefficients of correlation. For example, a one-parameter additive model is presented in Eq. (3), while Eq. (4) represents a one-parameter multiplicative model. These equations illustrate the higher coefficient of correlation of the multiplicative model for predicting UV absorbance from the coagulant dosage.

The calculated values from Eq. (4) versus the experimental values are shown in Fig. 7.

To improve the correlation, models with more parameters were considered next. The two best two-parameter models are provided as Eq. (5) and (6), and the best three-parameter model as Eq. (7):
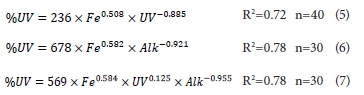
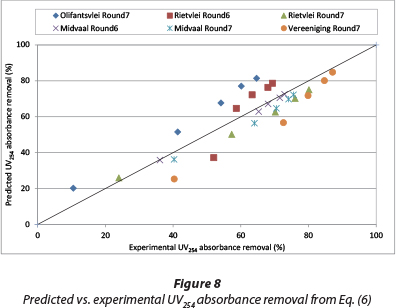
The magnitude of the exponent of the UV254 absorbance in Eq. (7) is very small (0.125) compared to the magnitudes of the exponents of the two other parameters (0.584 and 0.955). Because of that, the overall contribution of initial UV absorbance to its removal is minimal, explaining why there is no change in the value of the coefficient of correlation (R2) from Eq. (6) to (7). Comparison of coefficients of correlation for Eqs. (4), (5), (6) and (7) suggest a choice of either Eq. (6) or (7). Since Eq. (6) and (7) have the same value for the coefficient of correlation, Eq. (6) is chosen as it has the smallest number of parameters. The calculated values versus the experimental results of the chosen Eq. (6) are presented in Fig. 8.
The potential use of the models is illustrated with an example. Assume a raw water DOC of 8 mg∙ℓ-1 and a treatment goal of say 4 mg∙ℓ-1. The raw water is compromised by high return flows and is therefore likely to have a low SUVA of around 2.0 ℓ∙mg-1-m-1. The alkalinity of the raw water is 100 mg∙ℓ-1, expressed as CaCO3. Use the preliminary results from this paper to make a first-order appraisal of the likely Fe dosage required for EC: The required DOC removal is (4/8) X 100 = 50%, so assume a similar reduction percentage for UV254. Use Eq. (6) to calculate the Fe dosage of 16.6 mg∙ℓ-1. This is equivalent to an UV254 loading on the Fe of 0.48 ℓ-mg-1-m-1. A dosage of 16.6 Fe mg∙ℓ-1 will consume 44.6 mg∙ℓ-1 alkalinity (expressed as CaCO3), which can be neutralised with 33.0 mg∙ℓ-1 of lime (expressed as Ca(OH)2). This dosage will precipitate a floc mass of 31.7 mg∙ℓ-1 in the form of Fe(OH)3. With these estimates, a first-order appraisal of the feasibiliy of EC can be made.
SUMMARY AND CONCLUSIONS
Many, if not most, inland surface water sources in South Africa are compromised by high return flows, leading to increased alkalinity, high levels of organic NOM and relatively low SUVA values. The imminent introduction of future planned wastewater reuse schemes will probably drive the allowable DOC limits down to significantly lower levels than presently applied. It is therefore easy to predict that many water treatment plant managers will have to rethink their strategy for removing NOM during treatment, an issue previously not considered as very important. There are different ways to quantify NOM, and DOC is not the easiest way. DOC analysers are expensive and difficult to maintain and operate, placing them beyond the reach of almost all small treatment plants. This paper demonstrates that UV absorbance provides a more accessible, reliable and rapid way of monitoring NOM at treatment plant level. In 1985, Edzwald et al. produced similar results. Enhanced coagulation has been proven elsewhere in the world to be the most affordable technology for removing a major part of the NOM. Its successful implementation requires the use of an appropriate coagulant such as ferric chloride or aluminium sulphate - organic polymers are not suitable. Furthermore, these coagulants may be more expensive and will require more neutralising agent due to their acidic nature, but are cheaper than obtaining the same NOM removal by other advanced treatment processes.
This paper provides a detailed procedure for determining the dosage for EC in terms of UV254 absorbance at jar test level. Based on the results obtained on 4 South African inland waters, a correlation was established to estimate the ferric chloride dosage for any desired level of UV254 absorbance removal. This correlation enables a preliminary assessment of EC as a means of planned NOM removal. Should EC promise to be a candidate process for NOM removal, it should be verified at jar test level using the proposed procedure.
ACKNOWLEDGMENTS
The authors wish to acknowledge the financial support of the South African Water Research Commission and the University of Johannesburg.
REFERENCES
BELL-AJY K, ABBASZADEGAN M, IBRAHIM E, VERGES D and LECHEVALIER M (2000) Conventional and optimized coagulation for NOM removal. J. Am. Water Works Assoc. 92 (10) 44-58. [ Links ]
BOLTO B and GREGORY J (2007) Organic polyelectrolytes in water treatment. Water Res. 41 (11) 2301-2324. [ Links ]
CROZES G, WHITE P and MARSHALL M (1995) Enhanced coagulation: Its effect on NOM removal and chemical costs. J. Am. Water Works Assoc. 87 (1) 78-89. [ Links ]
EDWARDS M (1997) Predicting DOC removal during enhanced coagulation. J. Am. Water Works Assoc. 89 (5) 78-89. [ Links ]
EDZWALD JK (2013) Coagulant mixing revisited: theory and practice. J. Water Supply: Res. Technol. AQUA 62 (2) 67-77. [ Links ]
EDZWALD JK and KAMINSKI GS (2009) A practical method for water plants to select coagulant dosing. J. New Engl. Water Works Assoc. 123 (1) 15-31. [ Links ]
EDZWALD JK and TOBIASON JE (1999) Enhanced coagulation: USA requirements and broader view. Water Sci. Technol. 40 (9) 63-70. [ Links ]
EDZWALD JK and TOBIASON JE (2011) Chemical principles, source water composition, and watershed protection (Chapter 3). In: Edzwald JK (ed.) Water Quality & Treatment: A Handbook on Drinking Water (6th edn). AWWA and McGraw-Hill, New York. [ Links ]
EDZWALD JK, BECKER WC and WATTIER (1985) Surrogate parameters for monitoring organic matter and THM precursors. J. Am. Water Works Assoc. 77 (4) 122-132. [ Links ]
EIKEBROKK B, JUHNA T and 0STERHUS SW (2006) Water treatment by enhanced coagulation - Operational status and optimization issues. Techneau Report D 5.3.1 A. Techneau, Nieuwegein, The Netherlands. [ Links ]
FREESE SD, NOZAIC DJ, PRYOR MJ and RAJOGOPAUL R (2007) Enhanced coagulation: A viable option to advance treatment technologies in the South African context. Water Sci. Technol.: Water Supply 1 (1) 33-41. [ Links ]
GARCÍA I (2011) Removal of Natural Organic Matter to Reduce the Presence of Trihalomethanes in Drinking Water. School of Chemical Science and Engineering, Royal Institute of Technology, Sweden. ISBN: 978-91-7415-856-4. [ Links ]
GUO L, LEHNER JK, WHITE DM and GARLAND DS (2003) Heterogeneity of natural organic matter from the Chena River Alaska. Water Res. 37 (5) 1015-1022. [ Links ]
HARRINGTON GW, CHOWDHURY ZK and OWEN DM (1992) Developing a computer model to simulate DBP formation during water treatment. J. Am. Water Works Assoc. 84 (11) 78-87. [ Links ]
HAARHOFF J, MAMBA B, KRAUSE R, VAN STADEN S, NKAMBULE T, DLAMINI S and LOBANGA KP (2013) Natural organic matter in drinking water sources: Its characterisation and treatability. WRC Report No. 1883/1/12. Water Research Commission, Pretoria. ISBN: 9781431203543. [ Links ]
KASTL G, SATHASIVAN A, FISHER I and LEEUWEN JV (2004) Modeling DOC removal by enhanced coagulation. J. Am. Water Works Assoc. 96 (2) 79-89. [ Links ]
KASTL G, SATHASIVAN A and FISHER I (2008) Modelling DOC removal by enhanced coagulation. Research report No. 57 CRC for water quality and treatment, Salisbury, Australia, ISBN 18766 16830. [ Links ]
MOOMAW C, AMY G, KRASNER S and NAJM I (1992) Predictive models for coagulation efficiency in DBP precursor removal. In: Proc. AWWA Annual Conference Water Quality, June 18-20 June 1992, Vancouver, B.C. [ Links ]
NOZAIC DJ, FREESE SD and THOMPSON P (2001) Longterm experience in the use of polymeric coagulants at Umgeni Water. Water Sci. Technol.: Water Supply 1 (1) 45-50. [ Links ]
NKAMBULE TI, KRAUSE RWM, HAARHOFF J and MAMBA BB (2012) Natural organic matter (NOM) in South African Waters: NOM characterisation using combined assessment techniques. Water SA 38 (5) 697-706. [ Links ]
TSENG T and EDWARDS M (1999) Predicting full-scale TOC removal. J. Am. Water Works Assoc. 91 (4) 159-170. [ Links ] USEPA (1999) Enhanced coagulation and enhanced precipitative softening guidance manual. EPA 815-R-99-012. United States Environmental Protection Agency, Washington. [ Links ]
USEPA (2001) Controlling disinfection by-products and microbial contaminants in drinking water. EPA-600-R-01-110. United States Environmental Protection Agency, Washington. [ Links ]
UYAK V and TOROZ I (2007) Disinfection by-product precursors reduction by various coagulation techniques in Istanbul water supplies. J. Hazardous Mater. 141 (1) 320-328. [ Links ]
WANG D, XIE J, CHOW CWK, XING L and LEEUWEN JV (2011) Characterization and predicting DOM treatability by enhanced coagulation. In: Proceedings of the 4th IWA Specialty conference -Natural Organic Matter: From Source to Tap and Beyond, 27-29 July 2011, Costa Mesa, USA. [ Links ]
XIAO F, SIMCIK MF and GULLIVER JS (2013) Mechanisms for removal of perfluorooctane sulfonate (PFOS) and perfluorooctanoate (PFOA) from drinking water by conventional and enhanced coagulation. Water Res. 47 (1) 49-56. [ Links ]
ZHU HW (1995) Modeling the effects of coagulation on chlorination by-product formation. Department of Civil, Environmental and Architectural Engineering, University of Colorado. UMIN No: 9620676. [ Links ]
Received 5 June 2013
Accepted in revised form 30 June 2014.
* To whom all correspondence should be addressed.+27 14 592 2834; e-mail: lobanga1@hotmail.com

