


Services on Demand
Article
 English (pdf)
 Article in xml format
 Article references
Indicators

Related links
-
 Cited by Google
 -
 Similars in Google
Share

 Permalink
Water SA
On-line version ISSN 1816-7950
Print version ISSN 0378-4738
Water SA vol.40 n.3 Pretoria Jun. 2014
http://dx.doi.org/10.4314/wsa.v40i3.15
Improving navigability on the Kromme River estuary: a choice experiment application
DE Lee*; SG Hosking; M Du Preez
Department of Economics, PO Box 77000, Nelson Mandela Metropolitan University, Port Elizabeth, 6031, South Africa
ABSTRACT
Navigation of estuaries is a vitally important aspect of boating recreation in South Africa and elsewhere. This paper uses a choice experiment to estimate recreation values of the Kromme River Estuary, a popular estuary along South Africa's east coast. This valuation methodology allows for the identification of preferred management strategies through the tradeoffs made by estuarine recreational users. It is found that the level of navigability is the most important predictor of user choice, and argued that more attention needs to be paid to options for improving navigability and methods to fund these interventions. It is concluded that an increase in licence fee of ZAR402 would improve recreational value.
Keywords: estuary, recreational attributes, navigability, choice experiment, willingness-to-pay, conditional logit model, random parameters logit model
INTRODUCTION
The natural beauty, easy access, and range of environmental services provided by estuaries have attracted recreational, commercial and industrial activities (Day, 1980; Forbes, 1998). South Africa's coastline, which stretches for about 3 000 km, from north of Richards Bay on the East Coast to Alexander Bay on the West Coast, has many small estuaries. Not unlike estuaries worldwide, many in South Africa have become a focal point of human settlement, resource use and waste disposal (Hay et al., 2008; Hosking, 2008). There is mounting pressure on estuaries as recreational outlets, which, in turn, has led to their functional deterioration as well as deterioration in the quality of the recreational experience as a whole. A South African estuary system currently facing excess recreational demand pressure is the Kromme River. The Kromme River Estuary is freshwater starved (Baird, 2002). It faces a trade-off between the demand for abstraction of river inflows into the estuary, and the human demand to maintain an ecologically functional estuary habitat, as well as recreational service flows (Hosking, 2011). The expansion of a canal system, as well as the construction of two major dams on the Kromme River, have restricted the water flow into the estuary and resulted in increased sedimentation. The abstraction of this river water has led to the degradation of the estuarine environment in the form of habitat losses, and a decrease in recreational service yield in the form of reduced navigability (Forbes, 1998).
Two options to reduce sedimentation in the Kromme River Estuary and improve navigability are increased instream inflow and dredging. A study by Sale (2007) has shown that the water for upstream use (agriculture and domestic) is far more valuable than the water flowing into the estuary. For this reason, alternative options to instream inflow should be considered for the purpose of improving navigability, such as dredging. Two big questions regarding the dredging option are (i) how could this cost be funded, and (ii) does the navigability benefit exceed the dredging cost. With respect to the first question, we suggest that a potential source of funding for this dredging activity could take the form of an additional tariff imposed on recreational boat users of the estuary. With respect to the second question, we suggest the answer can be revealed through the tariff trade-off boat users of the estuary would be willing to make for improved navigability. This trade-off may be calculated through the application of a suitably designed choice experiment (CE). The primary objective of this study is to apply a CE to estimate the tariff trade-off to improve navigability on the Kromme River Estuary.
The Kromme River Estuary and its recreational demand issues
The Kromme River Estuary (34°08'S, 24°5'E) is located in the Eastern Cape approximately 80 km west of Port Elizabeth and is classified as permanently open (Fig. 1) (Scharler and Baird, 2003; Sale, 2007). The Kromme River runs for approximately 95 km, with the last 14 km of the river regarded as estuarine (Heymans, 1992). Dams have been constructed on the upper reaches of the river leading to a reduction in freshwater inflows into the estuary.
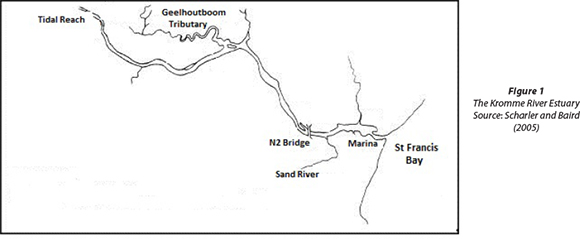
Navigation is hazardous on the Kromme River Estuary (Thorpe, 2010). The level of navigability of the Kromme River Estuary is inextricably linked to the extent of in-situ sedimentation taking place. Increased levels of sedimentation lead to the constriction of the river channel, both in terms of width and depth, and the creation of new underwater sandbanks (shoaling). The constriction of the river channel makes navigation difficult, sometimes impossible, especially at low tide. The Kromme River Estuary is a 'natural sediment trap'. Sediment enters from the tidal head and inlet. In an unmodified system , the net long-term rate of sediment build-up is relatively slow because periodic freshwater floods scour the channels and remove accumulated sediment out to sea (Reddering and Esterhuysen, 1983). This sediment balance in the Kromme River, however, has been disrupted through artificial modifications to the estuarine system, such as the construction of the Churchill Dam in 1943, and the later completion of the Mpofu Dam (previously named the CW Malan Dam) in 1982. Upstream water abstraction (damming) and resultant sedimentation build-up has almost totally starved the system of freshwater input (Baird et al., 1992).
Another source of sediment for the Kromme River Estuary is the Sand River. It begins approximately 2 km upstream from the mouth and deposits a small amount of sand into the estuary on the southern bank. This deposit is spread upstream and downstream in the estuary by the tidal currents.
Two options exist to address the issue of navigability, namely, increased instream flow and dredging. It is generally accepted that maintaining a certain level of instream flow is essential to protect and enhance recreation, water quality, and biodiversity (Berrens et al., 1996). As mentioned earlier, this is not considered a viable option due to the high value attached to water for upstream use. An alternative way of improving navigability of the Kromme River Estuary is to dredge the channel bottom, which entails the use of a machine equipped with a suction device which removes sand and silt from the channel bottom, deepening the waterway. Assuming an area of 10 000 m2 requires dredging, and a cost of hiring a dredging outfit of ZAR30 per m2 (St. Francis Bay Ratepayers Association (SFBRA), 2011), the annual cost (excluding habitat damage) of dredging the main estuary channel would be ZAR300 000, much less than the opportunity cost of instream inflow (but then it also has a narrower benefit). The total cost of dredging including habitat damage would be much higher.
A literature review of South African estuarine studies
Several contingent valuation method (CVM) studies have been conducted recently to determine the value of freshwater inflows (or marginal annual runoff (MAR)) into a variety of estuaries along the South African coast (see for example Dimopolous, 2005; Lin, 2005; Sale, 2007; Chege, 2009). The study conducted by Sale (2007) focussed attention on the Kromme River Estuary. The willingness-to-pay (WTP) question in this study was phrased as follows: 'What levy per year are you willing to pay (including what you already do pay) for a project to increase river water inflow (due to urban and agricultural abstraction or reduced flows through forestry or vegetation changes) into the estuary of 812% over what currently flows into estuary. Another way of seeing this is WTP to increase the proportion of MAR inflow into the estuary from 10% to 80%' (Sale, 2007 p. 136). The payment vehicle was a recreational use levy - it was argued that this payment vehicle was credible since many respondents already paid similar such levies. The elicitation format was a payment card - this type of format was selected to avoid starting point bias. The results of the study showed that the median household WTP per annum for the suggested increase in freshwater inflows was ZAR287 (2010 price levels).
To the authors' knowledge, only one attribute valuation study (CE study) has been reported. The Water Research Commission (WRC) commissioned a study in 2008 (Project K5/1413/2) to generate information on guiding the allocation of river water to South African estuaries and to investigate the factors that explain WTP for river inflows into South African estuaries (Oliver, 2010). This study applied a CE to the Bushmans Estuary, in the Eastern Cape Province, and compared the results with those of an application of a CVM done by Van Der Westhuizen (2007). Welfare measures derived from the CE study were about 30% less than the welfare measures derived from the CVM study (Oliver, 2010). Reasons cited for this difference included different samples of users, as well as the possibility of embedding bias in the derived CVM estimates.
CVM and CE studies provide different advantages to the researcher; CVM appears to be best suited to valuing a single environmental feature, management policy or environmental service flow, whereas the CE is ideal for valuing the separate elements of a service flow, feature or management plan. Moreover, CE forces the recreational user to make trade-offs among estuarine attributes, and reveal which of these are most important. This information is vital in the context of resource management decision making, where scarce resources need to be allocated between competing recreational demands. In addition, the WTP question is 'hidden' in the choice set in a CE study and does not enjoy the prominence it does in CVM, which could reduce protest behaviour.
The choice experiment methodology
A frequently used tool for modeling the behaviour of individual choice is the discrete choice model based on the hypothesis of random utility (Bateman et al., 2002; Hensher et al., 2005). The random utility model (RUM) allows the researcher to analyse choices among many alternatives. The individual's decision to select one alternative, as opposed to other substitute alternatives , is treated by the RUM as a stochastic, utility-maximising choice (Louviere et al., 2000; Haab and McConnell, 2002). The total utility derived from selecting alternative i may be described by the utility function,
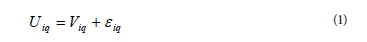
where:
Uiq represents utility derived for consumer q from option i Viq is an attribute vector representing the observable component of utility from option i for consumer q εiq is the unobservable component of latent utility derived for consumer q from option i (McFadden, 1974; McFadden and Train, 2000).
Assuming a linear additive form for the multidimensional deterministic attribute vector (Viq):
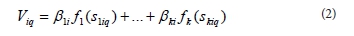
where:
βki are utility parameters for option i
siq represents (1-k) different attributes with differing levels
fk represents the density distribution functions associated
with each attribute s. Equation (1) may be expanded to:

This RUM is converted into a choice model by recognising that an individual (q) will select alternative i if and only if (iff) Uiq is greater than the utility derived from any other alternative in the choice set A. Alternative i is preferred to j iff P[(Viq+εiq )>(Vjq+εjq)], and choice can be predicted by estimating the probability of individual (q) ranking alternative i higher than any other alternative j in the set of choices available (McFadden, 1974; Louviere et al., 2000; McFadden and Train, 2000).
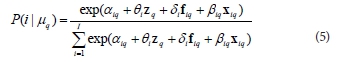
This model may be estimated using a conditional logit (CL) model (McFadden, 1974; Louviere et al., 2000; Haab and McConnell, 2002). The CL model assumes that εiq is independent and has a Type I extreme value distribution. The probability , Pr(iq), that individual q chooses alternative i out of I alternatives is given by:
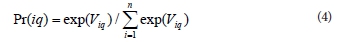
where:
exp(∙) = the antilog function
One of the assumptions of the CL model is independence of irrelevant alternatives (IIA) (Haab and McConnell, 2002; Hensher et al., 2005). The IIA assumption requires that the relative probabilities of choosing between any two alternatives be unaffected by the introduction or removal of other options (Haab and McConnell, 2002). If the IIA assumption is violated, the observed and unobserved components of utility can be dependent on one another and the error term exhibit serial correlation, leading to biased estimates (McFadden and Train, 2000; Train, 2003). The CL model also assumes that the coefficients of variables that enter the model are the same for all consumers, i.e., that there is homogeneity in preferences across respondents (Ben-Akiva and Lerman, 1985; Louviere et al., 2000; MacDonald et al., 2005). This homogeneity implies that consumers that exhibit the same socioeconomic characteristics, for example, level of income, will value the good in question in an equal manner. Preferences are, however, often heterogeneous in nature. If there is a violation of these assumptions, a random parameters logit (RPL) model may be preferred (McFadden and Train, 2000; Train, 2003; Hensher et al., 2005). A generalised version of the RPL choice model is (McFadden and Train, 2000; Louviere et al., 2000):
where:
αiq is a fixed or random alternative specific constant (ASC
with i = 1, 2...., I alternatives and q = 1,....,Q individuals; and α1 = 0δ. is a vector of non-random parameters
βiq is a vector of random parameters
θq is a vector of individual-specific parameters
ιιq is the individual-specific random disturbance of unobserved heterogeneity and is incorporated in the randomly distributed βiq parameter vector
zq is a vector of individual-specific characteristics, for exampleple , income
f iqis a vector of individual-specific and alternative-specific non-randomised attributes
xiq is a vector of individual-specific and alternative-specific randomised attributes
The RPL can take on a number of different functional forms and incorporate a number of assumptions. The most popular assumptions are normal, triangular, uniform and log-normal distributions (Bhat, 2000; Bhat, 2001). It can be difficult to determine which variables to distribute and which distributions to choose. Some applications only randomise the cost variable (Layton, 2000), whereas others randomise all non-price variables and leave cost as non-random (Anderson, 2003). The latter choice is favoured for two reasons. Firstly, the distribution of the marginal WTP for an attribute is simply the distribution of that attribute's parameter estimate, and, secondly, it allows the cost variable to be restricted to be non-positive for all individuals (Carlsson et al., 2003).
Choice experiment design
The first step in the development of a discrete CE is the identification of the attributes of interest and the specification of levels for each attribute chosen (Ryan et al., 2001; Hensher et al., 2005; Yacob and Shuib, 2009). In order to identify the attributes of interest, informal interviews were conducted with members of the SFBRA, the Kromme River Trust, and the Kromme River Joint River Forum. They were asked to list their concerns with regards to the recreational use of the estuary, and rank them in order of importance. This information, together with that provided by estuarine experts, led to the development of a pilot questionnaire.
In order to refine the wording and layout of the questionnaire, a pilot study was then conducted in St Francis Bay through the use of a focus group. There were problems experienced by the members of the focus group. They included (i) not understanding the area covered by the term 'estuary', and (ii) not including a specific question relating to the matter of bait collection. The first problem was rectified by defining the Kromme River Estuary as the 'tidal portion'. The second problem was dealt with by adding a question relating to users' perceptions of the severity of illegal bait collection in the area.
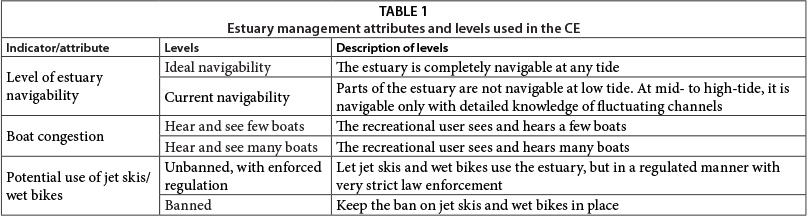
The four attributes defined included three qualitative attributes relating to the effects of different management options in relation to the quality of estuarine services and the estuarine environment, and one quantitative attribute which specified the cost/price of the option. Importantly, one of the attributes identified as critical was the navigability of the estuary (Table 1).
Focus group discussions led the researchers to classify each of the 3 non-monetary attributes into 2 different levels. These qualitative attributes were set in order to assess the change in the level of welfare associated with the choice of one option over the other. The cost variable was expressed by four different Rand values, anchored by the existing boat licence fee of ZAR169 per annum (2010/11). It is important to note that the focus groups were purposefully selected to be representative of the average boat user of the Kromme River Estuary. These groups indicated that these Rand values were appropriate (i.e. the correct amounts within the context of this study). A 'status quo' or 'no change' option was not included in this study because a status quo level could only be defined for three of the four attributes, namely, for the navigability, jet skiing and cost attributes. A good approximation of the status quo level for boat congestion was impossible to define since the level of motor boat usage on the estuary is in a constant state of flux. This CE design could not provide information regarding possible protest bids. The inclusion of a status quo option, however, is not always favourable as it can lead to 'status quo' bias and the need to increase sample size (Bateman et al., 2002).
The written description of the monetary attribute, or cost variable, was:
'It is assumed that the cost of providing these recreational use alternatives is partly covered by the Kromme River Estuary's boat licence holders. We ask you to imagine that all boat licence holders will contribute equally by means of a fixed annual sum added to the existing boat licence structure, and this annual sum will then be directed back to the Kromme River Estuary. This annual sum can take four different values, namely ZAR169 (boat licence payment for 2010/11 year), ZAR254, ZAR338 and ZAR676.'
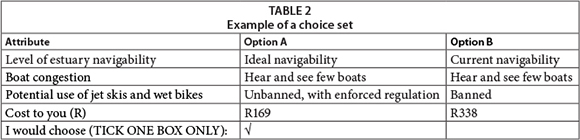
A full factorial design (2x2x2x4 = 32) was generated using SPSS, yielding 32 different treatment combinations or alternatives. These alternatives were randomly allocated to 32 different questionnaires containing four choice sets each. For each choice set, the respondent had to choose between two alternatives or scenarios, each including a cost price (licence fee). An example of a choice set is provided in Table 2.
The development of the questionnaire followed the design steps proposed by Hasler et al. (2005). These steps include (i) the collecting of introductory information from the respondent through the use of an introductory section, (ii) the setting out of the CE with relevant descriptions of the attributes and levels, (iii) the provision of follow-up questions, which allow for reliability and validity checks, and (iv) the collection of socio-demographic information from the respondent.
Sample design
The target population included all individuals who, at the time of the survey, made use of the Kromme River Estuary for motorised boating purposes, as well as those individuals who had high potential to make use of the estuary for motorised boating purposes in the future. Initially, the authors included in the sample a wide variety of recreational visitors to the area - this sample consisted of 244 respondents. Given the emphasis on navigability and the use of the boat licence fee as a payment vehicle (based on the beneficiary pays principle), the sample was subsequently confined to those who either own or operate a motorised boat on the Kromme River Estuary. This ensured that the payment vehicle in the CE was incentive compatible. Although 1 100 registered motor boat owners make use of the estuary, a sample frame could not be compiled, as the population does not reveal itself until it visits the estuary. Motor boat owners obtain licences per boat and not per estuary; therefore a motor boat owner who has bought a licence may launch his/ her craft at any of several estuaries along the Eastern Cape coast, making the compilation of a list problematic. Given this inability to adequately define a sample frame, the sample selection process was followed using underlying knowledge of the specific target population. This form of non-list sampling can be used when the target population refers to visitors to a beach, or, in this case, an estuary (Bateman et al., 2002; Dillman et al., 2009). Time of survey is very important when attempting to sample the recreational users of an estuary, as they ideally need to be sampled when they are actually engaged in carrying out the recreational activities. This requires on-site sampling, and is known as an intercept survey (Bateman et al., 2002). An intercept survey selection strategy was adopted where every nlh motor boat user to the estuary was approached for participation - this amounted to 163 users or a sample size of approximately 15%.
The personal interview method was adopted as it affords the interviewer the best opportunity to encourage the respondents to cooperate with the survey. The interviewer is also given an opportunity to explain complex information and valuation scenarios to the respondent - which is very important in the CE setting (Mitchell and Carson, 1989). The questionnaire was administered on-site by 7 trained interviewers during December, 2010.
RESULTS
Sample features
The only socio-economic information available for the Kromme River Estuary was that gathered by Forbes (1998) and, more recently, by Sale (2007). Both the Forbes (1998) and Sale (2007) studies captured data on the recreational users of the Kromme River Estuary. Comparison with the Forbes (1998) data was possible for residential location, whilst the Sale (2007) study provided information about the average recreational user's education and income per annum. The results are summarised as follows:
- In this study, 59% of visitors travelled from areas more than 50 km away from the estuary, whereas in the Forbes (1998) study, 75.5% travelled from areas more than 50 km away.
- The majority (64%) of recreational users surveyed were over the age of 35. This is compared to a median population age of 25 in 2011 (Statistics South Africa (STATSSA), 2011).
- The majority (65%) of recreational users surveyed were male. This is in line with gender statistics that reveal 66% of the population in 2011 is male.
- The average gross annual income for the sample was ZAR447 000. The Sale (2007) study found an average gross income of about ZAR257 000 per year, which is similar to the middle-income earners' (the median respondent) gross income of ZAR222 000 in this study. These average statistics reveal an upwardly skewed income distribution. National statistics give average annual household income at ZAR103 200 for 2011 - considerably lower than the average and median user of the Kromme River Estuary (STATSSA, 2011).
- Of the respondents sampled, 29% had a matric qualification with university exemption. This is in line with national statistics reporting 29% of the population with a matric qualification in 2011 (STATSSA, 2011). In the Sale (2007) study, the average number of years of education was 13 years, whereas this study indicated an average number of years of education of 13.8 years.
- All occupational categories are well represented in the sample of respondents, with the exception of plant and machinery operators/assemblers (0%), agricultural workers (0.4%), and elementary occupations (0%).
Choice model specification
Two different choice model specifications were estimated as part of the Kromme River Estuary CE: a CL model and an RPL model. The LIMDEP NLOGIT Version 4.0 statistical programme was used to make all the estimations. The two models estimated showed the importance of choice set attributes in explaining respondents' choices across the two different options: option A and option B. ASCs were not included in the models for two reasons: the alternatives were unlabelled and a status quo alternative was not included in the choice sets. For the two option choice sets, with four attributes, the utility functions were expressed as follows:
Option A: VA = β Navigability + β2Congestion + β3Jetskiing + β4Cost
Option B: VB =β 1Navigability + β2Congestion + β3Jetskiing + β4Cost
The model provides an estimate of the effect of a change in any of these attributes on the probability that one of these options will be chosen. All model estimates are provided in Table 3.
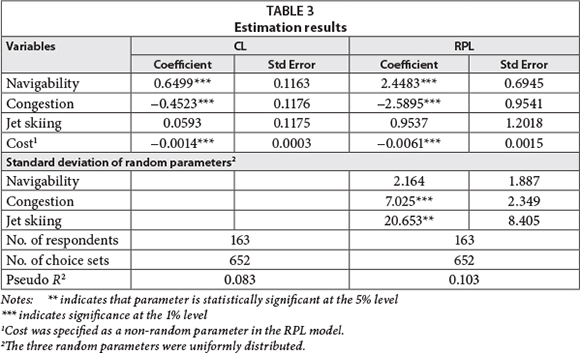
All the coefficients in the CL model have the correct signs, a priori, and three of the four coefficients are significantly different from zero at the 99% confidence level. A variable coefficient estimated by a discrete choice model reveals the relationship between the decision makers' choice and the variable of interest. A positive (negative) coefficient shows that decision makers prefer a quantitative increase (decrease) or a qualitative improvement (deterioration) of the attribute.The probability that an alternative would be chosen was reduced: the lower the level of navigability; the higher the amount of boat congestion; the higher the amount of jet skiing activity; and the higher the environmental quality levy. The navigability coefficient of the CL model can be interpreted by estimating its odds ratio, i.e., by calculating the antilog of the coefficient. Finding the antilog entails calculating the value of 10 to the power of the coefficient's value. An increase in the level of navigability will result in a 4.5% increase in the probability of a respondent choosing this option.
In order to address potential source of biases, i.e., non-identical distributed random components, constant variances, and heterogeneity of preferences amongst respondents, an RPL model was also estimated (see Table 3). In the RPL model, all three of the recreational attributes were treated as random variables. Randomising the cost coefficient can lead to large standard deviations around the marginal WTP values. Some applications thus randomise all non-price variables and leave cost as non-random (Anderson, 2003). This specification is favoured for two reasons: firstly, the distribution of the marginal WTP for an attribute is simply the distribution of that attribute's parameter estimate, and secondly, it allows the cost variable to be restricted to be non-positive for all individuals (Carlsson et al., 2003). The cost variable was specified as fixed, and non-randomly distributed. In other words, preferences relating to cost were assumed to be homogenous, whereas the three recreational variables, assumed to be random, represented heterogeneous preferences. When dummy variables are used, a uniform distribution with a (0,1) bound is considered most appropriate (Carlsson et al., 2003). A uniform distribution was therefore selected for the random parameters specified.
All coefficients have the correct signs a priori. The 'Cost', 'Navigability' and 'Congestion' coefficients are significantly different from zero at the 99% confidence level. As in the case of the CL model, the jet-skiing coefficient remains insignificant. There is unexplained heterogeneity in respondent preferences as evidenced by a significant derived standard deviation for the 'Congestion' coefficient. The standard deviation coefficient for navigability is statistically insignificant indicating statistically similar preferences for this attribute across respondents. In other words, the statistically significant random variables specified in the RPL model indicate that respondents have similar views on the need to increase estuary navigability, but are divided on the issue of boat congestion. In the context of navigability, respondents with similar socio-demographic characteristics, such as income, view improved navigability in a similar manner.
The pseudo R2 statistic reported in Table 3 is not directly comparable to the one estimated for a linear regression model (the ones reported in Table 3 may appear very low). Domencich and McFadden (1975) showed that a direct empirical relationship does exist between the two. According to this relationship , a pseudo R2 of 10% represents an R2 of about 30% for the equivalent R2 of a linear regression model (Hensher et al., 2005). The overall explanatory power of the choice models in this study can thus be considered satisfactory - according to Mitchell and Carson (1989), an R2 of 15% or more is acceptable for stated preference methods.
Estimation of WTP values
Implicit prices are calculated by determining the marginal rates of substitution between the attributes, using the coefficient for cost as the 'numeraire' (Hanemann, 1984). The ratios of the attribute in question to the cost coefficient can be interpreted as the marginal WTP for a change in each of the attribute values (Hanemann, 1984). More specifically, the marginal WTP value represents a change from one attribute level to another. In the case of the navigability of the Kromme River Estuary, the marginal WTP value represents a change from the current level of navigability to a pre-settlement level. The implicit price, or marginal WTP, was estimated by employing the Delta method. This method automates the process of estimating standard errors for non-linear functions, such as marginal rates of substitution (Suh, 2001), which can then be used to obtain confidence intervals (Bliemer and Rose, 2013). Many researchers employ the Wald procedure to estimate these standard errors (see for example Birol et al., 2006)). The application of the Delta method (using the RPL's results) in LIMDEP NLOGIT Version 4.0 (Greene, 2007) generated a WTP for the navigability attribute of ZAR402.11 (ZAR272.64; ZAR531.58).
An anonymous referee raises an interesting point that the WTP has almost doubled since 2007 (compare Sale's (2007) estimate of WTP with this paper's). One possible explanation is heightened awareness within the Kromme River Estuary recreational community of the sensitivity of the navigable area to these inflows. The period has been one where the issue of inflow constraint has received increased publicity.
DISCUSSION AND RECOMMENDATIONS
The level of navigability on the Kromme River Estuary is a negative function of the level of estuary sedimentation, inter alia. Two management options to improve navigability are: increasing freshwater inflows and dredging the main estuary channel. If the total MAR (105.5 million m3 per annum) was made available to the estuary it probably would be navigable at any tide. This amount of run-off could possibly restore navigability to pre-settlement levels.
However, this option is unattractive because the demand value for upstream abstraction is higher than it is for the freshwater that flows into the estuary. The water abstracted is used mainly for domestic and agricultural consumption. Two big storage dams located on the Kromme River are a physical testimony to this value. Improving navigability through dredging, on the other hand, may be a much lower cost option.
A marginal WTP value of freshwater inflows was derived from the demand response to improving the level of navigability from its current state to a pre-settlement one and may be calculated from the results of the CE reported above. The marginal WTP value was estimated to be ZAR402.11 per household per annum - approximately two and a half times the current licence fee (ZAR169). During the 2009/10 year, the number of motorised water craft registered for use on the Kromme River Estuary was 1 100 boats. This number does not include those that obtained temporary registration for water craft usage on the estuary during peak periods. The minimum navigability improvement value may be estimated by the product of the marginal WTP and the number of registered boat owners (the sample population identified for this study) for the Kromme River Estuary over the 2009/10 period: ZAR402.11 x 1 100 = ZAR442 321; more than the ZAR300 000 we estimated the required dredging cost would be. Notwithstanding the low cost of dredging, environmental damage costs, such as habitat lost, still need to be investigated. If these costs are high, then the total cost of dredging may become prohibitively expensive.
ACKNOWLEDGEMENTS
We gratefully acknowledge the Water Research Commission's financial support (WRC Project K5/1924), and would like to thank the members of the project reference group for valuable comments, insights and suggestions. We would also like to thank an anonymous reviewer from Economic Research South Africa (ERSA) for valuable feedback, which resulted in a financial contribution from the publication of an ERSA working paper. In addition, we gratefully acknowledge valuable comments and suggestions made by two anonymous Water SA reviewers that led to the publication of this paper.
REFERENCES
ANDERSON CM (2003) Policy implication of alternative economic approaches to population heterogeneity in stated preference surveys. Paper presented at: The American Agricultural Economics Association Meetings, 30 July 2003, Montreal. [ Links ]
BAIRD D, MARAIS JF and BATE GC (1992) An environmental analysis for the Kromme River area to assist in the preparation of structure plan. Institute for Coastal Research Report No. C16. University of Port Elizabeth, Port Elizabeth. [ Links ]
BAIRD D (2002) Estuaries of South Africa. University of Port Elizabeth, Port Elizabeth. [ Links ]
BATEMAN IJ, CARSON RT, DAY B, HANEMANN M, HANLEY N, HETT T, JONES-LEE M, LOOMES G, MAURATO S,
OZDEMIRO GLU E, PEARCE DW, SUGDEN R and SWANSON J (2002) Economic Valuation with Stated Preference Techniques. A Manual. Edward Elgar Publishing, Cheltenham, UK.
BEN-AKIVA M and LERMAN S (1985) Discrete Choice Analysis: Theory and Application to Travel Demand. MIT Press, Cambridge, US. [ Links ]
BERRENS RP, GANDERTON P and SILVA CL (1996) Valuing the protection of minimum instream flows in New Mexico. J. Agric. Resour. Econ. 21 (2) 294-309. [ Links ]
BHAT CR (2000) Flexible model structures for discrete choice analysis. In: Hensher DA and Button KJ (eds.) Handbook of Transport Modelling, Vol. 1: Handbooks in Transport. Pergamon Press, Oxford, UK. 71-90. [ Links ]
BHAT CR (2001) Quasi-random maximum simulated likelihood estimation of the mixed multinomial logit model. Transport. Res. B 35 (7) 677-695. [ Links ]
BIROL E, KAROUSAKIS K and KOUNDOURI P (2006) Using a choice experiment to account for preference heterogeneity in wetland attributes: the case of Cheimaditida wetland in Greece. Ecol. Econ. 60 145-156. [ Links ]
BLIEMER MJC and ROSE JM (2013) Confidence Intervals of Willingness-to-Pay for Random Coefficient Logit Models. Working Paper ITLS-WP-13-01, Institute of Transport and Logistic Studies, The University of Sydney, Sydney, Australia. [ Links ]
CARLSSON F, FRYKBLOM P and LILJENSTOLPE C-J (2003) Valuing wetland attributes: an application of choice experiments. Ecol. Econ. 47 95-103. [ Links ]
CHEGE J (2009) Valuing Preferences for Freshwater Inflows into Five Eastern Cape and KwaZulu-Natal Estuaries. MA dissertation, Nelson Mandela Metropolitan University, Port Elizabeth, South Africa. [ Links ]
DAY JH (1980) What is an estuary? S. Afr. J. Sci. 76 198. [ Links ]
DILLMAN DA, SMYTH JD and CHRISTIAN L-M (2009) Internet, Mail and Mixed-Mode Surveys: The Tailored Design Method. Wiley and Sons, New Jersey, US. [ Links ]
DIMOPOLOUS G (2005) Applying the Contingent Valuation Method to Value Freshwater Inflows Into the Knysna, Great Brak and Little Brak Estuaries. MCom dissertation, Nelson Mandela Metropolitan University, Port Elizabeth, South Africa. [ Links ]
DOMENCICH T and McFADDEN D (1975) Urban Travel Demand: A Behavioural Analysis. Elsevier, New York. [ Links ]
FORBES VR (1998) Recreational and resource utilisation of Eastern Cape estuaries and development towards a management strategy. MSc dissertation, University of Port Elizabeth, Port Elizabeth, South Africa. [ Links ]
GREENE WH (2007) NLOGIT: Version 4.0, User manual. Econometric Software, Inc, New York, US. [ Links ]
HAAB TC and McCONNELL KE (2002) Valuing Environmental and Natural Resources: The Econometrics of Non-Market Valuation. Edward Elgar Publishing, Cheltenham, UK. [ Links ] HANEMANN WM (1984) Discrete/continuous models of consumer demand. Econometrica 52 541-561. [ Links ]
HASLER B, LUNDHEDE T, MARTINSEN L, NEVE S and SCHOU SJ (2005) Valuation of groundwater protection versus water treatment in Denmark by choice experiments and contingent valuation. URL: http://technical-reports.dmu.dk (Accessed February 2010). [ Links ]
HAY D, HOSKING SG and McKENZIE M (2008) Estuaries, Economics and Freshwater: An Introduction. WRC Report No. TT 463/10. Water Research Commission, Pretoria, South Africa. [ Links ]
HENSHER D, ROSE JM and GREENE WH (2005) Applied Choice Analysis: A Primer. Cambridge University Press, Cambridge, US. [ Links ]
HEYMANS J (1992) Energy flow model and network analysis of the Kromme Estuary, St. Francis Bay, South Africa. MSc dissertation, University of Port Elizabeth, Port Elizabeth, South Africa. [ Links ]
HOSKING SG (2008) An economic approach to allocating river waterto estuaries in South Africa. Coastal Manag. 36 35-46. [ Links ]
HOSKING SG (2011) The recreational value of river inflows into South African Estuaries. Water SA 37 711-718. [ Links ]
LAYTON D (2000) Random coefficient models for stated preference surveys. J. Environ. Econ. Manag. 40 21-36. [ Links ]
LIN CH (2005) Valuing Preferences for Freshwater Inflows into Selected Estuaries in South Africa. MCom dissertation, Nelson Mandela Metropolitan University, Port Elizabeth, South Africa. [ Links ]
LOUVIERRE JJ, HENSHER DA and SWAIT JD (2000) Stated Choice Methods: Analysis and Application. Cambridge University Press, Cambridge, US. [ Links ]
MACDONALD DH, BARNES M, BENNETT J, MORRISON M and YOUNG MD (2005) Using a choice modelling approach for customer services standards in urban water. J. Am. Water Resour. Assoc. 41 719-728. [ Links ]
McFADDEN D (1974) Conditional Logit Analysis of Qualitative Choice Behaviour. In: Zarembka P (ed.) Frontiers in Econometrics. Academic Press, New York. 105-142. [ Links ]
McFADDEN D and TRAIN KE (2000) Mixed MNL Models for Discrete Response. J. Appl. Econom. 15 (5) 447-470. [ Links ]
MITCHELL RC and CARSON RT (1989) Using Surveys to Value Public Goods: The Contingent Valuation Method. Resources for the Future, Washington DC. [ Links ]
OLIVER C (2010) Comparing a contingent valuation of the river inflows into the Bushmans estuary with a choice experiment valuation. MSc Dissertation, Nelson Mandela Metropolitan University, Port Elizabeth, South Africa. [ Links ]
REDDERING JSV and ESTERHUYSEN K (1983) Sedimentation in the Kromme River Estuary. ROSIE Report No. 6. University of Port Elizabeth, Port Elizabeth, South Africa. [ Links ]
REVELT D and TRAIN K (1998) Mixed logit with repeated choices: Households' choice of appliance efficiency level. Rev. Econ. Stat. 80 647-657. [ Links ]
RYAN M, BATE A, EASTMOND CJ and LUDBROOK A (2001) Use of discrete choice experiments to elicit preferences. Qual. Health Care 10 i55-i60. [ Links ]
SALE MC (2007) The value of freshwater inflows into the Kowie, Kromme and Nahoon estuaries. MCom dissertation, Nelson Mandela Metropolitan University, Port Elizabeth, South Africa. [ Links ]
SCHARLER UM and BAIRD D (2003) The influence of catchment management on salinity, nutrient stoichiometry and phytoplank-ton biomass of Eastern Cape estuaries, South Africa. Estuar. Coast. Shelf Sci. 56 735-748. [ Links ]
SCHARLER UM and BAIRD D (2005) A comparison of selected ecosystem attributes of three South African estuaries with different freshwater inflow regimes, using network analysis. J. Mar. Syst. 56 (3-4) 283-308. [ Links ]
STATISTICS SOUTH AFRICA (STATSSA) (2011) Census 2011. Statistical release (revised) No. PO301.4. Statistics South Africa, Pretoria. [ Links ]
ST. FRANCIS BAY RATEPAYERS ASSOCIATION (SFBRA) (2011). General Motorised Boating Regulations for the Kromme River. URL: http://www.sfbra.co.za (Accessed 1 June 2011). [ Links ]
SUH J (2001) An economic evaluation of environmental recovery of the skier-dominated area in the Mount Togyu National Park in South Korea. PhD thesis, University of Queensland, Brisbane, Australia. [ Links ]
THORPE H (2010) Personal communication. 10 July 2010. Mr Hilton Thorpe, Kromme River Trust, St. Francis Bay, South Africa. [ Links ]
TRAIN KE (2003) Discrete Choice Models With Simulation. Cambridge University Press, Cambridge. [ Links ]
VAN DER WESTHUIZEN H (2007) Valuing preferences for freshwater inflows into the Bira, Bushmans, Kasouga, Keiskamma, Kleinemond East, Nahoon and Tyolomqa estuaries. MCom dissertation, Nelson Mandela Metropolitan University, Port Elizabeth, Sout h Africa. [ Links ]
YACOB MR and SHUIB A (2009) Assessing the preference heterogeneity in marine ecotourism attributes by using choice experiments. Int. J. Econ. Manag. 3 367-384. [ Links ]
Received 14 March 2013
Accepted in revised form 12 June 2014.
* To whom all correspondence should be addressed.+27 41 504 2206; e-mail: deborah.lee@nmmu.ac.za

