


Servicios Personalizados
Articulo
 Inglés (pdf)
 Articulo en XML
 Referencias del artículo
Indicadores

Links relacionados
-
 Citado por Google
 -
 Similares en Google
Compartir

 Permalink
Water SA
versión On-line ISSN 1816-7950
versión impresa ISSN 0378-4738
Water SA vol.40 no.3 Pretoria jun. 2014
http://dx.doi.org/10.4314/wsa.v40i3.9
Seasonal rainfall predictability over the Lake Kariba catchment area
Shepherd MuchuruI, *; Willem A LandmanI, II; David DeWittIII; Daleen LótterII
IDepartment of Geography, Geoinformatics and Meteorology, University of Pretoria, Pretoria, South Africa
IICouncil for Scientific and Industrial Research, Natural Resources and the Environment, Pretoria, South Africa
IIIInternational Research Institute for Climate and Society, Columbia University, Palisades, New York
ABSTRACT
The Lake Kariba catchment area in southern Africa has one of the most variable climates of any major river basin, with an extreme range of conditions across the catchment and through time. Marked seasonal and interannual fluctuations in rainfall are a significant aspect of the catchment. To determine the predictability of seasonal rainfall totals over the Lake Kariba catchment area, this study used the low-level atmospheric circulation (850 hPa geopotential height fields) of a coupled ocean-atmosphere general circulation model (CGCM) over southern Africa, statistically downscaled to gridded seasonal rainfall totals over the catchment. This downscaling configuration was used to retroactively forecast the 3-month rainfall seasons of September-October-November through February-March-April, over a 14-year independent test period extending from 1994. Retroactive forecasts are produced for lead times of up to 5 months and probabilistic forecast performances evaluated for extreme rainfall thresholds of the 25th and 75th percentile values of the climatological record. The verification of the retroactive forecasts shows that rainfall over the catchment is predictable at extended lead-times, but that predictability is primarily found for austral mid-summer rainfall. This season is also associated with the highest potential economic value that can be derived from seasonal forecasts. A forecast case study of a recent extreme rainfall season (2010/11) that lies outside of the verification period is presented as evidence of the statistical downscaling system's operational capability.
Keywords: Lake Kariba catchment, coupled ocean-atmosphere model, statistical downscaling, seasonal forecasting, economic value
INTRODUCTION
Southern Africa is a region of significant rainfall variability at a range of temporal and spatial scales and is prone to serious drought and flood events (e.g. Tyson, 1986); Nicholson et al., 1987; Lindesay, 1998; Reason et al., 2000). The region is also sensitive to precipitation shifts and variability (IPCC, 2007; Reason et al., 2006). Despite the diverse climatic zones, rainfall in southern Africa is mainly observed during the austral sum-mer between October and May. The future spatial and temporal rainfall distribution and variability is uncertain (Gordon et al., 2000; Hachingonta et al., 2007). The region's summer climate is mainly driven by oscillations of the inter-tropical conver-gence zone (ITCZ) (Beilfuss, 2012). The temporal and spatial distribution of convection is associated with evaporative losses that strain food and water resources (Jury et al., 1999; Lyon B, 2009). The South Atlantic and Indian Oceans, being the major sources of moisture for southern Africa, play a major role in determining the spatio-temporal variations of rainfall in the region (Matarira and Jury, 1992; Levey and Jury, 1996; Jury et al., 1999). The aforementioned studies have provided ample evidence for regional forcing features of composite wet and dry spells caused by the atmospheric circulation. Harrison (1986), Harangozo, (1989) and Barclay et al. (1993) have found that the seasonal cycle of convective spells over southern Africa and the surrounding oceanic basins during the austral summer are characterised by equatorial extratropical temperature gradi-ents . This is caused by differential solar heating between the equator and the mid-latitudes. A more recent study has deter-mined how the external forcing of major wet spells over south-ern Africa varies through the summer (Fauchereau et al., 2009). The wet spells occur at intervals of approximately 20 to 35 d (Levey and Jury, 1996), and half of all of the wet spells appear quasi-stationery from November to March. Southern Africa is a predominantly semi-arid region with a high degree of interan-nual rainfall variability. Although much of the recent climate research has focused on the causes of drought events, the region has also experienced extremes of above-average rainfall (Washington and Preston, 2006), the most recent examples being the major flooding episodes that devastated Mozambique during 2010 and 2011 when many people were killed and nearly 200 000 people made homeless.
There is increasing change in high rainfall events in some parts of the southern Africa region (Reason et al., 2014). The variability of such rainfall can have detrimental consequences for water resources, population and property. This variabil-ity can affect the sustainability of major dams and reservoirs due to flood risks to the population and properties on the floodplain. The region's water resources, agriculture and rural communities are impacted considerably due to high rain-fall variability (Cook et al., 2004). The remote influence of El-Nino-Southern Oscillation (ENSO) events has been seen to be contributing to major floods and drought events in southern Africa (Mason and Jury, 1997; Cook, 2000 Reason and Rouault, 2002). Southern African precipitation shows high variability at all timescales (Mason and Jury, 1997). The proximity of the Agulhas, Benguela, and Antarctic circumpolar currents leads to complex and highly variable climate patterns around south-ern Africa (Shannon et al., 1990). The 1984 floods (Rouault et al., 2003) along the Namibian coast were associated with warm sea-surface temperatures (SST) in the Angola/Benguela Front region, typical of the Benguela Nino, while the 2000 floods which hit Mozambique, eastern Zimbabwe and northeast South Africa could have been influenced by tropical-temperate troughs (TTTs) (Washington and Todd, 1999; Ratna et al., 2013; Tozuka et al., 2013), which have previously been linked to high rainfall intensities. In addition, droughts in most of the southern part of southern Africa have been linked to SST vari-ations in the tropical Indian Ocean and to ENSO (Manhique et al., 2011; Vigaud et al., 2012).
Southern African rainfall has a clear annual cycle with most of the rainfall occurring during austral mid-summer and the region is susceptible to drought and floods. The identifica-tion of the seasons in which floods are most likely involves studying the characteristics of daily rainfall and streamflows within the seasons experienced across the region (Kampata et al., 2008). It is useful to characterise the spatio-temporal patterns of rainfall, its relationship with climatic variables, and linkages to streamflow variations. This is important in order to assist in formulation of adaptation measures through appropri-ate strategies of water resource management (Kampata et al., 2008). Such studies can assist in improving our understanding of hydrometeorological variability in the southern African region and result in better management of water resources (Kenabatho et al., 2009). Better understanding of the relation-ship between rainfall and climatic variables is expected to be useful in improving the predictive skills of the operational general circulation models (GCMs) ((Nsubuga et al., 2011; Landman et al., 2012). In addition, it will be possible to predict rainfall given that climatic variables are successfully predicted well in advance. Consequently, the impacts of floods and droughts can be significantly reduced.
Operational seasonal climate prediction is an emerging practice with far-reaching societal applications. An ability to predict future climate fluctuations one or more seasons in advance would have measurable benefits for decision making in hydrology, agriculture, health, energy, and other sectors of society (Barnston et al., 2004). For example, it would allow for proactive and improved reservoir management (Cunha, 2003). More recently, and largely as a result of better quantification of the climate effects of the ENSO phenomenon, prediction of precipitation have been clearly demonstrated to have skill in particular seasons, regions, and circumstances (Livezey, 1990; Kumar et al., 1996).
Many southern Africa populations depend largely on rain-fed subsistence agriculture, especially in rural areas (Booth et al., 1994), and are vulnerable to climate variability and extreme events. The population is dynamic and has been growing rapidly in recent decades. Increased population size has led to changes in the water use patterns in the region (Glantz et al., 1997). Financial and environmental gains can be realised if forecasts of rainfall are made more than one season in advance (Jury et al., 1998).
This study focuses on the Lake Kariba catchment since rainfall over this area is directly responsible for the water levels in the lake. Prior to the drought of 1982/83, which caused widespread environmental impacts in southern Africa, a regu-lar cycle of seasonal and interannual precipitation was taken for granted, e.g., Jury and Makarau (1996). Rainfall over the catch-ment is strongly seasonal. The Lake Kariba catchment area's climate is controlled mainly by the movement of air masses associated with the Inter-Tropical Convergence Zone (ITCZ) (Beilfuss, 2012). Normally the rainy season extends from November to March. The entire catchment is highly susceptible to extreme droughts and floods that occur nearly every decade (Beilfuss, 2012), but these have become more frequent and more pronounced (Christensen et al., 2007), with associated eco-nomic losses. For example, during the severe 1991/92 drought, reduced hydropower generation resulted in an estimated 102 million USD reduction in GDP, 36 million USD reduction in export earnings, and the loss of 3 000 jobs (Beilfuss, 2012). Extreme floods have also resulted in considerable loss of life, social disruptions, and extensive economic damage. For exam-ple , one of the biggest floods recorded in the Zambezi basin was in 2010/11 during mid-summer. Both Kariba and Cahora Bassa reservoirs were almost at full capacity when intense and prolonged rainfall over large areas of the basin resulted in a massive flood into Kariba. Due to the lack of knowledge and absence of forecasting there was poor communication between Lake Kariba dam managers and officials for Lake Cahora Bassa. Therefore, when Kariba successively opened the spillway gates, Cahora Bassa did not react in time to prepare for the arrival of the flood discharge from Kariba. The reaction was to open, almost immediately, all of the spillway gates of Cahora Bassa that were still closed, thus creating an enormous flood wave which, adding to the floodwaters of the tributaries located downstream of the dam, completely flooded the Lower Zambezi leading to the abovementioned catastrophes.
Lake Kariba is one of the largest hydro-electric dams in southern Africa and is the only bulk power supplier to Zambia and Zimbabwe. The generating capacity of the plant constitutes nearly 60% of the hydropower outputs for the riparian coun-tries of Zambia and Zimbabwe. The creation of Lake Kariba offered opportunities for an inland fisheries industry that had not previously existed in southern Africa. Lake Kariba offers recreational/tourism facilities attracting tourists from all over the world. Communities in the Lake Kariba catchment engage in some crop production. The catchment area is also domi-nated by wildlife national parks, effectively creating a natural resource-based tourism belt stretching from Mana Pools in the lower Middle Zambezi Valley to the facilities in Namibia/ Botswana and beyond. The combination of wildlife-based tour-ism and watersports has made Kariba an important hub in the region's tourist industry.
This paper first describes a seasonal rainfall prediction system, and then verifies retro-active rainfall forecasts pro-duced with lead-times of several months. Forecast assessment is followed by a demonstration of the potential economic impact of using such forecasts. Lastly, the paper describes a rainfall forecast for the flood season of 2010/11, i.e., that which would have been produced if the described forecast system was used operationally in late 2010.
METHODS
The archived data of the general circulation model and gridded rainfall data
We investigated the predictability of 3-month seasonal rainfall totals over the Kariba catchment during the rainy season from September through April, by statistically downscaling the archived output of a state-of-the-art coupled ocean-atmosphere general circulation model (CGCM). The atmospheric model component is the ECHAM 4.5 (Roeckner et al., 1996), and the ocean model, directly coupled (DeWitt, 2005), is version 3 of the Modular Ocean Model MOM3 (Pacanowski and Griffies, 1998). The CGCM's archived hindcast data (12-member ensem-bles) used in this study was obtained from the data library of the International Research Institute for Climate and Society (IRI, 2013). Hindcast data for this CGCM are available from January 1982 to July 2012, and consist of 12 ensemble members. There are 7 one-month lead times available from the IRI's data library, of which only 5 forecast lead-times are to be considered here. The forecasts for the coupled model are produced near the beginning of the month. The following lead-time conven-tion is used: A one-month lead time implies that there are about 3 weeks prior to the first forecast season. For example, a one-month lead-time forecast for the January-February-March (JFM) season is produced at the beginning of December, two-month lead-time forecasts in early November, etc.
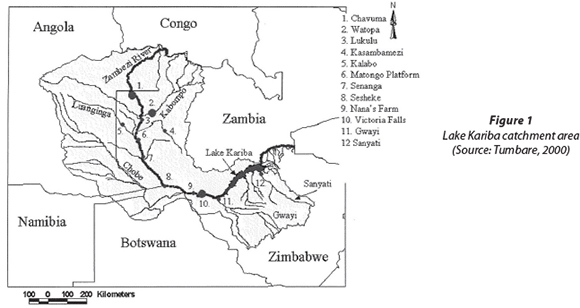
The rainfall data used for downscaling and verification was the University of East Anglia's (UEA) Climate Research Unit (CRU) version TS3.1 seasonal precipitation data at a 0.5° x 0.5° resolution (Harris et al., 2013). Here, the CRU data from 1982/83 to 2008/09 are used. The focus area of our modelling study was from 21.25° E to 31.75° E, and 13.25° S to 19.75° S, and includes the major river system of the Zambezi river basin as shown in Fig. 1.
Statistical downscaling
The CGCM output has an approximate latitude-longitude resolution of 2.8°. As it is not possible to represent local subgrid features, rainfall over southern Africa is often over-estimated by models, but it has been demonstrated that such biases can be minimised through statistical post-processing of the forecast data by applying corrections to the raw output of the model (e.g., Landman and Goddard, 2002; Robertson et al., 2012). In order to compensate for systematic errors in the global model, model output statistics (MOS) equations are developed between the hindcast variable of the CGCM and rainfall over the catchment (Wilks, 2011). MOS uses predictor values from the CGCM in both the development and forecast stages, subsequently reducing model errors. This notion of statistical post-processing has already been tested and suc-cessfully employed in studies of AGCM versus coupled model performance (Landman et al., 2012; Ndiaye et al., 2011). In addition, the post-processing will also have as a result model forecast data directly applicable over an area of interest, such as the 0.5° x 0.5° grid of the CRU data across the Lake Kariba catchment (e.g., Landman et al., 2012; Landman and Goddard, 2002; Shongwe et al., 2006). Such a forecast system could potentially be useful to a specific forecast user, such as a reservoir manager at Lake Kariba.
Since variables such as large-scale circulation are more accurately produced by global climate models than is rain-fall , these variables should be considered instead in a MOS system for seasonal rainfall downscaling (Landman et al., 2012; Landman and Beraki, 2012; Landman and Goddard, 2002). Here, we use the 12-member ensemble mean geo-potential height fields at the 850 hPa level as predictors in a canonical correlation analysis (CCA) model (e.g. Barnett and Preisendorfer, 1987), because atmospheric circulation at this level could be considered as low-level circulation since the area of interest is near the 850 hPa geopotential level. The software used for the statistical downscaling was the Climate Predictability Tool (CPT) of the IRI (2013). Before downscaling the CPT transforms the rainfall data into an approximate nor-mal distribution. In order to capture the rain- or drought-pro-ducing synoptic systems of the model the domain from which the predictors are derived covers the sub-continent south of the equator and the adjacent oceans, specifically, from the Equator to 30°S, and from Greenwich to 50° E. Empirical orthogonal function (EOF) pre-filtering on both predictor and predictand fields is automatically done by the CPT software. Our objec-tive was to test the MOS system using independent data, but also to make sure the CCA equations are reflecting a robust relationship between predictor and predictand fields (Landman and Goddard, 2002). Therefore, the MOS equations were first trained over 13 years from 1982-1994, followed by increasing the training period by 1 year for each season's downscaling (Landman et al., 2012). This incremental increase of the train-ing period mimics a true operational forecast setting, and has as a result a 14-year period (from 1995) to be verified in order to determine the seasonal-to-interannual rainfall predictability over the target area.
Verification
We define extreme season thresholds as represented by the 75th (wet category) and 25th (dry category) percentile values of the climatological record. Only verification results of the associated extreme rainfall categories are presented here. We have decided to use these particular thresholds because a reservoir manager at Lake Kariba maybe more interested in the prediction of extreme seasons, since such seasons are more likely to affect the inflow and outflow of the reservoir than 'normal' rainfall seasons would (Sene, 2009). Moreover, the 'normal' category is also the least predictable (Van Loon and Toth, 1991). Such a category description has been used before and it has been shown that the prediction of such extreme rainfall seasons over southern Africa has skill (Landman et al., 2005; Landman et al., 2012).
The seasonal climate is inherently probabilistic, and so the downscaled retro-active forecasts are also judged probabil-istically (Landman et al., 2001; Mason and Mimmack, 2002; Troccoli et al., 2008). Two of the main attributes of interest here for probabilistic forecasts are discrimination and reliability, because a reservoir manager may need to know whether or not a coming rainfall season is likely to be associated with extreme rainfall totals or with very low rainfall totals over the catch-ment , and may want to also know the reliability with which such probabilistic forecasts are made when they attempt to discriminate very wet seasons and very dry seasons from the rest of the seasons. The forecast verification measures presented here for testing these attributes of discrimination and reli-ability are, respectively, the relative operating characteristics (ROC); (Mason and Graham, 2002) and the reliability diagram (Hamill, 1997). These attributes have been tested extensively over parts of southern African before (Landman and Beraki, 2012; Landman et al., 2012), but not specifically focussing on the Kariba catchment, which is our area of study.
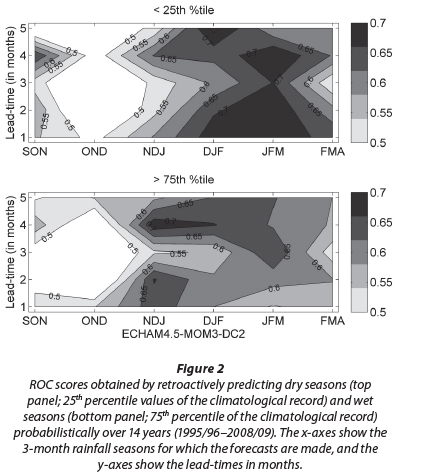
ROC applied to probabilistic forecasts indicates whether the forecast probability was higher when an event such as a flood season (defined by rainfall totals > the 75th percentile of the climatological record) or drought season (defined by rainfall totals < the 25th percentile of the climatological record) occurred compared with when it did not occur. The ROC curve is produced by plotting the forecast hit rates against the false alarm rates. The scores for the two extreme rainfall categories are represented by the respective areas beneath the ROC curve. For no-skill forecasts the area would be <0.5 and for perfect discrimination the ROC score is 1.0. When there is consist-ency between the predicted probabilities of the extreme rainfall categories and the observed relative frequencies of the observed rainfall being assigned to these categories, then the downscaled hindcasts are considered reliable (Yuan et al., 2014). We also performed some verification on deterministic downscaled hindcasts. For this purpose we use the Kendall ranked cor-relation coefficient or Kendall's tau. An advantage of using Kendall's tau is that it has close affinities with the area beneath the ROC curve (Jolliffe and Stephenson, 2012).
Retroactive forecast skill
Relative operating characteristics
The ROC scores for the 3-month seasons from September-October-November (SON) through February-March-April (FMA) obtained by retroactively predicting extreme (a) wet and (b) dry seasons over the retroactive years are shown in Fig. 2. Poor skill (ROC < 0.5) is generally found over the catch-ment from SON through OND, but skill improves towards the main austral summer rainfall period from about November-December-January (NDJ) when most of the seasonal rainfall occurs. During this time, the reservoir starts to get most of its inflow from rivers within the catchment with a peak inflow by the austral autumn caused by mid-summer rainfall over the catchment. Moreover, Fig. 2 shows that during the seasons with high ROC scores these skill levels are found across all the lead-times presented, including lead-times of 4 months when high ROC scores are found for both the extreme below- and above-normal rainfall categories. These skill levels and lead-times provide the potential for reservoir managers to make informed decisions regarding the likelihood of high or low rain-fed inflows into the reservoir during austral summer, several months ahead of time.
Reliability
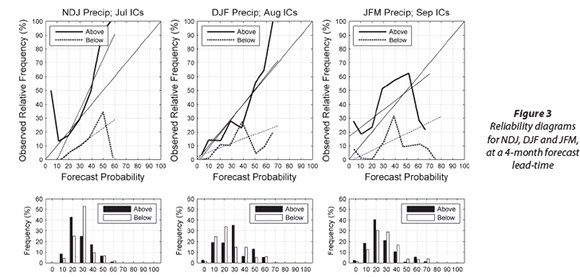
We have demonstrated the forecast system's ability to discrimi-nate extremely wet or dry seasons from the rest of the seasons. Now we will assess if the confidence with which the probabilis-tic forecasts of extremely wet or dry seasons are made is war-ranted . As stated above, only the three seasons associated with the highest ROC scores are considered from now on, and at the useful lead-time of 4 months. Figure 3 shows the reliability and frequency diagrams for NDJ (left panels), December-January-February (DJF) (middle panels) and JFM (right panels). For perfect reliability (the forecast probabilities match the observed frequencies of respectively wet and dry seasons), the weighted regression lines (thin solid and dashed lines) will be on the diagonal line. When the slope of the regression line is shallower (/steeper) than the diagonal line, forecasts for the particular category tend to be over-(/under-)confident. Close to perfect reliability is seen for the prediction of DJF wet seasons (thin solid line almost on top of diagonal), but respectively under-and over-confident forecasts are seen for NDJ and JFM. For dry season prediction, however, forecasts tend to constantly be over-confident. The histograms in the reliability diagram of Fig. 3 show the frequencies with which wet-dry forecasts occur in probability intervals of 10%, and reveals how strongly and frequently the issued forecast probabilities depart from the climatological probabilities. The histograms generally show intermediate confidence and a general lack of sharpness.
Deterministic skill assessment
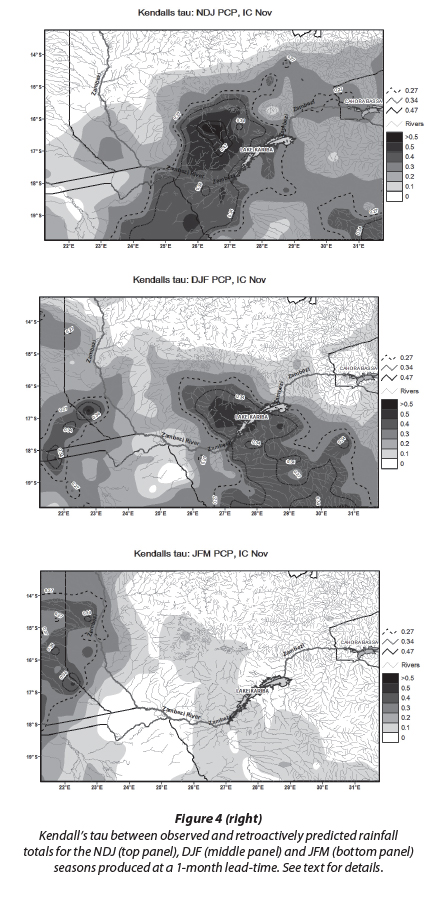
The deterministic forecast performance over the retro-active period is determined next, by considering a verification parameter that has a close relationship with the area under the ROC curve, i.e., Kendall's tau correlation statistic (Jolliffe and Stephenson, 2012; Wilks, 2011). Kendall's tau is a robust and resistant alternative to the 'ordinary' or Pearson correlation. This statistic is calculated here between retro-forecasts and the observed seasonal rainfall anomalies at each CRU grid point. Figure 4 shows the Kendall's tau for the NDJ, DJF and JFM seasons, but only for a 1-month lead-time (there is a gradual decrease in skill for increasing lead-time). The dashed, stip-pled and solid lines on the figure respectively show the loca-tions of the 90% (0.27), 95% (0.34) and 99% (0.47) levels for local significance testing. The significance levels are calculated with a re-randomisation or Monte Carlo test (Wilks, 2011). For all three seasons considered, skill was found for the upper Zambezi catchment. Large areas of positive correlation are also found, with the best performance of the forecast system for NDJ and DJF rainfall over an area west of Lake Kariba. Low skill is found for the larger part of the area for JFM rainfall, and generally over the northern part of the study area.
Economic value of the probabilistic forecasts
The 14 years of downscaled retroactive forecasts, e.g., Landman et al. (2001), are evaluated next in terms of their potential economic value for an end-user such as the reservoir manager at Lake Kariba. In the past, such users used other techniques of forecasting systems (e.g., Hagedorn et al., 2008), such as the Brier Skill Score (Hagedorn et al., 2008; Wilks, 2006). More recently, other techniques have been developed to illustrate the potential economic benefits of a forecast system (e.g. the costs/ loss approach of Richardson (2000) or the relative income of Roulston et al. (2003)). Such scoring metrics are used to focus not only on the general skill of the forecasts per se, but also to reflect various aspects of the potential economic value of a fore-cast system (Hagedorn et al., 2008). Even if such diagnostics are well understood in the scientific community they often provide little intuitive insight for a forecast user and may prove inef-fective in demonstrating to users that incorporating forecasts such as those presented above in their decision-making systems is worth the costs involved. For example, the cumulative profit (CP) graphs depicted in Fig. 5 indicate how an initial finan-cial investment in the forecast would change in value over the 14-year verification period presented if it were invested in the forecasts and was paid fair odds on the outcome over the three seasons of NDJ, DJF and JFM. CP graphs can be interpreted as follows: If the CP value is 0.4 for a particular year, for example, it means that an initial investment of USD100 would now be worth USD140 for that year. One would subsequently invest all USD140 on the next year's forecast, and so forth.
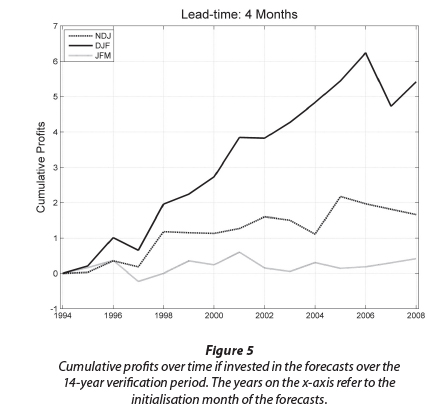
CP values increase the most during DJF (Fig. 5). Figure 5 shows how seasonal rainfall predictions for that season can bring about substantive financial rewards for users of such forecasts. Lower increases in profits are seen for NDJ and JFM with the latter showing only marginal economic value over the 14 test years. Take note of the association between the skill levels presented above (Figs 2 and 3) for the three seasons and the corresponding cumulative profits (Fig. 5) - the higher the skill (ROC and reliability) the more profitable the use of the forecasts seems to become. This apparent association between skill and economic value should further motivate the use of forecast value assessment tools such as the CP presented above and the two-alternative forced choice test (Mason and Weigel, 2009). These tools will enable forecast producers to commu-nicate the value of their probability forecasts to a wider user community. Reservoir managers, who are also decision mak-ers , may not be experts on probabilistic forecast verification since they are more likely to be skilled in financial matters -they are largely interested in both profit making and value for money (Hagedorn et al., 2008), as well as optimised reservoir operations.
Predicting the 'flooding across southern Africa'
According to media reports, in January 2011 southern Africa experienced flooding across the region, which saw Lake Kariba open its spillway gates on 22 January 2011 as a result of high water levels in the lake (Bulawayo News24, 2011). The high lev-els were a result of persistent summer rainfall in the Zambezi River Basin catchment area (Siavonga News, 2011). River authorities at Lake Kariba consider the maximum level for this time of the year to be 485 m, and the current water level in early 2011 was around 484.8 m. The Zambezi River Authority (ZRA) subsequently opened two spillway gates thereby increasing its discharge to around 3 000 m3/s. Opening of the spillway gates resulted in rising water levels and increased flooding further downstream. The relevant government authorities of Zimbabwe and Zambia issued flood warnings to districts adjacent to the lower Zambezi River, with district disaster managers alerting downstream communities and preparing for possible major flooding. These actions notwithstanding, the resulting flooding downstream resulted in loss of life and property.
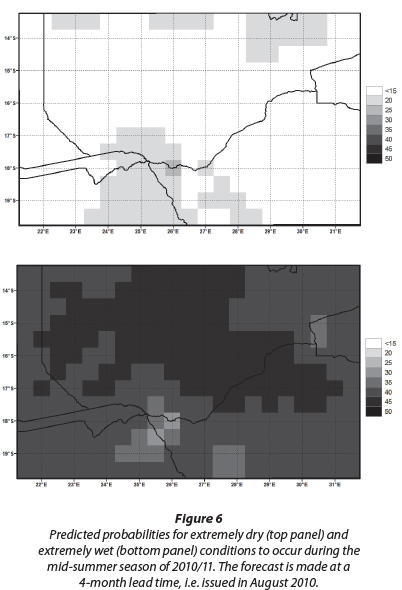
The question we want to address next is, assuming the prediction technology introduced here had been developed and operationalised before the 2010/11 flooding of our study area, whether the prediction system would have been able to issue a warning months ahead of time for the likelihood of a particularly wet mid-summer (DJF) rainfall season to occur. The ECHAM4.5-MOM3-DC large-scale DJF 2010/11 forecasts produced at a 4-month lead-time (i.e. issued in August 2010) are subsequently downscaled to DJF rainfall at the CRU resolu-tion over the study area. Figure 6 shows the probabilistic DJF rainfall forecast for the above-normal (>75th percentile of the climatological record) and below-normal (<25th percentile of the climatological record) rainfall categories that would have been predicted if the prediction system introduced here had been used. The larger area of the catchment is associated with increased probabilities of above-normal rainfall occurring during DJF. This forecast of a high likelihood of rainfall inun-dation is evidence that the skilful forecast system introduced here would have been able to predict with high confidence, 4 months ahead of time, an extremely wet mid-summer season in 2010/11. This forecast could have been useful to Lake Kariba managers who needed to plan months ahead of the rainy sea-son , consequently leading to reduced losses suffered during the actual flooding season.
DISCUSSION AND CONCLUSIONS
Lake Kariba is the world's largest artificial lake and reservoir by volume. The Lake Kariba catchment area has one of the most variable climates of any major river basin in Africa with an extreme range of conditions across the catchment and through time. The paper focuses on Lake Kariba due to its economic and social significance for the region. The importance of Lake Kariba motivated investigation of the predictability of seasonal rainfall totals over the catchment during the rainy season from September through April, by empirically downscaling the coarse-resolution output (~2.8°) of a state-of-the-art coupled ocean-atmosphere general circulation model (CGCM) to 0.5° resolution rainfall grids.
The seasonal rainfall forecast system produced retroactive forecasts for 14 years in a fashion that mimics a true opera-tional setting, and the skill of the forecast system was subse-quently determined over the independent period from 1995/96. The system has been found to be able to discriminate extremely dry/wet seasons from the rest of the seasons. Moreover, close to perfect reliability has been found for the DJF season when predicting wet seasons. DJF is an important season since it is associated with the highest rainfall totals in the year. However, forecasts are for the most part over-confident, which is a com-mon problem for seasonal forecasting, also in the region. A diagnostic other than the standard verification parameters has also been introduced to specifically address the potential economic benefits of the forecast system. The paper has shown how an initial financial investment would change in value over the 14-year verification time if it were invested in the forecasts and was paid fair odds on the actual outcome over the seasons considered. The highest profits have been found for the DJF season, which is the same season for which the best standard verification values were found - the higher the skill the more profitable the use of the forecasts becomes. The developed forecast system was also tested for the 2010/11 season associ-ated with huge losses, especially downstream of Lake Kariba. The paper has demonstrated that the forecast system produced a potentially useful forecast of high probabilities of extremely high rainfall totals to occur during DJF. It will be useful if such a forecast model should become part of a decision support sys-tem for the Zambezi River. The demonstrated forecast system is a result of post-processing output from a highly sophisticated dynamical forecast model. The latter type of models are expen-sive to administer, but a good number of international centres, such as the IRI from which the model data for this research was obtained, are making their forecast outputs available for opera-tional use. This data availability can further enable modellers in southern Africa to develop forecast systems specific to their interest and application without having to run expensive globa models. This notion needs to be further developed, for exampli for the actual streamflows into Lake Kariba.
ACKNOWLEDGEMENTS
This material is based upon work fully supported financially by the Applied Center for Climate and Earth Systems Science (ACCESS). The authors would like to thank IRI for the use of their CGCM data accessed through their website (http://iridl ldeo.columbia.edu//).
REFERENCES
BARCLAY J, JURY MR and LANDMAN WA (1993) Climatological and structural differences between wet and dry troughs over southern Africa in the early summer. Meteorol. Atmos. Phys. 51 41-54. [ Links ]
BARNET TP and PREISENDORFER R (1987) Origins and levels of monthly and seasonal forecast skill for United States surface air temperatures determined by canonical correlation analysis. Mon. Weather Rev. 115 1825-1850. [ Links ]
BARNSTON AG, KUMAR AL, GODDARD L and HOERLING MP (2004) Improving seasonal prediction practices through attribution of climate variability. Bull. Am. Meteorol. Soc. 86 (1) 59-72. [ Links ]
BEILFUSS RD (2012) A Risky Climate for Southern African Hydro. Hydrological Risks and Consequences for Zambezi River Basin Dams. International Rivers. Berkeley, CA. [ Links ]
BOOTH A, MCCULLUM J, MPINGA J and MUKUTE M (1994) State of the Environment in Southern Africa. SARDC - Southern African Research and Documentation Centre in collaboration with IUCN and the Southern African Development Community, Harare. 332 [ Links ]
BULAWAYO NEWS (2011) Heavy rains and widespread flooding: URL: http://bulawayo24.com/index-id-news-sc-national-byo-10638.html(Accessed 21 September 2013). [ Links ]
COOK C, REASON CJC and HEWITSON BC (2004) Wet and dry spells within particularly wet and dry summers in the South African summer rainfall region. Clim. Res. 26 17-31. [ Links ]
COOK KH (2000) The South Indian convergence zone and interannual rainfall variability over Southern Africa. J. Clim. 13 (1) 3789-3804. [ Links ]
CUNHA MD (2003) Water systems planning. The optimization per-spective . Eng. Optimiz. 35 255-266. [ Links ]
DE WITT DG (2005) Retrospective forecasts of interannual sea surface temperature anomalies from 1982 to present using a directly coupled atmosphere-ocean general circulation model. Mon. Weather Rev. 133 2972-2995. [ Links ]
FAUCHEREAU N, POHL B, REASON CJC, ROUAULT M and RICHARD Y (2009) Recurrent daily OLR patterns in the Southern Africa/Southwest Indian Ocean region, implications for South African rainfall and teleconnections. Clim. Dyn. 32 575-591. [ Links ]
GLANTZ M, BESTILL M and CRANDALL K (1997) Food security in southern Africa. Assessing the use and value of ENSO information. NOAA Project Report. NCAR, Boulder. DOI: 10.1007/978-94-0173010-5. 142 pp. [ Links ]
GORDON C, COOPER, SENIOR CA, BANKS H, GREGORY JM, JOHNS TC, MITCHELL JFB and WOOD RA (2000) The simulation of SST, sea ice extents and ocean heat transports in a version of the Hadley Centre coupled model without flux adjustments. Clim. Dyn. 16 (2-3) 147-168. [ Links ]
HACHIGONTA S, REASON R and TADROSS M (2007) An analysis of onset date and rainy season duration over Zambia. Theor. Appl. Climatol. 91 229-243. [ Links ]
HAGEDORN R and SMITH LA (2008) Communicating the value of probabilistic forecasts with weather roulette. J. Meteorol. Appl. 16 143-155. [ Links ]
HAMILLT M (1997) Reliability diagrams for multicategory probabilistic forecasts. Weather Forecast. 12 736-741. [ Links ]
HARANGOZO SA (1989) Circulation characteristics of some South African rainfall systems. MSc thesis, Univ of the Witwatersrand.341 pp. [ Links ]
HARRIS I, JONES PD, OSBORN TJ and LISTER DH (2013) Updated high-resolution grids of monthly climatic observations. Int. J. Climatol. 34 623-642. [ Links ]
HARRISON M SJ (1986) A synoptic climatology of South African summer rainfall variations. PhD thesis, University of the Witwatersrand. 341 pp. [ Links ]
HUUG MVD and ZOLTAN T (1991) Why do forecasts for "Near Normal" often fail? Weather Forecast. 6 76-85. [ Links ]
JOLLIFFE IT and STEPHENSON DB (2012) Forecast Verification. A Guide in Atmospheric Science. John Wiley and Sons Ltd, Chichester. [ Links ]
IPCC (INTERGOVERNMENTAL PANEL ON CLIMATE CHANGE) (2007) Climate Change 2007: The Physical Science Basis. Contribution of Working Group I to the Fourth Assessment Report of the Intergovernmental Panel on Climate Change. Solomon S, Qin D, Manning M, Chen Z, Marquis M, Averyt KB, Tignor M and Miller HL (eds.). Cambridge University Press, Cambridge. [ Links ]
IRI (INTERNATIONAL RESEARCH INSTITUTE FOR CLIMATE AND SOCIETY) (2013). The IRI/LDEO Climate Data Library. URL: http://iridl.Ideo.columbia.edu/ (Accessed 21 September 2013). [ Links ]
IRIN NEWS (2011) Humanitarian news and analysis. URL: http://www.irinnews.org/report/91698/southern-africa-heavy-rain-puts-relief-agencies-on-alert . (Accessed 21 September 2013). [ Links ]
JURY MR (1992) A climatic dipole governing the interannual variability of convection over the SW Indian Ocean and SE Africa region. Trends Geophys. Res. 1 165-172. [ Links ]
JURY MR (1998) Intra-seasonal convective variability over Southern Africa. Principal component analysis of Pentad outgoing-longwave radiation departures. Theor. Appl. Climatol. 62 133-146. [ Links ]
JURY MR and MAKARAU A (1996) Predictability of Zimbabwe summer rainfall. Int J. Climatol. 17 1421-1432. [ Links ]
JURY MR, MULENGA HM and MASON SJ (1999) Exploratory long-range models to estimate summer climate variability over southern Africa. J. Clim. 12 1892-1899. [ Links ]
KAMPATA JM, PARIDA BP and MOALAFHI DB (2008) Trend analysis of rainfall in the headstreams of the Zambezi River Basin in Zambia. Phys. Chem. Earth 33 621-625. [ Links ]
KENABATHO PK, McINTYRE NR and WHEATER HS (2009) Impacts of rainfall uncertainty on water resource planning models in the Upper Limpopo basin, Botswana. In: New Approaches to Hydrological Prediction in Data Sparse Regions. Proc. of Symposium HS.2 at the Joint IAHS & IAH Convention, Hyderabad, India, September 2009. IAHS Publ. 333. IAHS, Hyderabad, India. [ Links ]
KUMAR AM, HOERLING MJI, LEETMA AA and SARDESHMUKH P (1996) Assessing a GCM's suitability for making seasonal predictions J. Clim. 9 115-129. [ Links ]
LANDMAN WA (2001) Forecasts or near-global sea surface temperatures using canonical correlation analysis. J. Clim. 14 3819-3833. [ Links ]
LANDMAN WA and BERAKI A (2012) Multi-model forecast skill for mid-summer rainfall over southern Africa. Int. J. Climatol. 32 303-314. [ Links ]
LANDMAN WA and GODDARD L (2002) Statistical recalibration of GCM forecast over southern Africa using model output statistics. J. Clim. 15 2038-2055. [ Links ]
LANDMAN WA, BOTES S, GODDARD L and SHONGWE M (2005) Assessing the predictability of extreme rainfall seasons over southern Africa. Geophys. Res. Lett. 32 L23818 DOI: 101029/2005GL023965. [ Links ]
LANDMAN WA, DE WITT D, LEE DE, BERAKI A and L6TTER D (2012) Seasonal rainfall prediction skill over South Africa. 1- vs. 2-tiered forecasting systems. Weather Forecast. 27 489-501.
LEVEY KM and JURY MR (1996) Composite intra-seasonal oscillations of convection over southern Africa. J. Clim. 9 1910-1920. [ Links ]
LINDESAY JA (1988) South African rainfall, the Southern Oscillation and a Southern Hemisphere semi-annual cycle. J. Climatol. 8 17-30. [ Links ]
LIVEZEY RE (1990) Variability of skill of long-range forecasts and implications for their use and value. Bull. Am. Meteorol. Soc. 71 300-309. [ Links ]
LYON B (2009) Southern Africa summer drought and heat waves. Observations and coupled model behavior. J. Clim. 22 6033-6046. [ Links ] MAKARAU A (1995) Intra-seasonal oscillatory modes of the Southern Africa summer circulation. PhD thesis, Oceanography Department, University of Cape Town. [ Links ]
MANHIQUE A J, REASON CJC, RYDBERG LR and FAUCHEREAU N (2011) ENSO and Indian Ocean Sea surface temperatures and their relationships with tropical temperate troughs over Mozambique and the southwest Indian Ocean. Int. J. Climatol. 31 1-13. [ Links ]
MASON SJ and GRAHAM NE (2002) Areas beneath the relative operating characteristics (ROC) and levels (ROL) curves. Statistical significance and interpretation. Q. J. R. Meteorol. Soc. 128 2145-2166. [ Links ]
MASON SJ and JOUBERTA M (1997) Simulated changes in extreme rainfall over southern Africa. Int. J. Climatol. 17 291-301. [ Links ]
MASON SJ and WEIGEL AP (2009) A generic forecast verification framework for administrative purposes. Mon. Weather Rev. 137 (1) 331-349. [ Links ]
MASON SJ (1995) Sea surface temperature-South African rainfall associations, 1910-1989. Int. J. Climatol. 15 119-135. [ Links ]
MASON SJ and JURY MR (1997) Climate variability and change over southern Africa. A reflection on underlying processes. Prog. Phys. Geog. 21 23-50. [ Links ]
MATARIRA CH and FLOCAS AA (1989) Spatial and temporal rainfall variability over SE central Africa during extremely dry and wet years. J. Meteorol. 14 3-9. [ Links ]
MATARIRA CH and JURY MR (1992) Contrasting meteorological structure of intra-seasonal wet and dry spells in Zimbabwe. Int. J. Climatol. 12 165-176. [ Links ]
NDIAYE O, WARD M N and THIAW W M (2011) Predictability of seasonal Sahel rainfall using GCMs and lead-time improvements through the use of a coupled model. J. Clim. 24 1931-1949. [ Links ]
NICHOLSON SE and ENTEKHABI D (1987) Rainfall variability in equatorial and southern Africa. Relationships with sea surface temperatures along southwestern coast of Africa. J. Clim. Appl. Meteorol. 26 561-578. [ Links ]
NSUBUGA FWN, OLWOCH JM and RAUTENBACH CJ (2011) Climatic trends at Namulonge in Uganda, 1947-2009. J. Geogr. Geol. 3 119-131. [ Links ]
PACANOWSKI RC and GRIFFIES SM (1998) MOM 3.0 manual. NOAA/Geophysical fluid dynamics. J. Phys. Oceanogr. 28 831-841. [ Links ] PALMER TN, ALESSANDRI A, ANDERSEN U, CANTELAUBE P,
DAVEY M, DOBLAS-REYES FJ, FEDDERSEN H, GRAHAM R, HAGEDORN R, HOSHEN M and ROGEL P (2004) Development of a European multimodel ensemble system for seasonal-to-inter-annual prediction. Bull. Am. Meteorol. Soc. 85 853-872.
RATNA SB, BEHERA S, RATNAM JV, TAKAHASHI K and YAMA-GATA T (2013) An index for tropical temperate troughs over southern Africa. Clim. Dyn. 41 421-441. [ Links ]
REASON CJC and HACHINGONTA S (2006) Interannual variability in dry and wet spell characteristics over Zambia. Clim. Res. 32 49-62. [ Links ]
REASON CJC and WELDON D (2014) Variability of rainfall characteristics over the South Coast region of South Africa. Theor. Appl. Climatol. 115 177-185. [ Links ]
REASON CJC, ALLAN RJ, LINDESAY JA and ANSELL TJ (2000) ENSO and climatic signals across the Indian Ocean basin in the global context. Part 1 Interannual composite patterns. Int. J. Climatol. 20 1285-1327. [ Links ]
REASON CJC and ROUAULT M (2002) ENSO-like decadal patterns and South African rainfall. Geophys. Res.29 161-164. [ Links ]
RICHARDSON DS (2000) Skill and economic value of the ECMWF ensemble prediction system. Q. J. R. Meteorol. Soc. 126 649-668. [ Links ]
ROBERTSON AW, DIAN-HUA Q and MICHAEL KT (2012) Down-scaling of seasonal rainfall over the Philippines. Dynamical versus statistical approaches. Mon. Weather Rev. 140 1204-1218. [ Links ]
ROECKNER E, ARPE K, GIORGETTA M, SCHLESE U, SCHUL-WEIDA U, CLAUSSEN M, BENGTSSON L and CHRISTOPH M (1996) Simulation of present-day climate with the ECHAM4 model. Impact of model physics and resolution. Max Planck Inst. Meteorol. Rep. 93. 171 pp. [ Links ]
ROUAULT M and FLORENCHIE P (2003) South east tropical Atlantic warm events and southern African rainfall. Geophys. Res. Lett. 30 DOI: 10.1029/2002GL014840. [ Links ] ROULSTON MS and SMITH LA (2003) Combining dynamical and statistical ensembles. Tellus Series A-Dyn. Meteorol. Oceanogr. 55 16-30. [ Links ]
SENE K (2009) Hydro-Meteorology. Forecasting and Applications. Springer, Dordrecht. [ Links ] SHANNON LV, LUTJEHARMS JRE and NELSON G (1990) Causative mechanisms for intra-annual and interannual variability in the marine environment around southern Africa. S. Afr. J. Sci. 86 356-373. [ Links ]
SHONGWE M E, LANDMAN WA and MASON SJ (2006) Performance of recalibration systems for GCM forecasts for southern Africa. Int. J. Climatol. 26 1567-1585. [ Links ]
SIAVONGA NEWS (2011) Spillway gates opened for the second time in 2011. URL: (http://www.siavonga-zambia.com/news-archive-2/spillway-gates-open-march-2011.html) (Accessed 21 September 2013). [ Links ]
CHRISTENSEN JH, HEWITSON B, BUSUIOC A, CHEN A, GAO X, HELD I, JONES R, KOLLI RK, KWON W-T, LAPRISE R, MAGANA RUEDA V, MEARNS L, MENÉNDEZ CG, RAISANEN J, RINKE A, SARR A AND WHETTON P (2007) Regional Climate Projections. In: Climate Change 2007: The Physical Science Basis. Contribution of Working Group I to the Fourth Assessment Report of the Intergovernmental Panel on Climate Change. Solomon S, Qin D, Manning M, Chen Z, Marquis M, Averyt KB, Tignor M and Miller HL (eds.). Cambridge University Press, Cambridge. [ Links ]
TOZUKA T, ABIODUN BJ and ENGELBRECHT FA (2013) Impacts of convection schemes on simulating tropical-temperate troughs over southern Africa. Clim. Dyn. Doi: 10.1007/s00382-013-1738-4. [ Links ]
TROCOLLI AM, HARRISON D L, ANDERSON T and MASON SJ (2008) Seasonal Climate: Forecasting and Managing Risk. NATO Science Series on Earth and Environmental Sciences 82 467 pp. [ Links ]
TYSON PD (1986) Climatic Change and Variability in Southern Africa. Oxford University Press, Cape Town. [ Links ]
VIGAUD N, POHL B and CRETAT J (2012) Tropical-temperate interactions over southern Africa simulated by a regional climate model. Clim. Dyn. 39 2895-2916.0 [ Links ]
WASHINGTON R and PRESTON A (2006) Extreme wet years over southern Africa. Role of Indian Ocean sea surface temperatures. J. Geophys. Res. 111 DOI: 101029/2005JD006724. [ Links ]
WASHINGTON R and TODD M (1999) Tropical-temperate links in Southern Africa and Southwest Indian Ocean satellite-derived daily rainfall. Int. J. Climatol. 19 1601-1616. [ Links ]
WILKS DS (2006) Statistical Methods in the Atmospheric Sciences (2nd edn). Elsevier, Amsterdam. 627 pp. [ Links ] WILKS DS (2011) Statistical Methods in the Atmospheric Sciences (3rd edn). International Geophysics Series 100. Academic Press, New York. [ Links ]
YUAN C, TOZUKA T, LANDMAN WA and YAMAGATA T (2014) Dynamical seasonal prediction of southern African summer precipitation. Clim. Dyn. 42 3357-3374, DOI: 10.1007/ s00382-013-1923-5. [ Links ]
Received 24 October 2013
Accepted in revised form 20 June 2014.
* To whom all correspondence should be addressed.+27 83 785-7115; e-mail: shephido@yahoo.com

