


Servicios Personalizados
Articulo
 Inglés (pdf)
 Articulo en XML
 Referencias del artículo
Indicadores

Links relacionados
-
 Citado por Google
 -
 Similares en Google
Compartir

 Permalink
Water SA
versión On-line ISSN 1816-7950
versión impresa ISSN 0378-4738
Water SA vol.40 no.3 Pretoria jun. 2014
http://dx.doi.org/10.4314/wsa.v40i3.7
TECHNICAL NOTE
A hydraulic test device for free-flowing artesian boreholes with a case study in Table Mountain Group (TMG) aquifers, South Africa
Xiaobin Sun; Yongxin Xu*
Department of Earth Sciences, University of the Western Cape, Cape Town 7535, South Africa
ABSTRACT
Accurate parameter estimation for aquifers is very challenging, particularly for artesian aquifers in which the potentio-metric surface is above ground level. A common approach to parameter estimation for artesian aquifers is to make use of free-flowing and recovery tests. However, such aquifer tests on artesian boreholes are seldom carried out due to lack of an appropriate device readily available for data collection. This paper describes a hydraulic test device for recording flow rate, pressure, EC and pH measurements using an ultrasonic flowmeter, pressure transmitter, EC and pH meters. A procedure to set up the device in the field is outlined. To test the device, an artesian borehole in the Table Mountain Group (TMG) aquifers of South Africa was chosen as a case study, where the device was applied to measure and record flow rate and pressure of the aquifer, as well as EC and pH. Compared with previous free-flowing test data measured manually, the flow data captured by the device was accurate and reliable, and can be utilised to estimate the hydraulic properties of an artesian aquifer. The advantages and disadvantages of the device are discussed, followed by suggestions for improvement. Given that a large number of flowing artesian boreholes are present in the TMG area in which the pressure head of the aquifer is often above ground level, the applicability of the device presented is likely to be widespread. With due improvement of the test device, its wider application in similar conditions, e.g. to artesian holes in the Karoo, would be expected in future.
Keywords: flowing artesian borehole, hydraulic test device, free-flowing test, TMG aquifers, data capture
INTRODUCTION
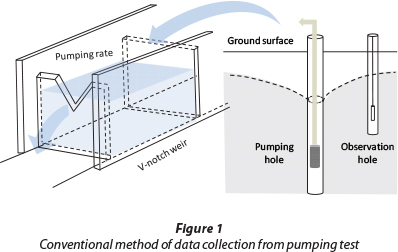
Estimates of aquifer properties are usually achieved by pump-ing tests. The most common form of pumping test is the constant-rate pumping test in which a borehole is abstracted at a constant rate and the water level is measured in the pump-ing borehole itself, and, optimally, in one or more surrounding observation boreholes. The conventional method of data collec-tion during a pumping test is shown in Fig. 1. Discharge meas-urement is usually taken using a certain volume of bucket and a timer under low flow rate conditions, or using the V-notch weir under high flow rate circumstances. Unlike unconfined aquifers, for an artesian aquifer in which the hydrostatic head is higher than the land surface, no pump is needed to run the aquifer test. From an operational standpoint, free-flowing and recovery tests on a borehole drilled into the aquifer are often adopted to estimate the hydraulic properties. The tests involve allowing the groundwater to flow freely without pumping under the artesian condition, with measurements of discharge rate and pressure head at the artesian borehole taken simul-taneously . However, the flow and pressure of the artesian hole change so rapidly at the beginning of the test that measure-ments using the conventional method can hardly be accurate. Therefore, a special hydraulic test device for data collection in this context is deemed to be critical.
A number of studies of data capture using devices applied to a flowing artesian borehole have been carried out since 1960s. For instance, a photographic method - using a motion picture camera, stopwatch, and manometer tube - recording water-level measurements and micro-time measurements, was suc-cessfully used to capture free-flowing test data at an artesian borehole in Martin County, Florida (Wyrick and Floyd, 1961). A device incorporating a non-invasive ultrasonic flowmeter and an airline pressure gauge was developed and applied in Stanfield, Oregon, to measure the flow rate and pressure head in an artesian aquifer test (Oberlander and Almy, 1979). Compared with the photographic method, data captured by the latter approach is more accurate. However, no details or photo-graph explaining the configuration of the test unit could be found in the report. This led to the idea of applying an appro-priately integrated ultrasonic flowmeter and pressure transmit-ter to flowing artesian boreholes for data collection.
In this study, a hydraulic test device for free-flowing artesian boreholes was conceptualised and developed. The device was applied at a flowing artesian borehole in the Table Mountain Group (TMG) aquifers, South Africa, to capture data during an aquifer test. The results were compared with the data collected manually from a separate test at the same borehole. The advantages and disadvantages of the device are discussed, followed by suggestions for improvement.
METHODOLOGY
Free-flowing artesian boreholes and artesian aquifers
An artesian borehole is a borehole that taps into a confined aquifer where the water level rises above the top of the aquifer, but does not necessarily reach the ground surface. A flow-ing artesian borehole is one in which the water level rises to a height that is greater than that of the ground surface (Fig. 2). Flowing artesian boreholes can flow on an intermittent or con-tinuous basis and originate from unconsolidated aquifers, karst aquifers or fractured rock aquifers.
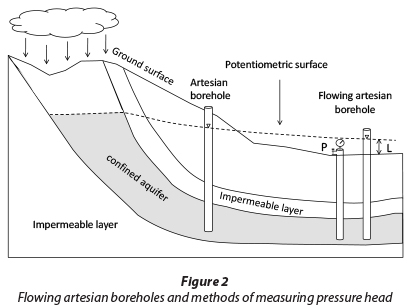
It is noted that the potentiometric surface (Fig. 2) is an imaginary surface above the aquifer, to which water from an artesian aquifer would rise in a pipe. The term potentiometric surface means head- or potential-indicating surface and is preferable to the term piezometric surface (Freeze and Cherry, 1979; Domenico and Schwartz, 1998), which is found in some of the literature.
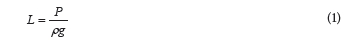
Pressure head of a flowing artesian borehole is defined as the vertical distance from the ground surface to the potentio-metric level, and can be measured either by extended casing or a pressure gauge installed on the top of the borehole (Fig. 2). The pressure can be converted to pressure head in meters using the following equation (Weight, 2008):
where:
L is the pressure head of the artesian aquifer in meters
P the pressure in kPa
ρ the density of water (103 kg/m3
g the gravitational acceleration (9.8 m/s2)
A major difference between unconfined and artesian aquifers is that an artesian aquifer has volume elasticity. Under artesian conditions, the artesian aquifer remains saturated with water as the potentiometric surface declines, the water withdrawn from storage is released both by compression of the aquifer and by expansion of the water, and reduction in storage may be per-manent (inelastic) as well as elastic (Meinzer and Hard, 1925; Meinzer, 1928; Thompson, 1929). This was considered the first lucid statement on storage in an artesian system.
Another large difference between unconfined aquifers and artesian aquifers is the rate of spreading of the cone of depres-sion . In an unconfined aquifer, a large volume of water drains slowly by gravity from the sediment within the spreading cone. In an elastic artesian aquifer, the pressure change traverses the aquifer at the speed of sound; the cone of depression and the area of influence grow very rapidly, but at a gradually diminish-ing rate. The area of influence of the cone of depression in an artesian aquifer pressure surface is commonly several thousand times larger than that in an unconfined aquifer (Lohman, 1965). For instance, elaborate aquifer tests in an artesian basin in Utah and a non-artesian basin in Nebraska, United States, were conducted to explore the transmission of pressure and the extending rate of the cone of depression, respectively (Leggette and Taylor, 1934; Wenzel, 1936). Even though the effects of pressure changes in the artesian aquifer were transmitted at different rates according to varying conditions, in all cases the transmission occurred at a much more rapid rate than for the tests under non-artesian conditions, where the rim of the cone of depression reached 150 m from the production borehole in 2 h, 270 m in 6 h, and about 360 m in 12 h. In the Utah tests, the opening of the artesian borehole affected the artesian pressure head in an observation borehole 855 m distant in 7 min; the opening of another artesian borehole 1 155 m distant affected the head in the observation borehole in 57 min. In other tests, changes of pressure were transmitted a distance of 3.2 km in 3 to 13 h.
Flowing artesian boreholes in TMG aquifers
Fractured rocks in TMG aquifers, reconstructed by several phases of crustal movements from the Permian to the Creta-ceous , created various types of discontinuities in the form of joints, faults and unconformities. The largest fractures, that are associated with deep-seated tectonic movements in the Earth's crust, provide a route for large, deep-circulating volumes of groundwater under artesian pressure. In terms of the height of the pressure head, flowing artesian boreholes drilled into arte-sian TMG aquifers can be classified into 3 categories:
- Weak artesian: pressure head is below or slightly above the ground surface during or after wet season ( ~ 0 m).
- Medium artesian: pressure head ranges from 0 to 20 m. For instance, pressure head of an artesian borehole in Rawsonville is approximately 10 m.
- Strong artesian: pressure head is more than 20 m. For instance, the pressure heads of 2 artesian boreholes in Oudtshoorn are more than 45 m (UMVOTO, 2009). In such a case, the pressure head is usually measured by a pressure gauge.
A large portion of flowing artesian boreholes in the TMG area fall within the 'medium' or 'strong' artesian pressure catego-ries (Riemann and Hartnady, 2013; GEOSS, 2010). To evaluate artesian aquifer properties, free-flowing tests and recovery tests are often preferred over constant-rate pumping tests since no pump will be needed. During the tests, simultaneous flow rate and pressure head are measured over time. In terms of the flow rate and pressure changes, the whole aquifer test can be divided into 3 phases, as shown in Fig. 3:
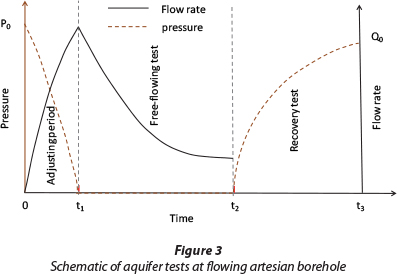
- Adjusting period: Once a flow breakout begins, the rate of the discharge will increase, while the pressure head drops to or near to ground surface rapidly. The duration is usually very short (0 ~t1).
- Free-flowing test period: Flow rate decreases rapidly at the beginning, but at a gradually diminishing rate, while the pressure head is zero or slightly above zero (t1 ~ t2).
- Recovery test period: When the valve is shut down, flow rate will become zero, and pressure head will start to rise in the borehole (t2 ~ t3).
It is often assumed that the duration of the adjusting period is negligible. Data for flow rate and pressure head during the latter two phases are deemed to be more valuable. As flow and pressure may drop very quickly during the first 1-2 hours of the free-flowing test, a hydraulic test device for accurate data collection is critical.
Development of the hydraulic test device
A hydraulic device was designed with the aim to measure the flow rate and pressure head simultaneously under the medium artesian condition. A portable ultrasonic flowmeter with flow velocity ranging from 0.01 to 32 m/s (flow rate can be calculated by using Q=πr2, where Q is flow rate, v the flow velocity, and r the radius of pipe), a pressure transmitter ranging from 0 to 160 kPa (pressure head of 0 ~ 16 m), and a data logger, were utilised to achieve the requirements. EC and pH meters are integrated with the device to measure the parameters of EC and pH. Two flow rate transducers of the flowmeter are mounted at the end of the pipe or casing where the groundwater comes out, while the pressure transmitter is linked to the pipe to measure the pressure of the aquifer. The configuration of the device and each component are displayed in Fig. 4.
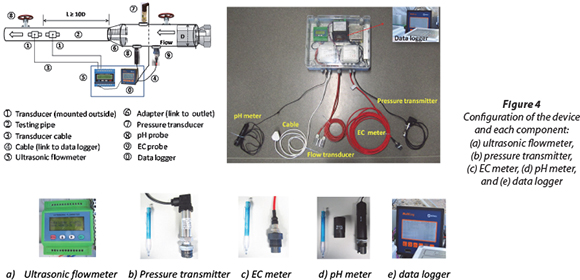
Technical parameters related to flow rate, pressure, pH and EC, as well as sampling interval, need to be set up and cali-brated by the flowmeter and data logger at the laboratory or at the borehole site, e.g., casing material, size of outer diameter, wall thickness of pipe, units and ranges. An external power supply is required. A sampling interval of 30 s, 1, 2 or 5 min is recommended, for a short-duration test; 10-, 20- or 30-min intervals are recommended for long-duration tests. The settings of units and ranges related to flow rate and pressure depend on the physical condition of the artesian borehole. For instance, ℓ/min is recommended as a unit for low flow rate condi-tions , while ℓ/s is recommended for a high flow rate situation. Kilopascals (kPa) are recommended as units of pressure, which can be converted to pressure head in meters using Eq. (1).
In order to enhance the accuracy of flow rate measurement, a procedure to set up the device is outlined as follows:
- Selection of a relative new straight pipe if possible. Old pipes tend to have corrosions and depositions, which may affect the results. The straight pipe should be long enough to eliminate irregular flow-induced error. The location of transducers should not be around the valve, outlet or a bend. Polishing the pipe outer surface with a sander is recommended if the pipe surface is not smooth.
- Determination of transducer spacing. Parameters of pipe materials, size of outer diameter, wall thickness of pipe and sampling interval need to be entered as data inputs to the flowmeter. The transducer spacing interval will be calcu-late d automatically and displayed on the screen.
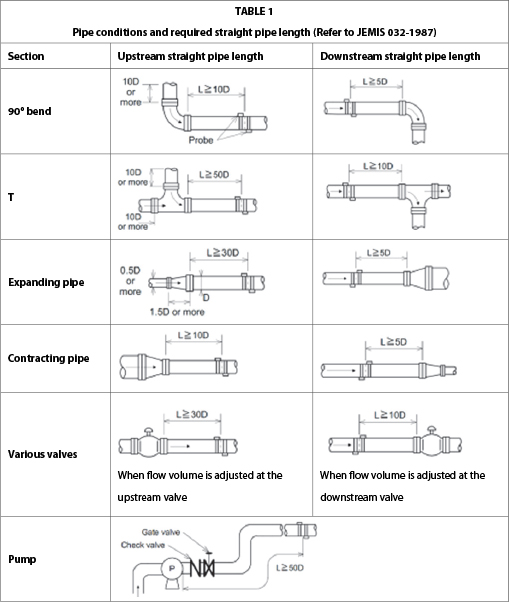
- Locate an optimal position where a sufficient length of straight pipe with no rust cover on the surface is available. The location of transducers should be set up according to JEMIS 032-1987 (Table 1). Apply adequate ultrasonic cou-plant (grease, gel or Vaseline) to the transducer surface as well as to the installation area on the pipe surface. Strap on the transducers according to the spacing interval and make sure that there is no gap between the transducer surface and the pipe surface.
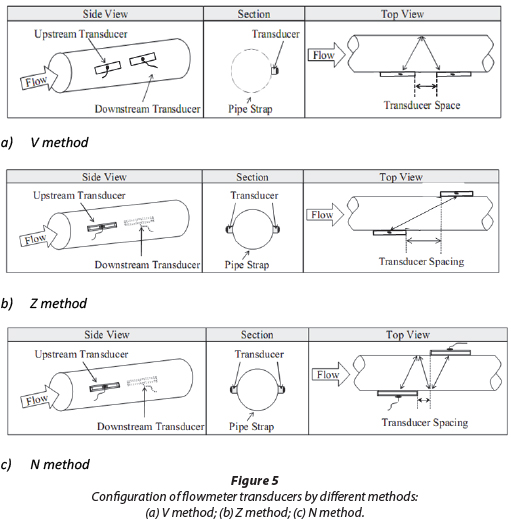
- Determination of transducer mount-ing method. Three transducer mount-ing methods are available, namely, V method, Z method and N method. The V method is primarily used on small pipes (DN 100~300 mm). The Z method is used in applications where the V method cannot work due to poor signal detec-tion . In addition, the Z method generally works better on larger diameter pipes (over DN 300 mm) or cast iron pipes. The N method is an uncommonly used method. It is used on smaller diameter pipes (below DN 50 mm). The configura-tions of transducers by each mounting method are shown in Fig. 5. Fine-tune the position of transducers until the best readings are obtained on the flowmeter for the triplet, signal strength, S, signal quality, Q, and transit-time ratio, R.
After set-up of the device on an artesian borehole and the required checks have been done, the free-flowing test can be carried out by fully opening the valve. Flow and pres-sure data will be measured and saved on data logger. Minor adjustments of transducer location may be needed to stabilise the signal received by the flowmeter.
CASE STUDY
To test the device, a flowing artesian bore-hole , BH-1, drilled in TMG aquifers on Gevonden farm, 6 km west of Rawsonville in the Western Cape Province of South Africa, was chosen as a case study. Borehole BH-1, which inclines to the west with a plunge of 60° was drilled to a depth of 250 m (270 m in length) with a radius of 0.07 m. This bore-hole penetrates through the bottom of the Nardouw Formation and Cedarberg (shale) Formation, tapping the top of the Peninsula Formation. The artesian flow of 0.15-0.3 ℓ/s was identified from 3 conductive zones dur-ing the drilling process, at a depth of 67.5 m, 95.3 m, and 213.0 m, respectively. A 179 m long steel casing was installed in the bottom of the Cedarberg shale to seal the former two conductive zones (Lin, 2007).
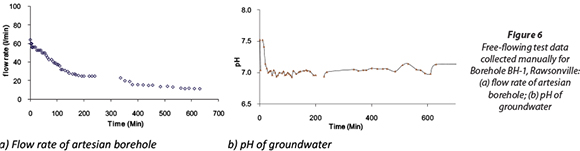
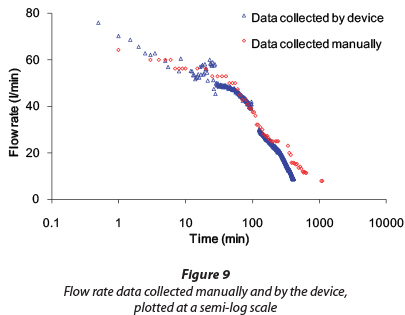
A first free-flowing test on Borehole BH-1 was conducted in March 2012, with data collected manually. The static pressure of the artesian aquifer was 94 kPa, which was about 9.6 m above ground surface. As soon as the valve was fully open, instantane-ous flow rate and pH data were measured using a 15 ℓ bucket, timer and pH meter. The sampling interval was 1 min at the begin-ning , and 10 min later on. Due to the fact that initial flow rate from the borehole was high (> 60 ℓ/min), the pressure of the aquifer was maintained at 40 kPa by adjusting the valve manually during the test. Therefore, the constant-drawdown was approximately 5.5 m. The measure-ments for flow and pH are shown in Fig. 6.
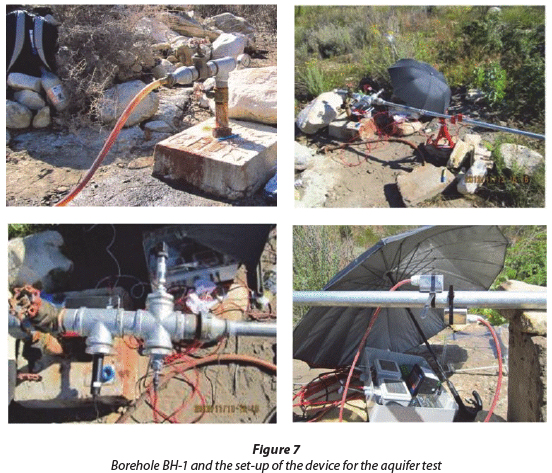
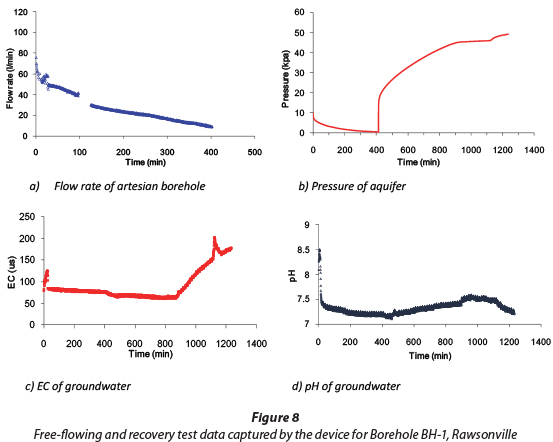
A second free-flowing test on Bore-hole BH-1 was conducted in November 2012, with flow and pressure data captured by the device. A stainless pipe with diameter of 25 mm was linked to the borehole casing to ensure the pipe fully filled with water. A pressure transmitter was attached to the pipe for recording the pressure, while the flow transducers were mounted outside the smaller pipe to measure the flow rate (Fig. 7). Parameters including pipe material, outer diameter and thickness of pipe were entered as data inputs to the flowmeter with the power supplied by a generator at the site. The location of transducers was set up using the N mounting method due to the small diameter of the pipe. The free-flowing test involved allowing groundwater to flow freely under artesian conditions for approximately 7 h, followed by a recov-ery test for 13 h. The static pressure head was 7.53 m above the ground surface. Measurements of flow rate, pressure, EC and pH were taken during the tests. Due to a technical problem, there was a short-duration data gap which occurred at around 100 min for 20 min. Data capture continued after the problem was solved. The results are shown in Fig. 8.
RESULTS AND DISCUSSION
Flow rate comparison
Flow data collected manually and by the device (Fig. 6a and Fig. 8a) were plotted in a semi-log plot shown in Fig. 9. It is clear that the data captured by the device shows a similar trend to data collected manually. The flow rate decreased slowly in the first 100 min, while it decreased sharply at a later stage. The pH values at an early stage, shown in Fig. 6 and Fig. 8, prove the presence of unpurged water in the pipe, while the pH and EC data captured during the recovery test (Fig. 8) indicate the possibly unstable groundwater quality.
sw/Q comparison
A classic method for determining hydraulic properties of arte-sian aquifers was developed by Jacob and Lohman (1952). The proposed equation is solved graphically on a semi-logarithmic grid by plotting values for the ratio of constant-drawdown to discharge (s w /Q) on the linear scale against corresponding values of time (t) on the logarithmic scale, and then calculating T and S values using the slope for one log cycle of t based on the assumption that the artesian aquifer is homogeneous and isotropic. Theoretically, even though the aquifer may not be homogeneous or isotropic, the sw /Q values calculated using data captured by the device and collected manually should show the same trend at semi-log scale, corresponding to each log cycle of time. The calculated sw /Q values from the case study are plotted at a semi-log scale in Fig. 10.
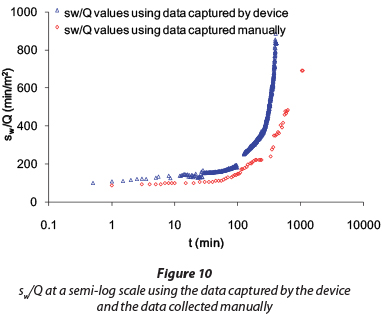
It is noted that even though the two aquifer tests at Borehole BH-1 were conducted under different pressure head conditions, the results from both tests (Fig. 9 and Fig. 10) imply that the flow and pressure data captured by the device are accurate and reliable, and can aid considerably in determin-ing aquifer properties (see sw /Q values in Fig. 10, particularly). However, as the pressure in the aquifer rises very quickly at the beginning of the recovery test, taking pressure readings using a pressure gauge can be problematic; therefore no results were collected manually for the recovery test at Borehole BH-1.
The advantages of the device described include: (i) it is simple to use and portable; (ii) data captured is accurate and reliable; (iii) it can accommodate high flow rates (pressure heads) as well as low flow rates (pressure heads); and (iv) it is cost effective to purchase and use, in comparison with conven-tional methods of data collection for aquifer tests - no pump is needed, and it is less labour intensive. The shortcomings of the device which need to be solved in the future include: (i) require-ment for a power supply; and (ii) sensitivity of the ultrasonic flowmeter to signal strength.
The problem of needing an external power supply can be solved by including a lithium-ion battery or solar panels in the device, and the sensitivity issue can be addressed through cau-tious adjustment of the location of the flowmeter transducers.
The data captured by the device can be used to evaluate artesian aquifer properties such as transmissivity (T) and stor-age coefficient (S) in TMG aquifers using proper pumping test models such as the Jacob-Lohman method (Jacob and Lohman, 1952; Lohman, 1979), a discussion of which is beyond the scope of this paper.
CONCLUSIONS
A hydraulic test device for free-flowing artesian boreholes was conceptualised and developed, and applied in the TMG aquifers. The test device, designed to measure the flow rate and pressure head simultaneously during the aquifer test, was dem-onstrated for the medium artesian condition. The flow rates captured by the device at a flowing artesian hole in Rawsonville were reliable and accurate compared with the data collected manually on the same borehole, and were utilised to estimate the aquifer properties.
In addition to the flow and pressure data, EC and pH read-ings captured by the device may be used to indicate the possible changes of flow regime and groundwater quality. It is recom-mended that the measurements of the quality indicators be used to verify the testing conditions.
About 30% of boreholes in the TMG aquifers are artesian in nature. The device presented in this paper would be valuable for wide application to the artesian TMG aquifers. With due improvement of the test device, its wider application in similar conditions, such as the artesian holes in the Karoo, would be expected in future.
ACKNOWLEDGEMENTS
The authors would like to acknowledge Water Research Commission (WRC) of South Africa for funding the project (K5/2058), and two anonymous reviewers for their very helpful comments and recommendations.
REFERENCES
DOMENICO PA and SCHWARTZ FW (1998) Physical and Chemical Hydrogeology (2nd edn.) John Wiley & Sons, New York. 47 pp. [ Links ]
FREEZE RA and CHERRY JA (1979) Groundwater. Prentice-Hall, Englewood Cliffs. 49 pp. [ Links ]
GEOSS (2010) TMGA exploratory phase monitoring. Final Report -Volume B. GEOSS, Cape Town. 179 pp. [ Links ]
JACOB CE and LOHMAN SW (1952) Nonsteady flow to a well of con-stant drawdown in an extensive aquifer. Trans. AGU 33 (4) 559-569. [ Links ]
LEGGETTE RM and TAYLOR GH (1934) The transmission of pressure in artesian aquifer. Am. Geophys. Union Trans. 15 409-413. [ Links ]
LIN L (2007) Hydraulic properties of the Table Mountain Group (TMG) Aquifers. PhD thesis, University of the Western Cape. [ Links ]
LOHMAN SW (1965) Geology and artesian water supply of the Ground Junction area, Colorado. USGS Professional Paper 451. United States Geological Survey, Washington. 149 pp. [ Links ]
LOHMAN SW (1979) Ground-water hydraulics. USGS Professional Paper 708. United States Geological Survey, Washington. 70 pp. [ Links ]
MEINZER OE and HARD HA (1925) Artesian-water supply of the Dakota sandstone in North Dakota, with special reference to the Edgeley quadrangle. USGS Water-Supply Paper. 520-E 73-95. United States Geological Survey, Washington. 95 pp. [ Links ]
MEINZER OE (1928) Compressibility and elasticity of artesian aqui-fers . Econ. Geol. 23 (3) 263-291. [ Links ]
OBERLANDER PL and ALMY RB (1979) Aquifer test report for Stage Gulch Ranch Well No. 3. Unpublished report. Oregon Water Resources Department, Stanfield. 46 pp. [ Links ]
RIEMANN K and HARTNADY CJ (2013) Hydraulic tests of strong artesian boreholes; wellhead construction and test design. Umvoto Africa. URL: http://gwd.org.za/sites/gwd.org.za/files/04%20K%20Riemann Artesian%20Wellhead%20Design Paper.pdf (Assessed 10 March 2014). [ Links ]
THOMPSON DG (1929) The origin of artesian pressure. Econ. Geol. 24(7) 758-771. [ Links ]
UMVOTO (2009) Deep artesian groundwater for Oudtshoorn Municipal Supply (DAGEOS) - Monitoring Report. 2008-2009 Update.603/E.7.4-5/2009. Umvoto, Cape Town. 48 pp. [ Links ]
WEIGHT WD (2008) Hydrogeology Field Manual (2nd edn.) McGraw Hill, New York. 114 pp. [ Links ]
WENZEL LK (1936) The Thiem method for determining permeability of water-bearing materials and its application to the determina-tion of specific yield, results of investigations in the Platte River Valley, Nebr. USGS Water-Supply Paper 679-A 1-57. United States Geological Survey, Washington. 57 pp. [ Links ]
WYRICK GG and FLOYD EO (1961) Microtime measurements in aquifer tests on open-hole artesian wells. USGS Water-Supply Paper 1545-A 1-11. United States Geological Survey, Washington. 11 pp. [ Links ]
Received 22 October 2013
Accepted in revised form 10 June 2014.
* To whom all correspondence should be addressed. +27 21 959-3882; Fax: +27 21 959-3118; e-mail: yxu@uwc.ac.za

