


Serviços Personalizados
Artigo
 Inglês (pdf)
 Artigo em XML
 Referências do artigo
Indicadores

Links relacionados
-
 Citado por Google
 -
 Similares em Google
Compartilhar

 Permalink
Water SA
versão On-line ISSN 1816-7950
versão impressa ISSN 0378-4738
Water SA vol.40 no.3 Pretoria Jun. 2014
TECHNICAL NOTE
Speeding up stochastic analysis of bulk water supply systems using a compression heuristic
Ching-Chiao Chang; Jakobus E van Zyl
Department of Civil Engineering, University of Cape Town, Private Bag X3, Rondebosch, 7701, South Africa
ABSTRACT
It is possible to analyse the reliability of municipal storage tanks through stochastic analysis, in which the user demand, fire water demand and pipe failures are simulated using Monte Carlo analysis. While this technique could in principle be used to find the optimal size of a municipal storage tank, in practice the high computational cost of stochastic analyses made this impractical. The purpose of this study was to develop a compression heuristic technique to speed up the stochastic analysis simulations. The compression heuristic uses a pre-run to characterise the failure behaviour of a tank under demand-only conditions, and the stochastic simulations are then only run for periods in which fire demand or pipe failures affect the tank. The compression heuristic method was found to be accurate to within 5% of the full stochastic analysis method. The compression heuristic was also found to be faster than the full stochastic method when more than 27 systems were analysed, and thus allowed genetic algorithm optimisation to be practical by reducing the optimisation simulation time by 75%.
Keywords: stochastic analysis; Monte Carlo; optimisation; genetic algorithm; reliability
INTRODUCTION
Stochastic analysis is a technique whereby the deterministic and probabilistic parameters of a system are simulated to model its behaviour more accurately. Stochastic modelling is often used to analyse complex systems in which risk and uncertainty are significant, and where components are subject to stochastic failures (Yang et al., 1996). This technique is relatively new to water distribution systems, even though it has long been used in fields like hydrology (Thomson et al. 1997; Cui and Kuczera, 2003). Work on the application of stochastic analysis to water distribution systems has been done by Wagner et al. (1988), Yang et al. (1996), and Ostfeld et al. (2001).
Nel (1996) first applied stochastic analysis to estimate the reliability of municipal storage tanks. This work was later expanded by Van Zyl et al. (2008), where stochastic analysis was used to determine the failure characteristics of a tank in a bulk water supply system, which in turn is used as a measure of the bulk system's reliability. Van Zyl et al. (2008) proposed a criterion of 1 failure in 10 years at the most critical time of the year as the basis for sizing municipal storage tanks. Further work has been done to explore the effect of different user demand parameters on the reliability of bulk water supply systems (Van Zyl et al., 2012), as well as investigating the financial benefits of designing systems based on reliability criteria rather than design guidelines (Vlok, 2010).
In a recent study (Chang and Van Zyl, 2012), stochastic analysis was used in combination with genetic algorithms to optimise the design of bulk water supply systems. The optimisation variables were the storage tank capacity, feeder pipe configuration and feeder pipe diameter. Genetic algorithms require a large number of system evaluations, each of which required stochastic analyses of the system to be conducted. Due to the high computation cost associated with stochastic analysis, this work would not have been practically possible without speeding up the stochastic analysis substantially, while retaining acceptable levels of accuracy. The aim of this paper is to describe the development, testing and application of the compression heuristic method used to achieve this aim. The motivation for using a compression heuristic is provided first, followed by a description of the method. The simulation times and accuracy of the compression heuristic are then compared to the full stochastic analysis.
STOCHASTIC ANALYSIS MODEL
The stochastic analysis model presented by Van Zyl et al. (2008) uses reliability criteria for site-specific sizing of a storage tank in a bulk supply system. The reliabilities of different tank sizes are determined by simulating the system for an extended period of time (typically 10 000 years) in hourly intervals. Consumer demand, fire water demand and pipe failure states are estimated for each time step based on stochastic unit models. A failure is recorded whenever a tank runs dry, and the tank failure frequency is used as a measure of the tank reliability.
Unit models for calculating consumer demand, fire water demand and pipe failure events are summarised below, but more details can be found in Van Zyl et al. (2008)
Consumer demand was calculated in 2 steps, the first to determine the average daily demand and the second to calculate the hourly demands. Both steps included an average demand, day-of-week or hourly pattern, persistence (autocorrelation) and a random component.
The fire demand model considered 3 generic components: occurrence, duration and fire flow. The times between successive fires events were modelled using an exponential distribution, and both fire duration and demand were estimated with lognormal distributions.
The pipe failure model consisted of 2 generic components: occurrence and duration. An exponential model was used to model the times between pipe failure events, and a lognormal distribution to model the failure duration.
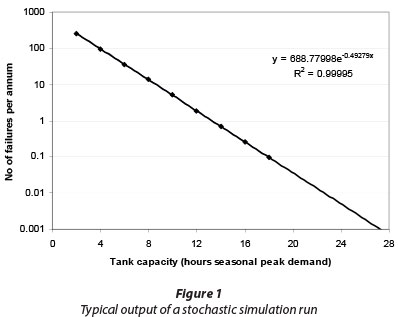
Typical results of a stochastic analysis simulation for a bulk supply system (showing the tank failure frequency against tank capacity) is shown in Fig. 1. From this relationship, the required tank size can be estimated based on an acceptable level of reliability.
COMPRESSION HEURISTIC
The motivation for the development of a compression heuristic method to speed up stochastic simulations was the observation that most computational effort is used to simulate the system in the absence of fire or pipe failure events (see Fig. 2(a)), and thus with consumer demand only. In addition, while fire and pipe failure events occur infrequently, they play an important role in most tank failure events. By characterising tank behaviour for demands only in a pre-run, these periods could be removed from the stochastic analysis run. In the main simulation run, referred to as the events run, only the critical periods in which fire or pipe failure events occurred are simulated as shown in Fig. 2(b).
An earlier compression heuristic was applied to the study of urban water resources and drought (Cui and Kuczera, 2009), which was aimed at improving Monte Carlo simulation for urban headworks systems that typically have high reliability. Failures of water distribution system reservoirs are more frequent, and thus this study had to estimate failure rates in non-critical periods too.
Before implementing the compression heuristic in this study, Latin Hypercube sampling (McKay et al., 1979) was implemented, but was found not to decrease the duration of stochastic simulations. Reasons for this may be the extra computational effort or the fact that only one-dimensional Latin Hypercube samples were required in this study as opposed to multi-dimensional Latin Hypercube samples often used in simulations in which it decreases the simulation duration.
Pre-run
Method
The purpose of the pre-run is to characterise the tank failure behaviour resulting from consumer demand only. From the pre-run results, the demand failures can be estimated for periods in which there are no events in the events run. The consumer demand model is used to find the hourly demand for each time step, which is then used to update the tank level. If the tank level drops to zero, a failure is recorded, lasting until the tank has a net inflow again. The number of failures and the mean and standard deviations of the time-to-failure (TTF) are recorded and used to determine the convergence of the failure results and the end of the pre-run.
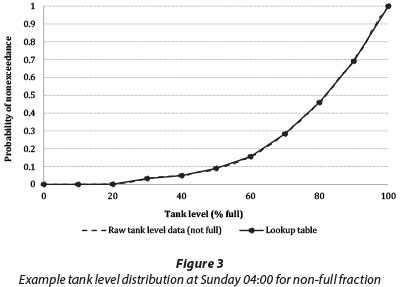
Another function of the pre-run is to generate a lookup table of the tank level distribution at a given time in the simulation week. In this study the tank level was estimated on Sunday mornings at 4:00, since this was assumed to be the most likely time for the tank to be full. The events run always starts simulating an event at 4:00 on a Sunday preceding a fire or pipe failure event, and the tank level lookup table is required to randomly initialise the tank level.
The tank level distribution curve was modelled by first recording the fraction of time the tank is full, and secondly the distribution of the tank level for the fraction when the tank was not full in 10 bins. Figure 3 shows a typical distribution for the non-full fraction of the tank level for all the data and when estimating it with a lookup table using 10 bins. In this example, the tank had a probability of being full 47% of the time.
Termination conditions
Except for a user-defined simulation duration, 2 alternate termination conditions were defined for the pre-run. In the first condition, the simulation was terminated when the average tank failure rate was estimated with an error of less than 5% at a confidence level of 95%, thus:
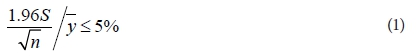
where:
n is the number of failures recorded
y is the sample mean
S is the standard deviation
This criterion worked well for systems with larger failure frequencies, as it relies on a certain number of failures to be generated. However, in systems that are very reliable under demand-only conditions, it may take an exceedingly long pre-run to generate enough failures to meet the first criterion, and thus an alternative terminating condition was required. The second termination condition is activated when the results show that the upper confidence level of the tank's failure frequency is assuredly lower (using a 95% confidence interval) than a user-defined value. This was defined in terms of the average time between failure events as follows:
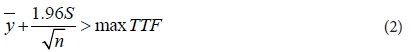
where:
y is the mean time-to-failure
S is the time-to-failure standard deviation
n is the number of failures max TTF is the user-defined maximum time-to-failure.
Since a reliability criterion of less than 1 failure in 10 years under seasonal peak conditions was used in the study by Van Zyl et al. (2008), it was considered reasonable to use a cut-off probability of 1 in 100 years in this study.
An additional termination condition based on convergence of the tank level distribution was also considered, but it was found that convergence of the tank level distribution was faster and of less importance than the failure frequency parameter. This condition was therefore excluded.
Representing pre-run results
Since tank size and feeder pipe capacity were both criteria in the optimisation study, it was necessary to do the pre-run for a matrix of supply ratios (feeder pipe capacity / average user demand) and tank sizes. It was found that an exponential function provides a suitable description of the relationship between tank size and failure frequency (refer to Fig. 1), and such a curve was determined for a discretised range of supply ratios. Values for intermediate supply ratios were determined through linear interpolation.
Events run
The events run estimates the failure behaviour of a given combination of feeder pipe configuration, feeder pipe capacity (or supply ratio) and tank capacity. Firstly the system parameters (demand failure frequency, full fraction of the tank, and tank level lookup table) are initialised based on the pre-run results. The time of occurrence of the first fire or pipe failure event is estimated and the simulation 'jumps' to the start of the week (i.e. Sunday at 4:00) in which it occurs. The simulation is then run and tank failures recorded.
Three simultaneous conditions were used for deciding when the simulation can 'jump' to the next event:
- The simulation of a given event must end at 4:00 on a Sunday before jumping to the next event. This ensures that no days are 'lost' between the events and pre-run.
- The fire and/or pipe failure event must have ended.
- The tank must have filled up completely after the end of the last event that occurred. This condition ensures that any residual impact an event may have on the tank level is fully simulated.
The termination conditions applied to the events run are the same as those used for the pre-run. Once the events run has been completed, the number of tank failures recorded is combined with the number of tank failures estimated from the pre-run for the periods jumped over, to get the final failure frequency of the tank.
RESULTS
To ensure that the compression heuristic allows stochastic analysis to be incorporated into a genetic algorithm optimisation routine, it has to deliver adequate accuracy and a significant reduction in simulation time. In this section, a description of the optimisation problem is provided, the accuracy of the compression heuristic is evaluated, and then its simulation time is compared to that of the full stochastic analysis.
Optimisation problem
The aim of the genetic algorithm optimisation routine was to find Pareto-optimal solutions that could be used in the design of bulk water supply systems. The solutions were presented in the form of trade-off curves of cost against failure frequency (assessed through the stochastic analysis model). Whereas consumer demand, fire and pipe failure events are beyond the control of the designer, it is possible to control the pipe configuration and diameter of the supply pipe system, as well as the capacity of the storage tank. These three aspects of the design were used as the decision variables in the optimisation routine.
Accuracy
To test the accuracy of the compression heuristic to that of the full stochastic analysis, both methods were applied to a simple, but typical, example of a bulk water supply system used in Van Zyl et al. (2008) and shown in Fig. 4.
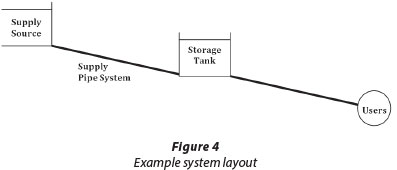
The example system consisted of a source connected to a storage tank through a feeder pipe system. Users are served from the storage tank only. The system was analysed at the most critical time of the year, i.e., under seasonal peak conditions. The demand model of the system was based on 3 small towns in France and the demand pattern had a seasonal peak factor of 1.49. A fire frequency of 6 fires-a-1 and pipe failure rate of 0.2 failures-km-1-a-1 were assumed. Four variations of the system were created by combining small and large supply ratios (1.2 and 1.5) and tank sizes (3 h and 12 h seasonal peak demand).
The full stochastic analysis and compression heuristic were each run 10 times on each network using different random seeds. The average and standard deviation of the failure frequency for both methods were then determined. The accuracy requirement set for the compression heuristic was to provide accurate and reproducible results for the tank failure frequency within 5% of those calculated with the full stochastic analysis.
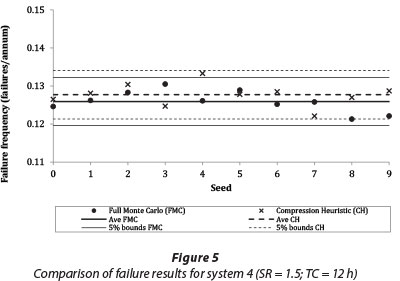
As a typical example, one of the systems analysed had a supply ratio of 1.5 and tank capacity of 12 h, which represents a fairly reliable system. The simulation results of 10 random seeds for the full stochastic analysis and compression heuristic methods are compared in Fig. 5. The average failure frequency obtained using the compression heuristic is 0.1277 failures-a-1, which is within 1.4% of the full Monte Carlo method (0.1259 failures-a-1). The variability in the results is very similar with standard deviations of 0.0028 and 0.0030 failures-a-1 for the full stochastic analysis and compression heuristic methods, respectively.
A similar comparison of the average and standard deviation of the failure frequency for the compression heuristic and full Monte Carlo was made for the other systems. The results of all the systems analysed are summarised in Table 1. It is evident that the average failure frequency results produced by the compression heuristic are very similar to those of the full Monte Carlo. The compression heuristic also appears to produce less variability in results.
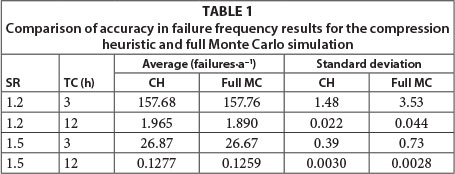
In summary, all four systems analysed demonstrated that the compression results are suitably close to those of the full stochastic analysis, with the average value consistently falling within the 5% bounds of the average failure frequency for the full stochastic analysis method.
Simulation time
For all four systems tested individually in the previous section, the total simulation time of the compression heuristic (combined times for the pre-run and the events run) was longer than the full stochastic analysis method for a single simulation. This is due to the computational overheads and additional simulation steps performed when both the pre- and event runs were done.
However, since the compression heuristic only required 1 pre-run for any number of event runs on the same system, it was able to outperform the full stochastic analysis when multiple simulations were required (as in the case of the genetic algorithm optimisation).
In order to examine the improvement in speed achieved by the compression heuristic over the full stochastic analysis method, the methods were applied to an increasing number of simulations from 10 up to 100. To include variation in the system, the supply ratios and tank capacities of the systems were randomly selected between ranges of 1 to 2 and 4 h to 24 h of seasonal peak demand, respectively.
The pre-run in the compression heuristic was simulated for a set of 6 supply ratios (1.0, 1.2, 1.4, 1.6, 1.8 and 2.0) and 6 tank capacities (4, 8, 12, 16, 20 and 24 h of seasonal peak demand). The simulation time for the pre-run for all 36 systems was found to be 2.6 h (9 411 s). The simulation time for the event runs was then measured and added to the pre-run time to get the full time required for the compression heuristic simulations. The results were compared to that measured for the full stochastic analysis runs as shown in Table 2 and Fig. 6.
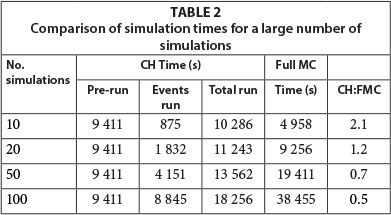
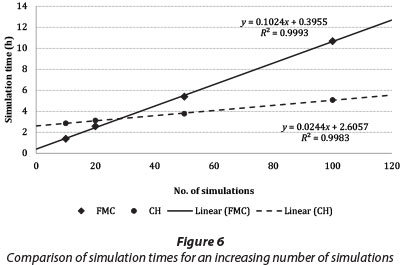
Both methods show a linear increase in simulation time with the number of systems analysed, but the slope of the compression heuristic is significantly smaller than that of the full stochastic analysis method, resulting in the compression heuristic requiring less time if more than 27 systems are evaluated. This shows that the compression heuristic is capable of reducing the computational time required for the full Monte Carlo method for a large number of evaluations.
The benefit of using the compression heuristic was clearly demonstrated in its application within a genetic algorithm optimisation routine where up to 2 550 reliability evaluations are conducted for 50 generations for a population of 50 solutions. Optimisation of the bulk system could take up to 269 h on a 2.66 GHz Intel Core 2 Quad processor using the full stochastic analysis method as presented by Van Zyl et al. (2008), whereas the compression heuristic reduces the simulation time by 75% to approximately 66 h. This allowed stochastic analysis to be successfully incorporated in a genetic algorithm optimisation study (Chang and Van Zyl, 2012)
CONCLUSIONS
The aim of this study was to increase the computational speed of the stochastic simulation of bulk water supply systems using a compression heuristic. This was necessary in order to allow stochastic analyses to be incorporated into a genetic algorithm optimisation study of bulk water supply systems. The compression heuristic increases the speed of the simulation by fully modelling only the most critical periods, i.e., those during which fire or pipe failure events occur, while 'skipping over' the intermediate periods. During the intermediate periods, which often make up the majority of time, only user demand affects the reliability of the system. The system's behaviour under these conditions is characterised using a pre-run, and this is used to update the results for the periods jumped over.
The accuracy and simulation time of the compression heuristic were compared to those of the full stochastic analysis model. The results showed that the compression heuristic was able to estimate the system's failure rate to within 5% of the full stochastic model. Due to the computational overheads associated with the pre-run, the compression heuristic required more simulation time than the full stochastic simulation for a small numbers of runs. However, the compression heuristic was found to be faster after 27 simulation runs for a sample system, and substantially faster when large numbers of simulations were conducted. For the genetic algorithm optimisation of a typical bulk water supply system, it was found that the compression heuristic reduced the computational time by 75%.
REFERENCES
CHANG C (2012) Optimal reliability-based design of bulk water supply systems. MSc dissertation, University of Cape Town. [ Links ]
CHANG C and VAN ZYL JE (2012) Optimal reliability-based design of bulk water supply systems. ASCE J. Water Resour. Plann. Manage. DOI: 10.1061/(ASCE)WR.1943-5452.0000296. [ Links ]
CUI L and KUCZERA G (2003) Optimizing urban water supply head-works using probabilistic search methods. J. Water Resour. Plann. Manag. 129 (5) 380-387. [ Links ]
DEB K, PRATAP A, AGARWAL S and MEYARIVAN T (2002) A fast and elitist multiobjective genetic algorithm: NSGA-II. IEEE Trans. Evol. Comput. 6 (2) 182-197. [ Links ]
McKAY MD, BECKMAN RJ and CONOVER WJ (1979) A comparison of three methods for selecting input variables in the analysis of output from a computer code. Technometrics 21 (2) 239-245. [ Links ]
NEL D and HAARHOFF J (1996) Sizing municipal water storage tanks with Monte Carlo simulation. Aqua 45 (4) 203-212. [ Links ]
NEL DT (2009) Factors that may compromise bulk water distribution reliability. PhD thesis, University of Johannesburg. [ Links ]
OSTFELD A, KOGAN D and SHAMIR U (2001) Reliability simulation of water distribution systems - single and multiquality. Urban Water 4 53-61. [ Links ]
THOMPSON KD, STEDINGER JR and HEATH DC (1997) Evaluation and presentation of dam failure and flood risks. J. Water Resour. Plann. Manag. 123 (4) 216-227. [ Links ]
VAN ZYL JE, PILLER O and LE GAT Y (2008) Sizing municipal storage tanks based on reliability criteria. J. Water Resour. Plann. Manag. 134(6) 548-555. [ Links ]
VAN ZYL JE, LE GAT Y, PILLER O and WALSKI TM (2012) Impact of water demand parameters on the reliability of municipal storage tanks. J. Water Resour. Plann. Manag. [ Links ] 138 (5) 553-561.
VLOK G (2010) Optimal risk-based design of bulk water supply systems. MSc dissertation, University of Cape Town. [ Links ]
WAGNER MJ, SHAMIR U and MARKS DH (1988) Water distribution reliability: simulation methods. J. Water Resour. Plann. Manag. 114 (3) 276-294. [ Links ]
YANG S, HSU N, LOUIE PWF and YEH W (1996) Water distribution network reliability: Stochastic simulation. J. Infrastructure Syst. 2 (2) 65-72. [ Links ]
 Correspondence:
Ching-Chiao Chang
+27 83 789 4466; fax: +27 86 267 3764
e-mail: alice.chang@aurecongroup.com
Received 22 October 2013
Accepted in revised form 2 May 2014.

