


Services on Demand
Article
 English (pdf)
 Article in xml format
 Article references
Indicators

Related links
-
 Cited by Google
 -
 Similars in Google
Share

 Permalink
Water SA
On-line version ISSN 1816-7950
Print version ISSN 0378-4738
Water SA vol.40 n.2 Pretoria Apr. 2014
TECHNICAL NOTE
Class frequency distribution for a surface raw water quality index in the Vaal Basin
Bloodless DzwairoI; Fredrick AO OtienoII
IDurban University of Technology, Institute for Water and Wastewater Technology, PO Box 1334,4000, South Africa
IIDurban University of Technology, DVC: Technology, Innovation and Partnerships, PO Box 1334,4000, South Africa
ABSTRACT
A harmonised in-stream water quality guideline was constructed to develop a water quality index for the Upper and Middle Vaal Water Management Areas, in the Vaal basin of South Africa. The study area consisted of 12 water quality monitoring points; V1, S1, B1, S4, K9, T1, R2, L1, V7, V9, V12, and V17. These points are part of a Water Board's extensive catchment monitoring network but were re-labelled for this paper. The harmonised guideline was made up of 5 classes for NH4+ Cl-, EC, DO, pH, F-, NO3-, PO43- and SO42- against in-stream water quality objectives for ideal catchment background limits. Ideal catchment background values for Vaal Dam sub-catchment represented Class 1 (best quality water), while those for Vaal Barrage, Blesbok/Suikerbosrand Rivers and Klip River represented Classes 2, 3 and 4, respectively. Values above those of Klip River ideal catchment background represented Class 5. For each monitoring point, secondary raw data for the 9 parameters were cubic-interpolated to 2 526 days from 1 January 2003 to 30 November 2009 (7 years). The IF-THEN-ELSE function then sub-classified the data from 1 to 5 while the daily index was calculated as a median of that day's sub-classes. Histograms were constructed in order to distribute the indices among the 5 classes of the harmonised guideline. Points V1 and S1 were ranked as best quality water (Class 1), with percentage class frequencies of 91% and 60%, respectively. L1 ranked Class 3 (34%) while V7 (54%), V9 (53%), V12 (66%) and V17 (46%) ranked poorly as Class 4. B1 (76%), S4 (53%), K9 (41%), T1 (53%) and R2 (61%) ranked as worst quality (Class 5). The harmonised in-stream water quality guideline resulted in class frequency distributions. The surface raw water quality index system managed to compare quality variation among the 12 points which were located in different sub-catchments of the study area. These results provided a basis to trade pollution among upstream-downstream users, over a timeframe of 7 years. Models could consequently be developed to reflect, for example, quality-sensitive differential tariffs, among other index uses. The indices could also be incorporated into potable water treatment cost models in order for the costs to reflect raw water quality variability.
Keywords: class frequency distribution; cubic interpolation; harmonised in-stream water quality guideline; ideal catchment background; Vaal basin; water quality index
INTRODUCTION
Understanding complex systems involves constructing models, comparing their predictions with observations and improving them by using feedback mechanisms from continuous assessments (Even et al., 2007). For water quality management purposes, assessments are done based on the prevailing guidelines. This approach assumes that proper identification of contamination sources for individual parameters that are assessed can be done to provide a basis for environmental and legal compliance. However, the approach does not readily offer a holistic view of the spatial and temporal trends in water quality expressed in a single value, especially for catchments that are perturbed by various pollutant types. More importantly, options for restoring heavily degraded catchments are limited, hence assessment tools that are supported by robust water quality data should be continuously developed (Bohensky, 2008).
Limitations, though, exist where compliance with water quality objectives proves to be prohibitively expensive or technically impossible (Mey and van Niekerk, 2009). Further, even in catchments where data are aligned with specific sampling objectives, data for a required parameter, for example, might be unavailable, rendering the dataset inadequate for use with a specific water quality index (WQI). Yet indices are expected to provide simplified interpretation of results since in their various forms they summarise, in one value or concept, a series of parameters (Abrahao et al., 2007; Couillard and Lefebvre, 1985; DWAF, 1996). This is desirable, especially in cases where decisions require interpretation of the severity or extent of pollution impacts.
An index can be limited if it requires data of longer duration than is available (most models are done with retrospective data). In addition, a model can predefine its input parameters or even the number of input parameters, both of which might not be available. Further, if a model requires a subjective constant that relates to a particular water body at a specific time of sampling, but which was not captured then, it renders the historical dataset inadequate for use with that model (Abrahao et al., 2007; Pesce and Wunderlin, 2000). Thus many indices have been developed since the first index was suggested by Horton (1965), to try to satisfy various conditions within ecological system boundaries, which constantly shift in time and space. As at 1985 more than 100 scientists had already developed indices for specific water-related settings (Couillard and Lefebvre, 1985). Some of the indices were based on statistical or planning approaches while others represented trophic states of specific ecosystems. Some researchers have gone a step further and adapted indices that were developed for specific environments, for example the salinity index which is mainly used in agriculture and soil applications (Katerji et al., 2000; Slavich et al., 1999), for water quality trending, in order to satisfy specific objectives (Bohensky, 2008; DWAF, 2007; Mey and van Niekerk, 2009).
Apart from WQI limitations, another challenge regards choosing those parameters which are most significant to describe aspects of spatial and temporal quality variations. According to Abrahao et al. (2007), these parameters should provide an indication of the evolutionary tendency of quality as it evolved over time, in addition to allowing for comparison between different watercourses or different locations along the same watercourse. Some indices use fixed numbers and specific input variables because they were objectively designed for comparison using some specific expert opinion. Examples are indices by Horton (1965) which uses 10 parameters, Dunnette (1979) which uses 6, and Brown et al. (1970) which uses 9, among many others. In the end, an index should still provide a simple way of representing information by using a simple quality numerical value (Couillard and Lefebvre, 1985). Where costs and other challenges may limit water quality evaluation, selection of a streamlined list of the most appropriate quality parameters is, however, fundamental (Abrahao et al., 2007).
A WQI that is based on parameters which represent the broader pollution sources is a vital tool for assessing a water body's spatial and temporal quality trends within a boundary system which spans different sub-catchments. In South Africa, Wepener et al. (2006) documented an extensive literature review of water quality indices. The research highlighted 2 pre-requisites for useful water quality indices; that they should be readily derived from available monitoring data and that they should impart an understanding of the significance of the data represented. The data should preferably be of long duration to minimise short-term ecosystem noise and should produce new knowledge from old data (Hawkins et al., 2013). It is therefore expected that results from this paper will, for example, if applied in raw water pricing structures, provide equity on tariffs among surface raw water users, in addition to incorporating a water quality variability factor when modelling potable water treatment costs. The actual application of the models is beyond the scope of this paper.
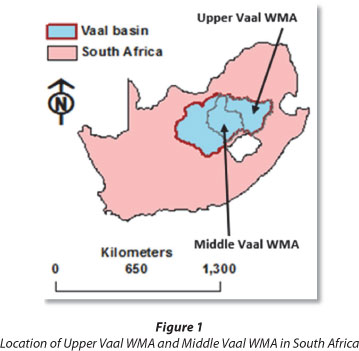
The focus of this study was to model and compare pollution trends in the Upper and Middle Vaal Water Management Areas (WMAs) of South Africa (Fig. 1).
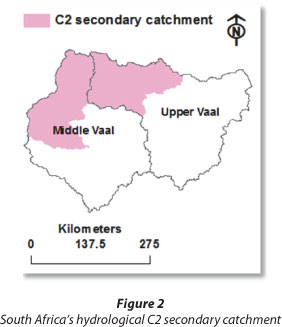
The upper parts of both WMAs are covered by the hydro-logical C2 secondary catchment (Fig. 2), the significance of which is explained later.
Historical (retrospective) data from 1 January 2003 to 30 November 2009 and for parameters NH4+ Cl-, EC, DO, pH, F-, NO3-, PO43- and SO42-, were used. The parameters were selected after a series of data reduction and manipulation operations to reflect, among other attributes, the major sources of pollution in the study area (Dzwairo, 2011), in addition to the availability of a consistent dataset.
The study area consisted of 12 surface raw water quality monitoring points with the aim of fulfilling 3 objectives. The first objective was to construct a harmonised in-stream water quality guideline (HIWQG) by combining guideline values for the 2 water management areas (Upper and Middle Vaal) to create 5 classes. At the time of writing this paper, in-stream water quality objectives (IWQOs), which various stakeholders use as guidelines for pollution trending, had different values for specific sub-catchments located within the two WMAs (Rand Water, 2012). This scenario made it impossible to objectively compare water quality variability from the same baseline. The second objective was to model sub-classes for the 9 parameters. The sub-class values served as inputs for the WQI, based on the constructed HIWQG. Maximum sub-class contribution towards each corresponding index value was also assessed for all monitoring points. The third objective was to determine class frequency distribution based on daily indices for each of the monitoring points.
STUDY AREA
Study site monitoring points were chosen to represent upstream-downstream relationships on the Vaal River (which flows from east to west) as well as possible pollution entry points into the Vaal River. The points and spatial relationships are shown in Fig. 3.

The Vaal basin, which is made up of Upper, Middle and Lower basins, is the economic hub of South Africa because it contributes about 60% of the country's economic activity and also supports approximately 12 million people (Dzwairo, 2011). The Upper Vaal alone accounts for about 20% of the country's gross domestic product (GDP). This WMA is where 11 of the 12 monitoring points are located, with V17 located downstream in the Middle Vaal. In terms of hydrological boundaries, C2 secondary catchment contains 11 of the 12 monitoring points while V1 lies in C1 secondary catchment (not shown in map). A zoomed-in map in Fig. 4 shows the river network and monitoring points within the C2 secondary catchment as well as V1 on the Vaal Dam.

The land use map in Fig. 5 indicates that waste effluent from mining activities in the north-western part of the Upper Vaal, and around V17 in the Middle Vaal, drains into the Vaal River via a network of tributaries.

This sinking of pollution exerts tremendous pressure on the water resource and its various treatment processes aiming to meet receiving water quality objectives. The majority of the pollution sources are mines, mine dumps and sewage treatment plants (DWAF, 2004b; Dzwairo et al., 2010; Gouws and Coetzee, 1997; Jack et al., 2006; Steyn et al., 1976), where specific sections are highly impacted and surrounding land is degraded (DWAF, 2004a; DWAF, 2004b; DWAF, 2004c; Van Steenderen et al., 1987). These sources have been creating pollution impacts for hundreds of years, downstream of the Vaal Dam and into the Middle Vaal. The mining impacts are shown to occur downstream of Vaal Dam.
Three decades ago, scientists already warned that securing sufficient supplies of good quality water in the Vaal basin would become increasingly difficult, mainly due to pollution of its upper reaches (Grobler et al., 1983). Yet, even with successful development of models such as WQ2000 for that basin (Herold et al., 2006), mitigation measures are yet to influence positive change. Pollution trends continue as shown by a more recent and comprehensive study by DWAF (2007), which used salinity values mapped against parameter acceptable management target values for receiving water quality objectives (Fig. 6).

The process of deriving quality objectives and guidelines for surface raw water has a long history in South Africa, and one of the main challenges continues to be the non-suitability of guidelines for specific use. Several different approaches have been proposed and evaluated for specific quality values (City of Tshwane 2055, 2012; DWAF, 1996; Roux et al., 1996; Slaughter, 2005). However, researchers still experience limitations (data, technological, etc.) and thus keep developing new approaches to suit particular requirements. This paper provides additional simplified assessments of the basin's pollution trends and possible sources, based on past trends. The tools can model future scenarios and parameter-targeted mitigation measures. Class frequency distribution and basin-specific WQI are such tools which will be determined.
METHODS AND MATERIALS
Constructing the harmonised in-stream water quality guideline
Parameter selection, data reduction and pre-processing were performed on datasets that ranged from 1 January 2003 to 30 November 2009. The procedures were adapted from those used in earlier studies by the same researchers (Dzwairo, 2011; Dzwairo et al., 2011a). It is the norm to sample at various intervals and this creates data-points which have missing values. Since the index was supposed to be developed for daily intervals it meant that the input data had to be value and date-filled to 2 526 days. Therefore raw data representing the 12 points and 9 parameters were cubic-interpolated on Matlab2012b in order to create the missing dates and corresponding data for all dates between 1 January 2003 and 30 November 2009. Although there are several interpolation techniques, cubic interpolation was chosen for the time-series dataset because the method is shape-preserving. The final dataset comprised 9 parameters per day for 2 526 days, for each of the 12 monitoring points.
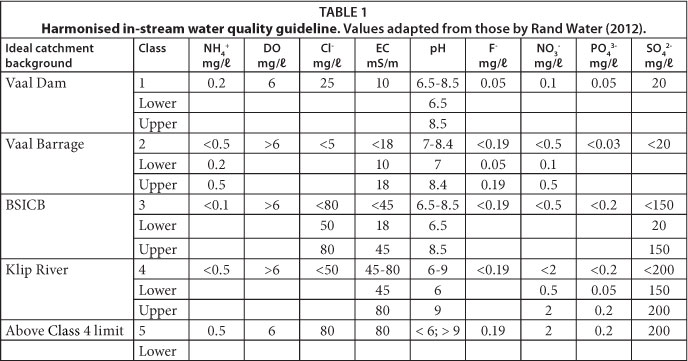
The HIWQG was constructed for NH4+ Cl-, EC, DO, pH, F-, NO3-, PO43- and SO42- against ideal catchment background limit values for Vaal Dam (Class 1), Vaal Barrage (Class 2), Blesbokspruit/Suikerbosrand river system (Class 3) and Klip River (Class 4) (see Table 1). Class 5 represented values which ranged above those of Klip River limit values (see Table 1). The rationale for using Vaal Dam limit values is that this sub-catchment is considered to have good quality water, especially for treating to potable standard. Thus mitigation or remediation measures for the basin as a whole could seek to return impacted environments to Vaal Dam quality equivalent, where applicable and possible.
Models for parameter-specific sub-classification of daily water quality
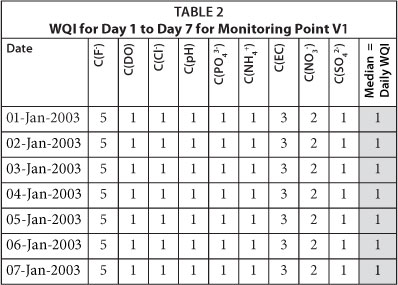
IF-THEN-ELSE statements with tree-depth of up to Level 4 were constructed in Microsoft Excel in order to sub-classify each of the 9 parameters using the HIWQG class limits provided in Table 2. The rule-sets for EC sub-classification are given in Eqs ( 1) to (4). Similar rule-sets were constructed for NH4+ Cl-, DO, pH, F-, NO3-, PO43- and SO42-.


The indices for each of the 2 526 days were calculated as medians of the 9 parameter sub-classes for each monitoring point.
RESULTS AND DISCUSSION
Using the harmonised in-stream water quality guideline
Microsoft Excel frequency distribution curves were drawn and temporal and spatial patterns of water quality were calculated from ranges, means, medians, and 1st and 3rd quartiles (5-num-ber summary) of the indices.
According to Table 1, the lower and upper limits of the proposed water quality classes set the ranges of acceptable values in each class. The values were extracted from Rand Water (2012) and adapted for this paper. The guideline represents a uniform baseline against which to compare the indices for monitoring points located in different sub-catchments. Parameter sub-classifications were allocated symbols as follows: ammonium (CNH4+), dissolved oxygen (CDO), chloride (CCl-), Electrical conductivity (CEC), fluoride (CF-), nitrate (CNO3-), pH (CpH), phosphate (CPO43-) and sulphate (CSO42-).
Table 2 gives the sub-classes for Monitoring Point V1, from 1 January 2003 to 7 January 2003. The same treatment was applied to datasets for the other 11 monitoring points and for data up to 30 November 2009. The median of the 9 sub-classes represented the WQI for that day for each monitoring point (refer to Table 2). The daily water quality indices (medians) were incorporated into Table 3 for all 2 526 days, to calculate the median which represented the 7-year water quality indices. Medians were also calculated for each sub-class for the 2 526 days at each monitoring point (see Table 4).


The 7-year indices from Table 3 were compared with the 7-year median sub-classes in Table 4 in order to determine the parameter (using its sub-class), if any, which contributed maximally towards the 7-year index for each point. The results are given in Table 5.

Values are ο mitted where there was no maximum contribution. CSO42- contributed maximally to the WQI at all monitoring points except S1, V1, T1 and R2. This theoretically means that if all other factors were held constant and non-interactive, mitigation and rehabilitation measures would target a monitoring point's upstream activities where the SO42- was emanating from. Where sub-classes equalled or were higher than the WQI, this indicated a positive influence on the WQI. The corresponding parameter could be viewed as a target for future impact mitigation measures. CDO contributed maximally at S1, K9 and L1; CCl- at R2; B1, S4 and T1; CPO43- at all points except V1, S1 and S4; and CNH4+ at R2. NO3- pollution attenuation measures could target V1, S1, K9, V7, V9 and R2. EC did not have maximal influence on indices of V1, S1, L1 and R2 while the rest of the points indicated a significant influence. CF- was Class 5 for all points but provided the maximum contribution to water quality indices for only B1, S4, T1 and R2.
For Vaal Dam at V1, the concern would be nitrate, which, if not strictly regulated, could contribute to nutrient loading in the dam. Vaal Dam is a strategic water resource in Gauteng as it supports wide sectoral needs, both domestic and industrial. Dam water also assists with flushing pollution which drains into the river via tributaries at confluences located downstream of the dam wall. B1 effluent is characteristic of acid mine drainage (high sulphate and electrical conductivity), thus mitigation measures could target such pollution sources. R2 exhibits characteristics typical of pollution emanating from sewage (phosphate, nitrate and ammonium contribution). Sulphate pollution patterns exhibited in Table 5 point to the conservative nature of that parameter across the two sub-catchments. The pattern of indices and direction of flow suggest that sulphate enters the Vaal system via tributaries at B1 and K9 and does not attenuate significantly downstream to V17 in Middle Vaal.
Class frequency distribution
While spatial and temporal trending provided an indication of pollution sources and their magnitude against a HIWQG, each of the 12 monitoring points' daily index distribution (variation) and robustness over 2 526 days were determined using histograms for class ranges 1 to 4 and a bin of Class 5. The data is presented for all points as percentage frequency distribution. If the index wobbled significantly among the five classes, the distribution showed a typical spread across the five classes whereas a robust index showed a predominance of one percentage value. Wobbling could point to non-consistent sources of pollution while robustness could be as a result of either constant pollution or the presence of a conservative pollutant parameter at that point.

For Point V1 the frequency of Class 1 was 91%, with 6% for Class 2 and 3% for Class 3. S1 indicated 60% frequency for Class 1, 27% for Class 2, 13% for Class 3, 1% for Class 4 and 1% for Class 5. V1 and S1 exhibited the least effects of pollution. However, S1 values indicate that for 27% of the indices, that point's quality was Class 2, and it also exhibits wobbling. Wobbling is where class frequencies are spread among all of the five quality classes and exhibit significant values. B1 exhibited a 76% frequency for Class 5, 20% for Class 4, 2% for Class 3 and 1% for Class 2. Theoretically, a prioritised strategy could first target mitigation of polluted environments (rivers, mine dumps, etc.) that were monitored at B1 before those monitored at S1. This would induce an overall lower index on a point downstream of both B1 and S1, for example, at S4. K9 ranked Class 4 with 42% frequency, Class 5 with 41% and Class 3 with 17%. The precautionary principle would rank K9 as Class 5 overall since there is only a 1% difference between Class 4 and Class 5 frequencies for that point.
While salinity (DWAF, 1996) and conductivity (Dzwairo et al., 2011b) provide an overall indication of the pollution status of sites along the Vaal River and its tributaries, the water quality indicators and rule-sets described in this paper offer more detail and allow for the identification of problem parameters.
Using data manipulations like those in Fig. 7, further analysis could assist with establishing possible future states of an impacted ecosystem. Among the monitoring points, V1 and S1 were the least impacted. However, individual sub-classification indicated that some of the parameters contributed 1% towards Class 5 frequencies at S1. The water passing through points B1, S4, T1 and R2 was highly impacted although overall indices were influenced by different combinations of variables (refer to median sub-classes in TABLE 4). Pollution through R2 (it is a Class 5 tributary of the Vaal River which flows into the Vaal Barrage) highly impacted the Vaal River at V12, which is at the barrage wall. Water flowing through S4 (Class 5) and K9 (Class 4-5) impacted the Vaal River at V7 (Class 4). Both points are located on Vaal River tributaries. This shows that the Vaal River water was being polluted by rivers that were being monitored at S4 and at K9. The pollution effects changed the Vaal River's index from Class 1 at V1 to Class 4 at V7. The initial pollution shock at V7 was felt all the way downstream at V9 (Class 4), V12 (Class 4) and V17 (Class 4). Polluted water passing through T1, L1 and R2 (tributaries of Vaal River) maintained the Class 4 perturbation in the main Vaal River channel.

The superimposed graph in Fig. 7 (note that Class 4 and Class 5 for K9 were both included) serves to provide a platform for optimising rehabilitation efforts in the Upper Vaal sub-catchment to the section just before the barrage wall. Restoring the Upper Vaal sub-catchment to a pristine state means matching Vaal Dam conditions. These would entail raising the line graph to match 91% and shortening the bars to Class 1 across all Upper Vaal monitoring points given in Fig. 7. This would be the desired future state of the Upper Vaal sub-catchment. See Fig. 4 for geo-referenced positions of monitoring points.
The tools developed here, together with the results, were assessed for validity against results that were recorded by DWAF (2007), using the Salinity index (see Fig. 6). The general pollution trend evident in DWAF (2007) indicates good quality water for Vaal Dam, which is in agreement with the results reported in this paper. Figure 6 also indicates that barrage pollution values were higher than those for Vaal Dam, which is also in agreement with the results of the current study. Data available from Rand Water (2012; identifiers in brackets are those used for these data) show that, for example, water passing through points K9(K19), B1(B10) and S4(S2) is highly impacted while that passing through S1(S1) and V1(VD1i) is good quality water. This comparison indicates that the index system developed in this paper is valid for the conditions prevailing in the study area.
CONCLUSIONS
Four tools were used in this paper to consolidate pollution trends and to make a case for strengthening practices that target heavily impacting sources of pollution in the basin, most of which lie in the East Rand. These are: (i) the 9-parameter harmonised in-stream water quality guideline which provided a baseline for comparing pollution loads across boundaries, (ii) parameter sub-classification which characterised pollution types at specific points in order to tailor mitigation strategies, (iii) the water quality index which facilitated pollution assessment at any time-step using the median value of the chosen time-step, and (iv) class frequency distribution which assessed parameter contribution towards the overall water quality index.
Rehabilitation of upstream impacted environments would theoretically lower indices downstream, as indicated by the desired future state model (Fig. 7). This approach does not ignore practical pollutant interactions within an aqueous/sediment medium, which could result in combined phenotypic behaviour. Combined interactions are, however, beyond the scope of this paper. The methodology offers a simple approach to assess severity of pollution from sub-classes and the overall indices, across sub-catchments, without necessarily using expensive and sometimes complicated commercial models. Sub-classification and class frequency distribution indicate possible sources of pollution, from among those existent in the impacted spatial boundary. The classification system, however, is a preliminary first step; a catchment manager, for example, would need to examine the raw data before making further decisions.
The developed classification system could be used to predict future median classes, based on the specific parameters used. Given the classification frequencies of the monitoring points, a water regulator could charge more to a user abstracting Class 1 water, which represents best quality, while a user abstracting Class 5 water could be charged much less. In addition, a tariff system based on these indices would equitably cross-subsidise upstream-downstream raw water use.
ACKNOWLEDGEMENT
The financial assistance of the Department of Science Technology (DST) is hereby acknowledged. Opinions expressed and conclusions presented are those of the authors and are not necessarily to be attributed to the DST. The authors would also like to sincerely thank Durban University of Technology for hosting and co-funding the Post-Doctoral Fellowship. The Department of Water Affairs and the Water Boards, Rand Water (co-funding), Midvaal Water and Sedibeng Water, are acknowledged for providing datasets and other relevant documentation, without which this research could not have been conducted.
REFERENCES
ABRAHÃO r, CARVALHO m, DA SILVA JÚNIOR WR, MACHADO TTV, GADELHA CLM and HERNANDEZ MIM (2007) Use of index analysis to evaluate the water quality of a stream receiving industrial effluents. Water SA 33 (4) 459-465. [ Links ]
BOHENSKY EL (2008) Discovering resilient pathways for South African water management: two frameworks for a vision. Ecol. Soc. 13 (1) 19. [ Links ]
BROWN RM, McCLELLAND NI, DEININGER RA and TOZER RG (1970) A water quality index - do we dare? Water Sewage Works 117 (10) 339-343. [ Links ]
CITY OF TSHWANE (2012) City of Tshwane 2055. City of Tshwane, our Past and Present. City of Tshwane Metropolitan Municipality, Pretoria. [ Links ]
COUILLARD D and LEFEBVRE Y (1985) Analysis of water-quality indices. J. Environ. Manage. 21 (2) 161-179. [ Links ]
DUNNETTE DA (1979) A geographically variable water quality index used in Oregon. J. Water Pollut. Control Fed. 51 (1) 53-61. [ Links ]
DWAF (DEPARTMENT OF WATER AFFAIRS AND FORESTRY, SOUTH AFRICA) (1996) South African Water Quality Guidelines: Volume 7: Aquatic Ecosystems. DWAF, Pretoria. [ Links ]
DWAF (DEPARTMENT OF WATER AFFAIRS AND FORESTRY, SOUTH AFRICA) (2004a) Middle Vaal Water Management Area: Internal Strategic Perspective. Prepared by PDNA, WRP Consulting Engineers (Pty) Ltd, WMB and Kwezi-V3 on behalf of the Directorate: National Water Resource Planning. DWAF Report No. P WMA 09/000/00/0304). DWAF, Pretoria. [ Links ]
DWAF (DEPARTMENT OF WATER AFFAIRS AND FORESTRY, SOUTH AFRICA) (2004b) National Water Resource Strategy. DWAF, Pretoria. [ Links ]
DWAF (DEPARTMENT OF WATER AFFAIRS AND FORESTRY, SOUTH AFRICA) (2004c) Upper Vaal Water Management Area: Internal Strategic Perspective. Prepared by PDNA, WRP Consulting Engineers (Pty) Ltd, WMB and Kwezi-V3 on behalf of the Directorate: National Water Resource Planning. DWAF Report No P WMA 08/000/00/0304. (No. P WMA 08/000/00/0304). DWAF, Pretoria. [ Links ]
DWAF (DEPARTMENT OF WATER AFFAIRS AND FORESTRY, SOUTH AFRICA) (2007) Integrated water quality management plan for the Vaal River system. DWAF, Pretoria. [ Links ]
DZWAIRO B (2011) Modelling raw water quality variability in order to predict cost of water treatment. DTech thesis, Tshwane University of Technology. [ Links ]
DZWAIRO B, OCHIENG GM, LETSOALO ME and OTIENO FA (2011a) Data reduction for water quality modelling, Vaal Basin. In: Leite EP (ed.) Scientific and Engineering Applications Using Matlab. Intech, Croatia. [ Links ]
DZWAIRO B, OTIENO FAO and OCHIENG GM (2010) Making a case for systems thinking approach to integrated water resources management (IWRM). Int. J. Water Resour. Environ. Eng. 1 (5) 107-113. [ Links ]
DZWAIRO B, OTIENO FAO and OCHIENG GM (2011b) Ecological functionality of the Upper and Middle Vaal Water Management Areas. In: Proceedings of the 3rd Municipal drinking water quality conference, 27 June - 1 July 2011, Cape Town. [ Links ]
EVEN S, BILLEN G, BACQ N, THERY S, RUELLAND D, GARNIER J, CUGIER P, POULIN M, BLANC S, LAMY F and PAFFONI C (2007) New tools for modelling water quality of hydrosystems: An application in the Seine River basin in the frame of the Water Framework Directive. Sci. Total Environ. 375 (1-3) 274-291. [ Links ]
GOUWS K and COETZEE PP (1997) Determination and partitioning of heavy metals in sediments of the Vaal Dam System by sequential extraction. Water SA 23 (3) 217-226. [ Links ]
GROBLER D, TOERIEN D and DE WET J (1983) Changes in turbidity as a result of mineralisation in the lower Vaal River. Water SA 9 (3) 110-116. [ Links ]
HAWKINS SJ, FIRTH LB, MCHUGH M, POLOCZANSKA ES, HERBERT RJH, BURROWS MT, KENDALL MA, MOORE PJ, THOMPSON RC, JENKINS SR, SIMS DW, GENNER MJ and MIESZKOWSKA N (2013) Data rescue and re-use: Recycling old information to address new policy concerns. Mar. Polic. 42 91-98. [ Links ]
HEROLD CE, LE ROUX PJ, NYABEZE WR and GERBER A (2006) WQ2000 Salinity Model: enhancement, technology transfer and implementation of user support for the Vaal system. WRC Report No. 1495/1/06. Water Research Commission, Pretoria. [ Links ]
HORTON RK (1965) An index number system for rating water quality. J. Water Pollut. Control Fed. 37 (3) 300-306. [ Links ]
JACK U, MACKINTOSH G, JAGALS C and VAN DER MERWE J (2006) Development of a comprehensive monitoring and auditing tool for oxidation ponds systems in the Middle Vaal and Upper Orange catchment areas. Water SA 32(5) 655-660. [ Links ]
KATERJI N, VAN HOORN JW, HAMDY A and MASTRORILLI M (2000) Salt tolerance classification of crops according to soil salinity and to water stress day index. Agric. Water Manage. 43 (1) 99-109. [ Links ]
MEY W and VAN NIEKERK A (2009) Evolution of mine water management in the Highveld coalfields. In: Proceedings of the The International Mine Water Conference, 19-23 October 2009, Pretoria. [ Links ]
PESCE SF and WUNDERLIN DA (2000) Use of water quality indices to verify the impact of Córdoba City (Argentina) on Suquia River. Water Res. 34 (11) 2915-2926. [ Links ]
RAND WATER (2012) Welcome to the Reservoir: water resource information centre for the Vaal Barrage and Vaal Dam catchments. URL: http://www.reservoir.co.za/ (Accessed 19 December 2012). [ Links ]
ROUX DJ, JOOSTE SHJ and MACKAY HM (1996) Substance-specific water quality criteria for the protection of South African freshwater ecosystems: methods for derivation and intial results for some inorganic toxic substances. S. Afr. J. Sci. 92 198-206. [ Links ]
SLAUGHTER AR (2005) The refinement of protective salinity guidelines for South African freshwater resources. MSc thesis, Rhodes University. [ Links ]
SLAVICH PG, WALKER GR and JOLLY ID (1999) A flood history weighted index of average root-zone salinity for assessing flood impacts on health of vegetation on a saline floodplain. Agric. Water Manage. 39 (2-3) 135-151. [ Links ]
STEYN D, TOERIEN D and VISSER J (1976) Eutrophication levels of some South African impoundments. IV. Vaal Dam. Water SA 2 (2) 53-57. [ Links ]
VAN STEENDEREN R, THERON S and HASSETT A (1987) The occurrence of organic micro-pollutants in the Vaal River between Grootdraai Dam and Parys. Water SA 13 (4) 209-214. [ Links ]
WEPENER V, CYRUS D, VERMEULEN L, O'BRIEN G and WADE P (2006) Development of a water quality index for estuarine water quality management in South Africa. WRC Report No. 1163/1/06. Water Research Commission, Pretoria. [ Links ]
 Correspondence:
Bloodless Dzwairo
+27 83 324-3095
e-mail: ig445578@gmail.com
Received 1 January 2013
Accepted in revised form 4 March 2014

