


Services on Demand
Article
 English (pdf)
 Article in xml format
 Article references
Indicators

Related links
-
 Cited by Google
 -
 Similars in Google
Share

 Permalink
Water SA
On-line version ISSN 1816-7950
Print version ISSN 0378-4738
Water SA vol.40 n.2 Pretoria Apr. 2014
TECHNICAL NOTE
The development of GIS-PMWIN and its application for mine-water modelling in the Far West Rand, South Africa
Haili Lin; Lixiang Lin
Water Geoscience Unit, Council for Geoscience, Private Bag X112, Silverton, 0001, South Africa
ABSTRACT
A toolbar GIS-PMWIN was developed in ArcGIS 9.3 using the embedded Visual Basic for Application. The purpose was to create a linkage between ArcGIS and PMWIN for groundwater modelling with GIS data in PMWIN. Six function modules are developed, including: (i) set model dimension, (ii) modify the current model, (iii) export the grid specification file, (iv) prepare and export the boundary condition files, (v) set top and bottom elevation of layers, and (vi) prepare and export matrix data. Based on the conceptualisation of the study area, the model dimension, discretisation and many value setting processes can be easily carried out in ArcGIS rather than directly in PMWIN, through these function modules. The grid specification file and other input files can be exported as the PMWIN-compatible files which can be directly loaded to PMWIN for modelling. The linkage can be used with a higher version of PMWIN or ArcGIS. It has been applied to mine water modelling in the Far West Rand of the Witwatersrand basin to simulate dewatering and re-watering conditions and scenarios. The modelling practice is elaborated in detail as a case study, and it is demonstrated that the linkage is efficient and easy to use.
Keywords: ArcGIS, PMWIN, groundwater modelling, dewatering, re-watering
INTRODUCTION
Geographic information systems (GIS) are a powerful tool in the field of geosciences (Lukas et al., 1995). GIS has been extensively used to store, analyse and present both spatial and non-spatial data. Surface Water Resources of South Africa 1990 (WR90, Midgley et al., 1994), Water Resources of South Africa 2005 (WR2005, Middleton et al., 2009; Middleton et al., 2011), National Groundwater Database (NGDB), National Groundwater Archive (NGA) and National Groundwater Information System (NGIS)(coordinated and maintained by the Department of Water Affairs, DWA), Groundwater Resource Assessment Phase 1 and Phase 2 (GRA1 and GRA2 , coordinated by DWA) and the on-going GRA3. These datasets have been frequently used in hydrogeological projects. In addition to GIS, which serves as the main data platform, numerical modelling is a necessary approach for much groundwater research or practice, especially that related to water supply, aquifer evaluation and mass transportation. Various software programs are available for groundwater modelling, of which MODFLOW (McDonald and Harbaugh, 1983) is one of the most commonly used, partly because of its free and open-source code. However, data preparation for MODFLOW has long been a challenge that hydrogeologists face, especially for large-scale simulations with complicated hydrogeological conditions. A fixed data format is strictly required in MODFLOW for all of the input datasets, while most of the existing data are in GIS format. In South Africa, this scenario is typically the case.
There are some commercial software packages which both incorporate MODFLOW and support GIS data format, such as GMS (AQUAVEO, 2013), Visual MODFLOW (WHI, 2006) and Groundwater Vistas (Rumbaugh and Rumbaugh, 1998). However the high price and complicated method of pre-processing have made them less accessible to modellers, especially beginners and learners. PMWIN (Chiang, 2005) is an option that falls between MODFLOW and the aforementioned expensive modelling software in terms of data compatibility and price. The lower version, PMWIN 5.3, is free of charge and can be downloaded from the official website (http://www.simcore.com/pm53). Generally, PMWIN has the following advantages compared with the DOS version of MODFLOW:
• User-friendly interface
• Visualised pre-processor and post-processor
• A simple geo-referencing tool
• Several transport models (MT3D, MT3DMS, MOC3D, etc.) and inverse codes (UCODE and PEST) integrated
Because of its cheaper/zero price and the mentioned advantages, many modellers prefer PMWIN for conducting ground-water modelling. Unfortunately the most popular GIS data format, shapefile, is not supported in PMWIN. Modellers have to try to simplify their model to avoid the time-consuming pre-processing procedures, which can result in important information being left out or the required resolution for a specific study being lost. Moreover, the value-setting process for aquifer geometrics, boundary conditions, initial conditions, aquifer properties, and stresses like recharge and pumping, can only be done manually cell by cell or using some simple batch operations in the free version, PMWIN 5.3. Spatially-related operations are generally difficult to perform to speed up procedures. Even if this situation has been improved in the higher versions PMWIN Pro 7.x and 8.x, by importing a dxf or bln file, which can be converted to the zone file/polygon file, third-party software in the form of AutoCAD or Surfer has to be involved.
A proper linkage between GIS and PMWIN is needed as a solution to these problems. ArcGIS was selected as the platform to develop this linkage. The reason for selecting ArcGIS is threefold: firstly, ArcGIS is the most powerful GIS software; secondly, ArcGIS is the most popular GIS software and has been extensively used in South Africa by students, researchers and private consultants in the relevant professional fields; thirdly, ArcGIS embeds the developing environment VBA (Visual Basic for Application) which supports secondary development. The linkage, appearing as a toolbar entitled 'GIS-PMWIN', was developed in ArcGIS 9.3.1 to deal with the data preparation requirements for groundwater modelling in PMWIN. GIS-PMWIN provides the full functions of a preprocessor of modelling, including discretising study area, value setting, and, most importantly, preparing the ASCII datasets for PMWIN. The functions of 'move', 'rotation', 'refinement', 'sub-model', and deleting and inserting row(s) or column(s) of the model have also been developed to avoid any inconvenience caused by model modification.
METHODOLOGY
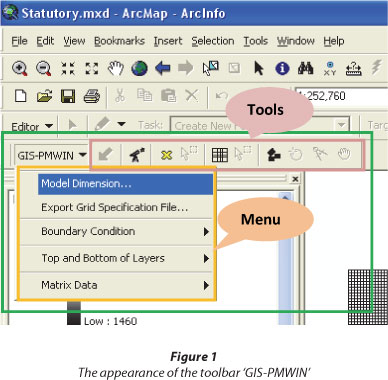
The interface of GIS-PMWIN is a customised docking toolbar added to the existing ArcMap toolbars. All of the functions are grouped into menus and tools which are bound to the toolbar (Fig. 1). It can be activated or deactivated simply by checking or unchecking in the toolbar list. As its name implies, GIS-PMWIN is intended to build a linkage between GIS and PMWIN, making the pre-processing of modelling more convenient with GIS data. Six main function modules are involved in GIS-PMWIN and are described below.
Module 1 - Set model dimension
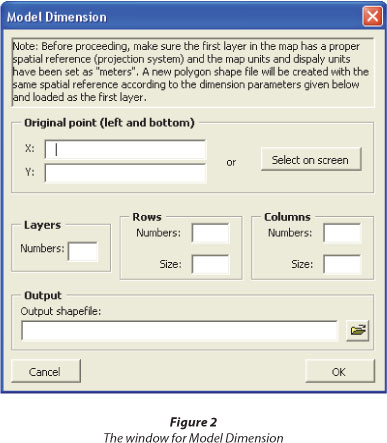
The interface of this module was designed similarly to that in PMWIN. Before setting the model dimension, a map layer for the study area with the correct spatial reference information is required to be loaded as the first layer. A new shapefile will be created using that spatial reference. Four steps are involved in this module: model dimension input; creating the shapefile; discretisation; and indexing the rows and columns. The model area should cover the study area completely and include all necessary hydrogeological features, i.e. rivers or faults adjacent to the study area, as these are important boundaries in ground-water modelling. The information for 'model dimension' that needs to be input includes the coordinates of the left bottom point, model layers, and the number and size of rows and columns. The interface for 'model dimension' is shown in Fig. 2.
When all of the information input is complete, a rectangle polygon with the input dimension and specified file name and directory is created as a shapefile and loaded to the top layer of the map. The fields 'BndofLayl', 'TopOfLayl' and 'BotOfLayl' will be added to the attributes table of the shapefile. If more than 1 layer is specified, the information will also be added to the attributes table with the postfix of 'Lay2', 'Lay3' and so on. The rectangle polygon in the newly-created shapefile will then be discretised into the grid of rectangle cells according to the row and column information (Fig. 3). It may take a long time to discretise large areas into dense grids. A progress bar will show the process at the bottom of the application window. Even though this step is easy to implement directly in PMWIN, there are advantages to rather completing this step in ArcGIS; the powerful spatial function of GIS can be used to set the parameters for each cell precisely and easily, which is usually difficult in PMWIN.
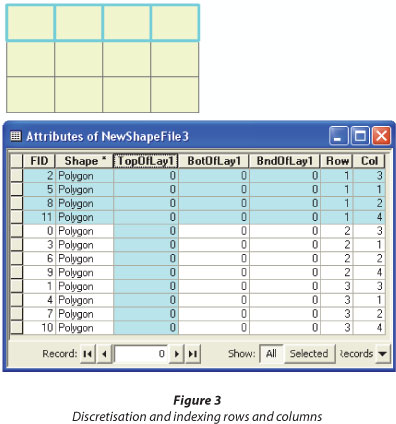
The discretised cells are unrelated to MODFLOW if they are not indexed with the column and row numbers. The numbering of cells was designed to coincide with MODFLOW, i.e. the number of columns increases from left to right, and the number of rows from top to bottom. Two fields named 'Col' and 'Row' will be added to the attribute table with the corresponding number for each cell, as demonstrated in Fig. 3.
Module 2 - Modify the current model
At times it is the case that the current model was not properly designed and needs to be modified. Rebuilding the model will result in a loss of all of the information which has been attached with the current model, or will take a long time. Alternatively, there are several tools to modify the current model, such as:
Telescoping the model
A tool was developed to conduct this function. A sub-area with the same gridding can be extracted from the current model and the column and row numbers of the new model will be indexed automatically.
Delete row(s) or column(s), add row(s) or column(s)
A tool was developed to conduct this function. Unnecessary row(s) and column(s) in the current model can be deleted from the current model. Similarly, new rows and columns can be added to the current model.
Refine a specified cell to several rows and/or columns
This function is used to divide a specified cell into several rows and/or columns. It can be used when there are wells or other small-size but important hydrogeological features. The column and row numbers of the new model will be indexed automatically.
Rotate or shift the current model
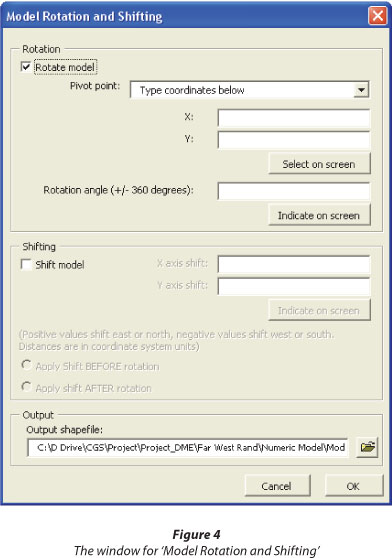
A tool was developed to conduct this function. The two operations, rotation and shift, are grouped in one interface (Fig. 4). Similar to what is available in PMWIN, rotation is used to make the model parallel with some major hydrogeological boundaries or features such as a fault, while shift is used to adjust the location of the model area. Both of the operations can be solely applied or applied together by a user-specified sequence. The pivot point for rotation can be set as NW, NE, SW, NE corner point, centre point of the envelope of the current model, any point on the screen or manual input of X and Y coordinates. Rotation angle can be input manually or specified on screen. Shift vectors can be specified on screen or by inputting the X and Y distance.
After each of these modifications, a new model will be created as a shapefile with the specified file name and directory and loaded to the top layer of the map. However, the information which has been saved in the attribute table will mostly be modified depending on whether the location of the indexed cell has been changed or not. A general tip for this module is: design and modify the model properly before starting the value-setting operations.
Module 3 - Export the grid specification file
This function is provided through the menu 'Export Grid Specification File'. The specification data of the model grid is written into a text file. This file can be loaded in PMWIN and the same grid with the same coordinates and dimensions will be automatically created in PMWIN. The file format of the grid specification file and the explanation of fields used are listed below (from Chiang, 2005):
• Line 1: NROW NCOL
• Line 2: X Y ANGLE
• Line 3: DELR (NCOL)
• Line 4: DELC (NROW)
• Line 5: X1, Y1
• Line 6: X2, Y2
• Line 7: NLAY
NROW is the number of model rows.
NCOL is the number of model columns.
X is the x-coordinate of the top-left corner of the model grid.
Y is the y-coordinate of the top-left corner of the model grid.
ANGLE is the rotation angle expressed in degrees and measured counter-clockwise from the positive x-axis.
DELR is the cell width along rows. Read one value for each of the NCOL columns. This is a single array with one value for each column.
DELC is the cell width along columns. Read one value for each of the NROW rows. This is a single array with one value for each row.
X1, Y1 is the coordinates of the lower-left corner of the model worksheet.
X2, Y2 is the coordinates of the upper-right corner of the model worksheet.
NLAY is the number of model layers.
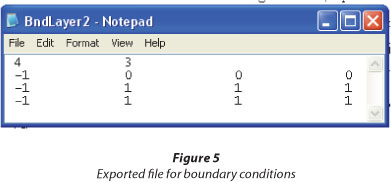
Module 4 - Specify the boundary condition in GIS and export file
A simple explanation is given on how to set the boundary values in ArcGIS. The powerful spatial selection function in ArcGIS can be used to determine the boundary condition for the model cells. For example, the cells outside the study area may be specified as inactive (0) or the cells along a perennial river as fixed-head (-1). After selecting the cells, open the attributes table and change the values in the relative fields (BndOfLay1, BndOfLay2, etc.). This procedure needs to be done for all model layers.
After specifying the boundary values in the attributes table, the data can be exported to a text file which can be directly loaded in PMWIN. For example, the boundary condition file for a model with 4 columns and 3 rows may be exported as shown in Fig. 5.
Module 5 - Set top and bottom elevation of layers
This function is designed to extract the elevation values from the DEM or elevation raster files to the model cells. As a normal condition, model layers are defined by geological formations and the raster file of the elevation data can be interpolated from borehole data. In some cases when the model layers don't coincide with geological formations further processing can be easily done with spatial analyst in ArcGIS. If the raster file for the top or bottom elevation of a specified layer is available from the current map layers or from the disk, the data can be extracted to the model cells and saved under the corresponding field (TopOfLayl, BotOfLayl, ...) in the attribute table. Then the data can be exported to text file for PMWIN. This procedure can be skipped in ArcGIS and done directly in PMWIN when the elevation data are constant.
Module 6 - Prepare and export matrix data
90% of the data input (initial heads, aquifer parameters, data for MODFLOW packages, etc.) in PMWIN are matrix data, which can be set in ArcMap and then exported to text files that can be read in PMWIN, such as the boundary condition files and the elevation files. The reference layers (geological map, rivers, etc.) need to be loaded to the current map and the model layer should be moved to the top. Then add data fields to the attribute table and set values as mentioned in Module 4. In the window for 'Export Data Files' (Fig. 6), the user may choose one data field to export the data to the specified file name and directory.
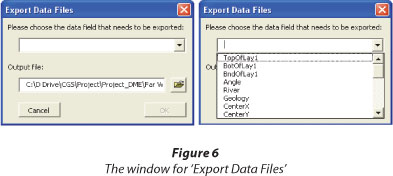
All of the exported text files can be loaded into PMWIN by clicking 'Value→Matrix→Load'. The data values in the text file will be assigned to each cell.
CASE STUDY
GIS-PMWIN has been used for groundwater modelling of the Far West Rand (FWR) area of the Witwatersrand Basin to simulate pre-mining, dewatering and re-watering scenarios. The model dimension, discretisation and parameters were prepared in ArcGIS with the aid of GIS-PMWIN. All function modules except Module 2 were used and tested. Module 2 has only been tested in simple models and was shown to be working as required.
Gold mining started in the Far West Rand in 1912 and has been affected by the large amount of water inrush from the overlying dolomite. Regional dewatering started in 1964 to maintain a 'dry' condition for underground mining. This has been achieved through two mechanisms, i.e. the diversion of the Wonderfonteinspruit and pumping of influx water to other catchments. Subsequent to dewatering, a series of springs dried up and ground instability and sinkhole formation occurred over the dewatered dolomitic compartments. Another risk has been identified in the form of aquifer contamination associated with re-watering after mine closure. The purpose of modelling is to predict the rate of re-watering and the future groundwater flow patterns. Pre-mining and dewatering processes are simulated and calibrated to obtain the expected initial conditions for re-watering.
Study area
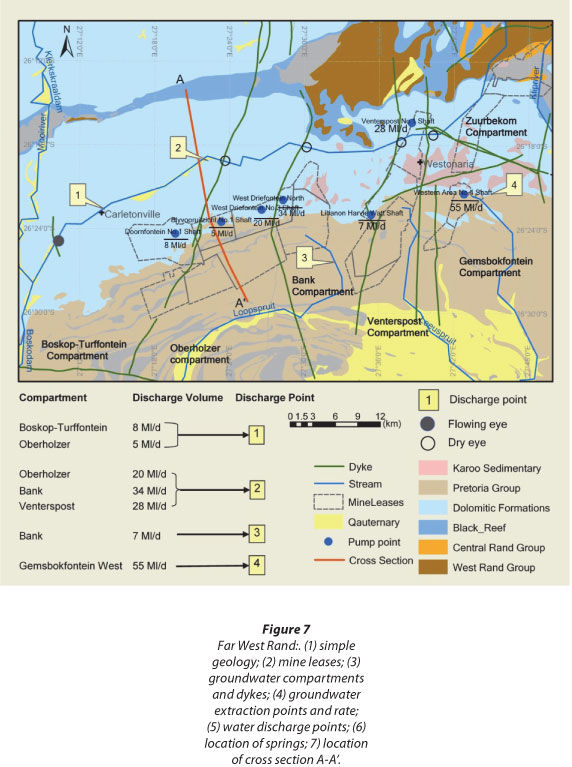
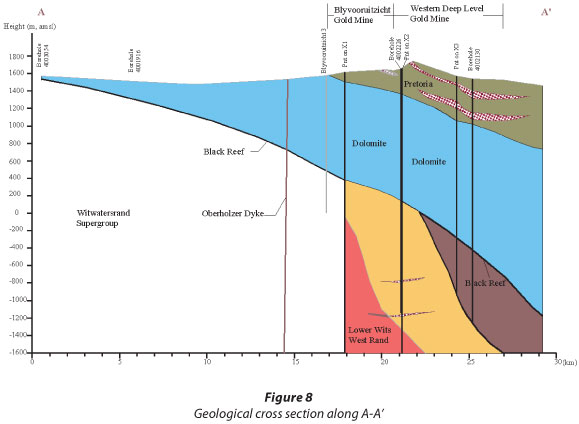
The entire FWR is located on the south wing of the asymmetrical Hartbeesfontein anticline with a considerable part of its surface area covered by dolomites (Fig. 7). Small windows of Achaean granitoids and Black Reef Formation quartzite outcrop on the crest of the Hartbeesfontein anticline and constitute the northern boundary of the groundwater in this area. The Transvaal Supergroup, which forms the southern limb of the anticline, dips 6° to the south. The Pretoria Group, which has been removed along the edge of the Hartbeesfontein anticline, exposing the Malmani dolomites along the length of the Wonderfonteinspruit, forms the southern boundary. The andesitic Ventersdorp Lava, with thickness varying between 0 and 1 500m, is unconformably covered by the dolomite, and, in turn, the Witwatersrand Supergroup sediments, containing the gold reefs, are unconformably overlain by the Ventersdorp Lava. A typical cross-section (Fig. 8) shows the geological sequence of the area.
A network of folds, faults, joints and fractures, together with weathering residues, has been created through geomorphological and structural processes, which significantly modified the original dolomite rock properties by increasing the porosity, storativity and conductivity. The weathered part of the dolomite has been identified as one of the regional aquifers in South Africa. However in the mining process, the ground-water has been continuously transported to the underlying mines through faults and fractures which connect these formations, creating a major challenge to mining safety and a large economic cost.
A characteristic of the area is a series of N-S direction dykes. The dykes are impermeable relative to the weathered dolomite, which therefore divide the dolomites into a sequence of independent groundwater compartments, namely, from east to west: Zuurbekom and Gemsbokfontein (E&W), Venterspost, Bank, Oberholzer and Boskop-Turffontein Compartments (Fig. 7). In pre-mining times, a sequence of cold springs occurred along the Wonderfonteinspruit where the river intersected with the dykes. The spring yield accumulated from upstream to downstream.
The whole area has been heavily impacted in many ways by gold mining since the early 20th century. The adverse effects are summarised as follows:
• Dewatering has caused a regional decline of groundwater over the Gemsbokfontein, Venterspost, Bank and Oberholzer Compartments. Deep depression cones formed around the pumping shafts.
• The dolomite springs have dried up since dewatering started.
• The Wonderfonteinspruit was diverted to concrete pipes and the surface water flow pattern has been changed.
• A large number of sinkholes and ground depressions have developed along the river since pumping started.
• Surface water quality over the whole area and adjacent catchments has deteriorated due to the discharge of mine water; this in turn impacts the groundwater by infiltration underground.
• The presence of rock dumps, sand dumps and slime dams on the surface has caused serious environmental problems such as acid mine drainage.
• A considerable part of the underground dykes has been mined through, which alters the groundwater flow pattern in an irreversible way. A mega-compartment could form and all of the upper stream springs except Turffontein Spring will not revive in the future unless underground engineering work is done to repair the mined-through parts.
• Rewatering is expected after mine closure, which will pose a threat to the whole underground reservoir of the dolomite aquifer in the area.
The re-watering model is based on the simulation of pre-mining and dewatering processes. Two re-watering scenarios are considered and modelled, i.e., compartmentalised water rise and the formation of a mega-compartment. In the first scenario, the dykes which separate the compartments are intact and will fill up independently. Some compartments fill faster than others depending on surface area, the volumes to be filled and recharge rate. The original groundwater levels will be restored and each spring will flow again. In the second scenario, it is assumed that the dykes have been mined through by the end of mining and the three compartments will be connected as a mega-compartment. It is impossible to model a gradual change of the condition. As for the independent models, the rewatering includes two parts: filling of the mine void (by calculation) and recharge of the dewatered dolomite aquifer (by modelling).
Model construction and general settings
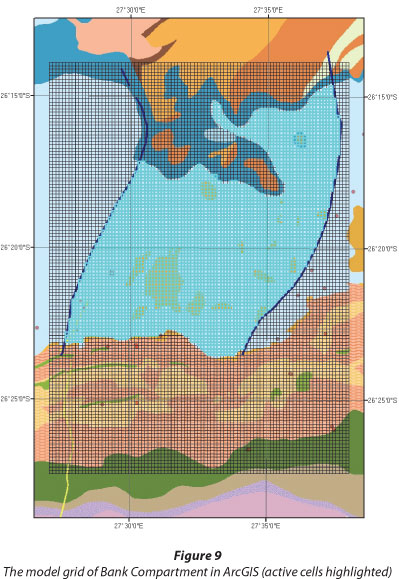
Due to the availability of data, only the middle three compartments, i.e., Venterspost, Bank and Oberholzer, were modelled. Models were constructed for the three single compartments (premining, dewatering and rewatering), and then for a combined area to simulate the water rise in the mega-compartment. Rewatering time for each scenario is captured. The grid cell size of 200 m by 200 m was used for all the models. Each of the model areas has been elaborately designed to cover the study area with pre-defined coordinates, instead of manually selecting on-screen for the purpose of a later integration to a 'mega-compartment'. For each single compartment, pre-min-ing, dewatering and re-watering (post-mining) are modelled. Each compartment is bounded by the Black Reef Formation in the north, Pretoria Group in the south and dykes in the east and west. Figure 9 shows the model grid of Bank Compartment created by GIS-PMWIN in ArcGIS. In the case of the mega-compartment, the middle dykes are removed and the western and eastern boundaries are set as Oberholzer Dyke and Gemsbokfontein Dyke, respectively. In addition to the boundary conditions, other general settings and assumptions for the three compartments are as follows:
• In pre-mining times, the major discharge of groundwater was via the spring located on the eastern boundary of each compartment, baseflow in the Wonderfonteinspruit and water supplying boreholes. According to the hydrocensus of the NGDB boreholes, the groundwater supply is limited to the upper 200 m, which is the most productive part of the dolomite aquifer. Therefore a single-layer model is constructed for the pre-mining period, which is 200 m thick from the ground surface. There is very limited data on water supply, and this is thus excluded from the model. This action is counterbalanced by reducing the areal recharge value.
• In the dewatering period, 2 layers are considered because the pumps are located down in the shafts which penetrate the full thickness of dolomite. The top layer remains the same as the pre-mining model and the second layer is set as 400 m thick, below the first layer. This is because the top 600 m of the dolomite is regarded as the most productive part when pumping, while below that the dolomite is considered to have very low storativity and conductivity. The same 2-layer model is used for re-watering modelling.
• For each compartment, the simulation flow type is assumed as steady-state for the pre-mining period, transient for the dewatering and re-watering period until the premining water level is achieved. The initial head for the pre-mining model was set as the surface elevation and the pre-mining model was calibrated against the groundwater contours in some available reports (Hodgson et al., 2001; Winde et al., 2006). The simulated final head data of the calibrated pre-mining model were used as the initial head of the dewater-ing model, which is calibrated by the drop in groundwater level and the head difference inside the compartment at a specific time. Finally the simulated final head of the calibrated dewatering model was used as the initial head of the rewatering model to predict the groundwater rise in the single compartments or mega-compartment.
• In the dewatering model, it is a fact that with the process of mining and dewatering, there would be an increasingly induced and augmented recharge from adjacent aquifers or from the ground surface, which is difficult to accurately quantify. An increasing magnitude of recharge from the top of the model was applied at different stages of dewatering (over the stress periods) to simulate the increased recharge until a recorded equilibrium is reached.
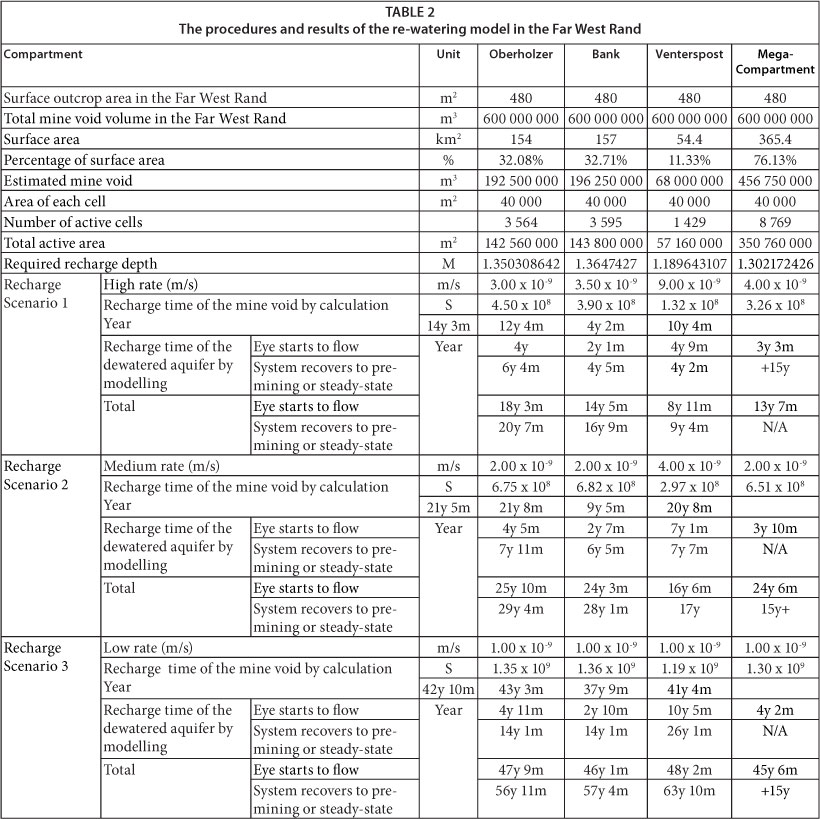
• The rewatering process includes 2 parts: filling of the mine void and then the recharge of the dolomite aquifer. The time to fill the mine void is calculated by dividing the mine void volume by recharge. The total mine void volume in the Far West Rand was around 600 Mm3 at the time of modelling. The mine void volume in each compartment is assumed to follow the same proportion of surface outcrop area and thus can be estimated. The recharge of the dewatered dolomite aquifer is simulated by re-watering modelling. In all the re-watering models (compartmental water rise and mega-compartment), it is assumed that pumping stopped at the end of 2011, after which re-watering started. The water levels at the end of 2011 simulated by the dewatering model are loaded as initial hydraulic heads for all re-watering models. A range of recharge values are used to represent the high, medium and low recharge scenarios. In each compartment 3 recharge rates are used, of which the highest one is close to the recharge value used in the steady-state dewatering period and the lowest one is 1 x 10⁻⁹ m/s, equivalent to 4.5% of the annual precipitation (700 mm), which is also used in the pre-mining model.
• The Wonderfonteinspruit was a perennial river before it was diverted. It is simulated using 'River' package in the pre-mining model by assuming that the river is recharged by the aquifer or discharges to the aquifer, depending on whether the head in the river is lower or higher than the head in the aquifer. Over the river channel the hydraulic conductance was set as 0.01 m2/s and the river bed elevations are adjusted from the DEM to avoid any interpolation error. Since the springs were constantly flowing before mining, they were simulated using the 'Drain' Package in the pre-mining model, assuming that the eye is always receiving groundwater from the aquifer. The drain hydraulic conductance is set extremely high (10 000 m2/s) at the spring cells to represent the natural discharge and the drain elevation was set as the elevation of the spring. In the dewatering model the 'River' package and 'Drain' package were deactivated to represent the condition of a dry spring and diverted river. These two packages are then reactivated in the rewatering model to estimate the time taken for the mine void and the dewatered aquifer to be refilled.
Model parameters
Initial model parameters were extracted from previous reports and publications (Fleischer, 1981; Foster, 1988; Swart et al., 2003; Hodgson et al., 2001) and then adjusted by model running and calibration. The main parameters used for the dolomite outcrop in the model are listed in Table 1. The Karoo outliers presented in the area locally change the properties of the aquifer and were also included in the model. The stress periods for the dewatering model in each compartment were determined by the real pumping history, i.e. 64 years (1947~2011) in Venterspost, 50 years (1961~2011) in Bank and 54 years (1957~2011) in the Oberhozer compartment. The stress periods for re-watering are set as considerably long, but are monitored when the springs start to flow and the pre-mining conditions are reached.
Bank Compartment modelling: results and discussion
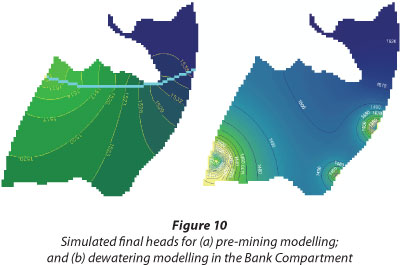
For purposes of brevity, a single compartment, Bank Compartment, was selected to demonstrate the modelling processes and results. The simulated final heads in the pre-mining model show a water level range of 1 502 m amsl (the elevation of the Bank eye) to 1 535 m asl in the compartment; this is in accordance with the range provided by Swart et al. (2003). Water budget over the eye cell shows that groundwater flows out at a rate of 6.64 Ml/day. The recorded spring flow was much higher than this value because it was augmented by surface flow and bedloss. Water budget over the model area shows that the river receives groundwater (baseflow) at a rate of 5.24 Ml/day.
One, two or three pumping shafts are applied to the dewatering model at different stress peroids, according to Winde et al. (2006), pumping at a rate of 10 Ml/day, 34 Ml/day and 4 Ml/day. Recharge values are adjusted over the stress periods to counterbalance the large amount of induced recharge. After around 30 years of dewatering, a dynamic equilibrium was achieved in 1990 between recharge and pumping in the Bank Compartment, indicated by stable water level. Therefore from 1990 onward the recharge rate is adjusted as 3.87 x 10⁻⁹ m/s (around 17.4% of rainfall) to balance the pumping in a quasi-steady state. Since the pumping rate is several times higher than the pre-mining recharge rate, this again confirms that a large amount of influx water has been intercepted from various sources and by different mechanisms, as discussed by Winde et al. (2006). The simulated final head range for the dewatering in the Bank Compartment is from 928 m asl to 1 524.9 m asl. Three depression cones formed around the pumping points. Groundwater in the West Driefontein North shaft is lowered to 928 m asl because of the highest pumping rate (34 Ml/day); this is calibrated by water level data in Swart et al. (2003).
The water levels at the end of 2011 simulated by the dewatering model (Fig. 10b) are loaded as initial hydraulic heads for the re-watering model. The spring (Bank Eye) and Wonderfonteinspruit are reactivated using 'Drain' and 'River' packages respectively. Considering both the filling of mine voids and the dewatered dolomite, in the Bank Compartment it takes from 14 years and 5 months, with a high recharge rate of 3.5 x 10⁻⁹m/s (equivalent to 15.8% of the annual precipitation), to 46 years and 1 month, with a low recharge rate of 1.0 x 10⁻⁹ (equivalent to 4.5% of the annual precipitation) for the spring (Bank Eye) to start to flow; it takes 16 years and 9 months to 57 years and 4 months for the system to recover to the pre-mining condition by comparing the water level distribution with that of the pre-mining condition. It is surprising that the filling of the mine void, as determined by calculation, takes a much longer time than the recharge of the dewatered dolomite, as determined by modelling.
Mega-compartment modelling: results and discussion
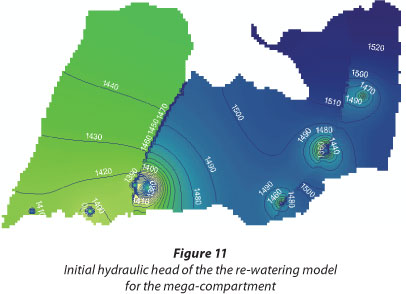
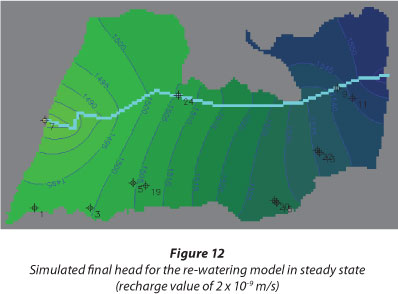
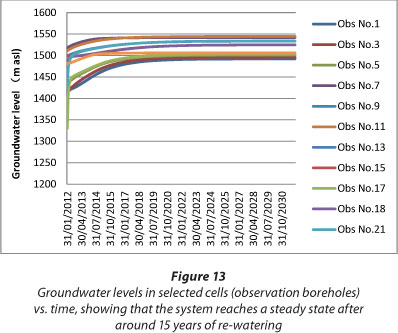
A mega-compartment model is used to simulate the synchronised water rise in all three compartments, where the dykes have been completely mined through and no longer form hydraulic barriers between the compartments. In this model, the three compartments are integrated into one model. The same aquifer parameters from the independent compartment models are used in the new model. The simulated final heads of the independent dewatering models are processed and loaded as initial heads for the new model (Fig. 11). Since the springs were formed because of the presence of dykes, in the mega-compartment, the Bank Eye and Venterspost Eye are removed from the model. Only the Oberholzer Eye is modelled using the 'Drain' package. It is also assumed that the pipes which divert the Wonderfonteinspruit will be removed and the river will flow again. Therefore the 'River' package is used over the river channel. Three recharge values are used over the whole model area in the new model, i.e., 1 x 10⁹, 2 x 10⁻⁹ and 4 x 10⁹ m/s. According to the calculation and modelling, it takes from 13 years and 7 months, with a high recharge rate of 4 x 10⁻⁹ m/s (equivalent to 18% of the annual precipitation), to 45 years and 6 months, with a low recharge rate of 1.0 x 10⁻⁹ m/s (equivalent to 4.5% of the annual precipitation), for the Oberholzer Eye to restart to flow. Then another 20 years are run for the system to reach steady state (Fig. 12). Unlike the compartmentalised re-watering models, the steady-state water levels depend on the recharge values used. Higher recharge values result in higher steady-state water levels. The head range of the re-watered water level in the mega-Compartment is between 1 471 m asl and 1 547 masl.
Over 10 observation boreholes are set in the rewatering model to monitor when the system would reach the steady state. In each recharge scenario, after specific time of rewatering, the water levels in those boreholes become stable which means the system reaches the steady state.
The procedures and results for the re-watering estimation in Venterspost, Bank, Oberholzer Compartments and the mega-compartment are listed in Table 2.
CONCLUSIONS
A toolbar, named GIS-PMWIN, has been developed in ArcGIS with VBA in order to link ArcGIS and PMWIN for effective groundwater modelling with GIS data. The following function modules are involved in carrying out the pre-processing for PMWIN:
• Module 1 - Model dimension
• Module 2 - Modify the current model
• Module 3 - Export the grid specification file
• Module 4 - Prepare and export the boundary condition files
• Module 5 - Set top and bottom elevation of layers
• Module 6 - Prepare and export matrix data
Each of the modules has been tested with simple datasets and was demonstrated to work correctly. All modules expect Module 2 were used in a case study on re-watering estimation for the Far West Rand of the Witwatersrand Basin. Two scenarios were simulated, i.e. compartmentalised and mega-compartment water rise, to represent the two extreme situations which could result depending on the integrity of the dykes which separated the aquifer into compartments. To obtain the starting conditions for the re-watering modelling, the pre-mining and dewatering periods are simulated and calibrated with recorded water level data. Re-watering estimation includes determining filling of the mine voids by calculation and determining recharge of the dewatered dolomite aquifer by modelling until a pre-mining condition (in the case of compartmental water rise) or a steady-state condition (in the case of a mega-compartment) is achieved. High, medium and low recharge values were used in each model to represent various recharge conditions. Modelling results show that the re-watering takes from less than 10 years to over 60 years for each compartment or the mega-compartment to reach the pre-mining condition or a steady state, depending on high, medium or low recharge scenarios.
All pre-processing work for each of the above models was done with GIS-PMWIN, which produces input data for PMWIN in a convenient and accurate way, especially when dealing with geometrically small but hydrogeologically significant features, such as rivers, faults or dykes.
GIS-PMWIN was developed with VBA (Visual Basic for Application) embedded in ArcGIS 9.3.1. In higher versions of ArcGIS than 10.0, VBA is removed completely but there are still optional packages available to support VBA. In the long run, the current toolbar could be updated to an 'Add-In' using the independent development software VB.Net, in which the existing codes can be modified with less effort.
ACKNOWLEDGEMENTS
The authors would like to acknowledge the Council for Geoscience, South Africa, for financial support (Annual Technical Project grant No. ST-2011-1133). The Department of Mineral Resources, South Africa, is acknowledged for funding of the Strategic Water Management Project (SWMP). The authors are also grateful to colleagues in the Water Geoscience Unit, Council for Geoscience, for their contributions and the anonymous reviewers for their constructive comments and recommendations.
REFERENCING
AQUAVEO (2013) GMS User Manual (v9.1) - The groundwater modelling system. AQUAVEO Water Modelling Solutions, URL: gmsdocs.aquaveo.com.s3.amazonaws.com/GMS_User_Manual v9.1.pdf (Accessed 25 June 2013). [ Links ]
CHIANG W (2005) 3D-Groundwater Modelling with PMWIN - A Simulation System for Modelling Groundwater Flow and Transport Processes (2nd edn.). Springer, Berlin. 397 pp. [ Links ]
FLEISCHER J (1981) The geohydrology of the dolomite aquifers of the Malmani Subgroup in the south-western Transvaal, Republic of South Africa. DWAF Technical Report No. GH 3169. Department of Water Affairs and Forestry, Pretoria. 243 pp. [ Links ]
FOSTER M (1988) The groundwater resources of the Far West Rand dolomitic groundwater compartments. DWAF Technical Report No. GH 3607. Department of Water Affairs and Forestry, Pretoria. 45 pp. [ Links ]
HODGSON F, USHER B, SCOTT R, ZEELIE S, CRUYWAGEN L and DE NECKER E (2001) Prediction techniques and preventative measures relating to the post-operational impact of underground mines on the quality and quantity of groundwater resources. WRC Report No. 699/1/01. Water Research Commission, Pretoria. [ Links ]
LUKAS E, FOURIE G AND HODGSON F (1995) The use of geographic information systems and other computer aided drafting facilities for the production of geohydrological maps. WRC Report No. 377/1/95. Water Research Commission, Pretoria. [ Links ]
McDONALD M and HARBAUGH A (1983) A modular three-dimensional finite-difference ground-water flow model. USGS Open-File Report 83-875. United States Geological Survey, Reston. [ Links ]
MIDDLETON B and BAILEY A (2009) Water Resources of South Africa, 2005 Study, Executive Summary. WRC Report No. TT 380/08. Water Research Commission, Pretoria. [ Links ]
MIDDLETON B and BAILEY A (2011) Water Resources of South Africa, 2005 Study, User's Guide. WRC Report No. TT 513/11. Water Research Commission, Pretoria. [ Links ]
MIDGLEY D, PITMAN W and MIDDLETON B (1994) Surface Water Resources of South Africa, Volumes I, II, III, IV, V and VI. WRC Reports No's. 298/1.1/94, 298/2.1/94, 298/3.1/94, 298/4.1/94, 298/5.1/94 and 298/6.1/94, Water Research Commission, Pretoria, South Africa. [ Links ]
RUMBAUGH J and RUMBAUGH D (1998) Guide to Using Ground-water Vistas, Version 2. Environmental Simulations, Inc. URL: http://www.geo.wvu.edu/~donovan/ftp/gwv.pdf (Accessed 18 June 2013). [ Links ]
SWART CJU, JAMES AR, KLEYWEGT RJ and STOCH EJ (2003) The future of the dolomitic springs after mine closure on the Far West Rand, Gauteng, RSA. Environ. Geol. 44 751-770. [ Links ]
WINDE F, STOCH EJ and ERASMUS E (2006) Identification and quantification of water ingress into mine voids of the West Rand and Far West Rand Goldfields (Witwatersrand basin) with a view to long-term sustainable reduction thereof. Final report, Project No. 5512, Council for Geoscience, Pretoria. 261 pp. [ Links ]
WHI (2006) Visual MODFLOW v.4.2 - User's Manual. Waterloo Hydrogeologic. URL: http://www.geo.tu-freiberg.de/hydro/vorl_portal/englisch_courses/ModFlow/VMOD_42_Manual.pdf (Accessed 20 July 2010). [ Links ]
 Correspondence:
Haili Lin
+27 12 841 1277; fax: +27 86 649 1555
e-mail: hjia@geoscience.org.za
Received 10 July 2013
Accepted in revised form 5 March 2014

