


Servicios Personalizados
Articulo
 Inglés (pdf)
 Articulo en XML
 Referencias del artículo
Indicadores

Links relacionados
-
 Citado por Google
 -
 Similares en Google
Compartir

 Permalink
Water SA
versión On-line ISSN 1816-7950
versión impresa ISSN 0378-4738
Water SA vol.40 no.2 Pretoria abr. 2014
Characterisation of fracture network and groundwater preferential flow path in the Table Mountain Group (TMG) sandstones, South Africa
Lixiang LinI; Haili LinI; Yongxin XuII
IWater Geoscience Unit, Council for Geoscience, P.B. X112, Silverton 0001, South Africa
IIDepartment of Earth Sciences, University of the Western Cape, P.B. X17, Bellville 7535, South Africa
ABSTRACT
Characterisation of fractured rocks and evaluation of fracture connectivity are essential for the study of subsurface flow and transport in fractured rock aquifers. In this study, we use a new method to present fracture networks and analyse the connectivity of the fractures, based on the technique of randomly-generated realisations. The application of the method aims to provide more detailed insights into the flow path and dynamics for sustainable utilisation of groundwater in the Table Mountain Group (TMG) aquifers, South Africa. Focusing on a representative wellfield in the TMG, the interpretation and integration of fracture data derived from field measurements, existing geological maps and remotely-sensed imagery, and observed responses of hydraulic tests, led to the development of a conceptual model for fracture network characterisation, which forms the basis of fracture connectivity analysis. The result shows that the a dominant number of the interconnected fractures are in the form of separated fracture clusters (networks) which is considered to be a common connectivity pattern in the TMG rocks and alike. The result also suggests that the connectivity pattern is collectively dependent on such factors as orientation, length, and density of fractures and implies that in a study domain only a small part of the fractures are responsible for flow circulation.
Keywords: fractured rock aquifer, conceptual model, preferential flow path, Table Mountain Group
INTRODUCTION
Understanding, describing, and quantifying groundwater flow and chemical transport in fractured rocks require effective approaches to characterising fracture media. The term fracture is used to refer to joints and faults, as well as varied discontinuities over different scales and lithologies due to crustal tectonic driving forces (Pollard and Aydin, 1988). Fractures may act as conduits or barriers to groundwater flow, depending on their geometric and physical properties; of these, the connectivity of fractures is a critical factor controlling subsurface flow and transport (Margolin et al., 1998).
Fracture connectivity is a measure of the interconnection of fractures and fracture networks. It controls the magnitude and distribution of hydraulic conductivity in the network and also in the larger fractured aquifer system. According to the National Research Council (1996, p. 395), 'Although the term connectivity has no generally accepted definition, it is normally used to describe the subjective appearance of a fracture network. Highly connected networks are more permeable.' Chiles and De Marsily (1993) point out that fluid flow through fractures requires connectivity; '.. .if the fractures are not connected or form small clusters, no flow is possible, whereas if the fractures are highly connected, the system behaves like a continuous medium'.
Over the past decade, many efforts have contributed to the investigation of fracture connectivity, with data derived from field tests, such as cross-hole hydraulic and tracer tests (Illman and Tartakovsky, 2005; Shapiro et al., 2007; National Research Council, 1996), borehole radar (Serzu et al., 2004) and seismic (Ellefsen et al., 2002) investigations. These in-situ techniques and associated interpretation models effectively provide insight into the relatively conductive zones, but are insufficient to depict the connectivity of fractures since more detailed investigation into the fracture network is often required for a given problem. The development of the discrete fracture network (DFN) model (Cacas et al., 1990) has led to high-resolution analysis and visualisation of fractured media to predict flow and transport properties. Such studies of fracture networks commonly require gathering data on fracture length, orientation, aperture, density, and connectivity, for developing statistical or determinative DFN models. However, because the connectivity of fractures, which plays a key role in the determination of groundwater flow path, is in any case not measurable in the field, this generally needs to be analysed with the aid of generated fractured networks. The study of fracture connectivity through randomly-generated fracture realities is largely based on the statistical features of fracture elements, such as orientation, length, density, etc. (Bradbury and Muldoon, 1994; Mo et al., 1998; Min et al., 2004).
In terms of the application of fracture data to the predictive estimation of hydrogeological properties, the development of predictive models has apparently been left behind by the development of analytical methods for fracture connectivity. When the statistical data for natural fractures are incorporated with other parameters such as aperture and roughness, the hydraulic properties of fracture networks can then be estimated (Mourzenko et al., 1999; Dreuzy et al., 2000; Park et al., 2002; Lin and Xu, 2006). However, most such applications for the determination of hydraulic properties assume that the study system is a well-connected fracture network. Percolation theory is often used to define the connectivity of a fracture network. The method of random fracture realisation applied to quantitatively determine the percolation threshold also assumes that at least one cluster of fractures is well connected, so as to allow flow to move from one side to the other (Berkowitz, 2002). Moreover, the determination of percolation threshold uniquely requires information on fracture number or density, which suggests that at times thousands of fractures might be involved in a flow system. In-situ borehole tests (Karasaki et al., 2000; Halihan et al., 2005) have shown that fractures developed in a rock mass are not always fully connected.
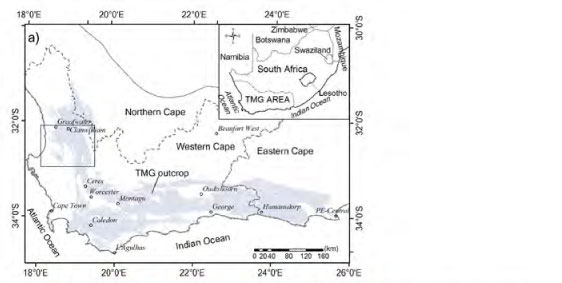
The objective of this paper is to develop an investigative approach aimed at the generation of random realisations and analysis of fracture connectivity based on the characteristics of the fracture network observed at a wellfield scale. As fault-bounded aquifers are currently the most common targets for water supply purposes in the Table Mountain Group (TMG) area, a representative site was selected around the Boschkloof wellfield (Fig.1a), where 5 boreholes, with depths ranging from 174-348 m, were drilled in 1998 for water supply to the Citrusdal Municipality, Western Cape, South Africa. In general, many efforts have been made in the past to investigate the characteristics of the TMG fractures that have a strong influence on aquifer properties (Woodford and Chevallier, 2002; Hartnady and Hay, 2002a). However, the study of fracture network characteristics that are especially related to ground-water flow path and dynamics at a wellfield scale is still limited. Therefore, characterisation of the TMG fractures at such a scale was done using remote-sensing interpretation, field identification of fracture networks, and analysis of observed drawdown during pumping tests, with the ultimate aim of developing a conceptual model that integrates all of the available data and information. If successfully applied, it is hoped that the model can help to generate a better understanding of the TMG fractured rock aquifers, and can be applied to similar aquifer systems and in turn be refined by further quantification of aquifer properties.
Site geology and groundwater observation
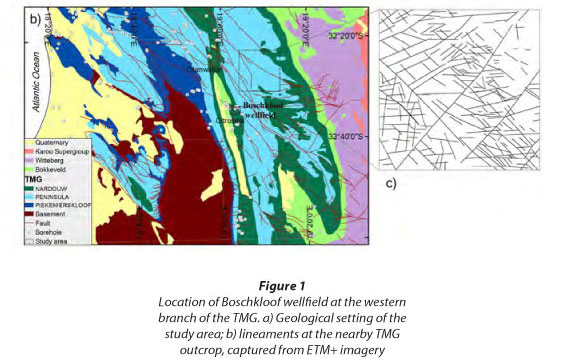
It was the success of the Boschkloof wellfield that triggered a call for a full study of the TMG groundwater occurrences. The wellfield, with an elevation of about 250 m, is located at the mouth of the deep, river-cut Boschkloof valley, some 5 km northeast of Citrusdal (Fig. 1a). The relief across the Boschkloof catchment shows altitudinal differences greater than 1 600 m. There are 5 boreholes located in the vicinity of a N-W trending fault that has been identified as a flow barrier extending for kilometres (Fig. 2), while similar settings are found for many other fault-bounded TMG aquifers (Maclear, 2001; Newton et al., 2006). The N-E trending fault evident in Fig. 2 is actually a lineament feature with unknown properties (Hartnady and Hay, 2002b). These boreholes penetrated the Peninsula formation of the TMG, which consists of a sequence of highly fractured quartzitic sandstones deposited in a marine environment, with a thickness ranging from 1 500 to 2 000 m (Rust, 1973; De Beer, 2002). Thin section studies have shown that, in the pure quartzitic sandstones from unfolded beds of the TMG, inter-granular pore spaces are completely filled by secondary quartz overgrowths, making these host rocks nearly impermeable (Halbich and Cornell, 1983; De Beer, 2002). It is only where they are fractured by folding, and/or faulting, that the rocks develop a secondary porosity and become fractured aquifer media; this suggests that both groundwater flow and storage are dominated by various-scale fractures in the TMG.
In previous studies (Rosewarne, 2002; Kotze, 2002), characterisation of the TMG fractured aquifers and associated groundwater flow was largely based on a perspective of large-scale stratigraphy and geological structure, incorporated with the interpretation of hydraulic tests and other field observations such as water strikes during drillings. This was the case for the Boschkloof wellfield. During borehole drilling, the blow yield of the boreholes was reported to be tremendously high, as compared with other wellfields developed in the TMG, especially in Boreholes BK1 and BK4, theyield values of which were estimated at 95 ℓ/s and 120 ℓ/s, respectively. Characterisation of the site and interpretation of hydraulic testing was reported by Hartnady and Hay (2002b). The focus of this study is to conceptualise the fracture network based on the previously-reported data described above and newly acquired information.
METHOD OF FRACTURE DATA COLLECTION AND ANALYSIS
Ideally, fracture data should be gathered on fracture elements, i.e. length, orientation, aperture, and density, for developing a statistical model. Distribution patterns of such elements are very useful for the study of fractured rock aquifers (Kulatilake and Panda, 2000). In the case where measurement of fracture lengths and orientations on the surface is unable to yield sufficient data, remote-sensing techniques are sometimes useful, especially for fracture length. A quantitative analysis was carried out to determine the distribution of lineament orientations and lengths in the vicinity of the Boschkloof wellfield (Fig. 1b). In the TMG areas, most of the fracture element data can be adequately collected at road cuts, quarries, and bare-rock outcrops, with the exception of fracture length which is sometimes difficult to accurately trace, as in many cases the fractures are partly buried by soils and vegetation. In order to have a sufficient number of representative measurement samples, the size of measurement sites is often required to be more than 60 m in either length or width, at good sandstone outcrops. In the case of insufficient samples, the statistical pattern of fracture elements can be determined with the supplemental data captured from satellite imagery.
Application of remotely-sensed data
As groundwater is not readily perceptible from remote-sensing data, surface indicators have to be used to infer the subsurface condition, which determine groundwater occurrence. Lineaments captured from imagery often provide a crucial clue on the interpretation and analysis of fractured rocks and associated groundwater flow regimes. The main assumption that underlies all lineament analyses is that the linear features, when properly identified, represent the surface manifestations of the transmissive fracture framework of low-permeability rocks (O'Leary et al., 1976; Waters et al., 1990; Degnan et al., 2002). Lineaments are usually characterised by azimuth and length distributions, length density (total length of lineaments per unit area), frequency (total number of lineaments per unit area), and intersection point density (total number of lineament intersection points per unit area). Preparation of a lineament map is hence important for groundwater studies in fractured rocks, especially when the lineament map is incorporated into other pertinent maps via GIS integration.
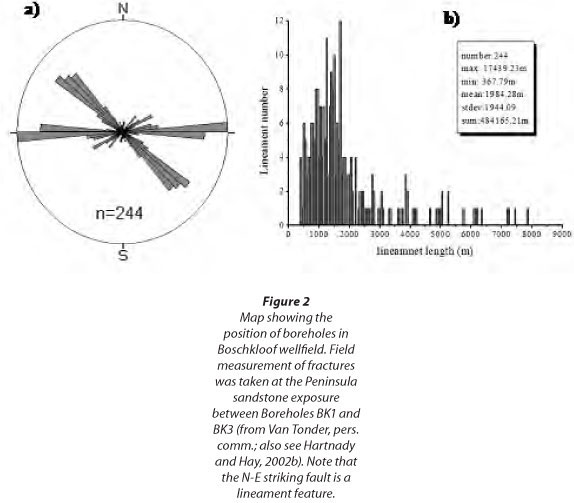
As lineament analysis requires the location and distribution of lineaments that represent the fracture-correlated features, the study area chosen needs to have very good rock exposures on images. The area selected for this study, with an area of 225 km2, is situated in the northeastern section of the wellfield, comprising a series of folds and faults extending NW-SE, NE-SW and approximately W-E. Meaningful interpretation of lineaments that are associated with the structural framework is largely dependent on the quality of imagery, acquaintance with the area's background, and the approach to acquiring lineament data. In this study, lineament mapping was done using Landsat ETM+ imagery (UTM zones: S-34-30) that covers the western half of the TMG area. The existing lithostratigraphic, geomorphologic, and structural geology information were also used for reference during mapping. The imagery comprises 7 multi-spectral bands and 1 panchromatic band. It had already been linearly enhanced and projected before being uploaded to the GIS software. In comparison with conventional aerial photography (1/50,000), the imagery has better spatial resolution, suitable to trace lineaments with 65-m minimum length (approximately twice the spatial resolution). To enhance the confidence of lineament interpretation, multiple interpreters were employed for the lineament tracing process. The data from various interpreters were carefully compared and then combined to one shape file. In the meantime, each of the lineaments was identified, in order to avoid capturing the non-fracture-correlated lineaments as much as possible. The major problem encountered during lineament tracing using the images was the sun azimuth effect (Woodford and Chevallier, 2002), which created a bias toward north-eastern striking lineaments. After the mapping was done, each lineament length and orientation was computed for the distribution analysis.
Lineaments characterised by azimuth and length were computed with an exhaustive method using Visual Basic for Application (VBA) scripts developed in ArcMap. The result of directional analysis showed that there are 3 principal striking directions in the area: NW-SE, NE-SW, and approximately E-W (Fig. 3a). It is well known that fracture length has a significant impact on the connectivity of a fracture network. Kulatilake et al. (2003) suggest, based on probability analysis with data derived from field measurements in gneiss rock masses, that lognormal, gamma, and exponential distributions are the best models to characterise semi-trace lengths of fractures. An exponential distribution of fracture trace-length was applied by Park et al. (2002) to study hydraulic properties in granite. On a microscopic scale, the filamentary fracture, with few long fractures, tends to have a lognormal distribution, based on the results of X-ray scanning of core samples (Pyrak-Nolte et al., 1997). In fact, not only the lithologies over which the fractures develop, but also the methods of fracture scanning and length computation, have a large influence on the computed length distribution pattern.
In this study, the length of lineaments was computed using multiple points along each tracing line, to avoid the inaccuracy of using the straight-line length determined between only 2 points.. The calculation of lineament length was done using a VBA script developed in ArcMap. The length of 244 interpreted lineaments ranged from 367 m to 17 439 m. Figure 3b appears to have a lognormal distribution, with a mean value of 1 984 m and standard deviation of 1 944 m. This distribution pattern is thought to prevail in the TMG sandstone terrain, regardless of the size of the selected area. Based on the universal similarity of fracture systems at different scales, this distribution pattern can probably be applied to the smaller-scale fracture systems, especially where difficulty is encountered, particularly on weathered surfaces, in acquiring sufficient trace-length data to represent the statistical population of fractures.
Fracture field measurement
The fracture measurements carried out on medium to large scales by means of remote-sensing imagery interpretation and statistics are intended to draw out the framework of the fracture network for fractures with a length of more than 60 m. If properly interpreted, fractures with dimensions larger than site scale (above the cut-off of 60 m) can be represented in a 2D space. This is obviously an effective approach to presenting the backbone of fracture systems in a specific region where the rocks are well exposed. However drawbacks inevitably arise due to the varying quality of outcrops and the misinterpretation of fractures when the lineaments are not actually controlled by fractures. In this case, the results of imagery interpretation need to be confirmed by fieldwork. Furthermore, fracture data from site surveys and field measurements needs to be analysed statistically to enable the characterisation of the fractured rocks and subsequently to derive information on hydraulic conductivity, by properly organising the data measured at a site.
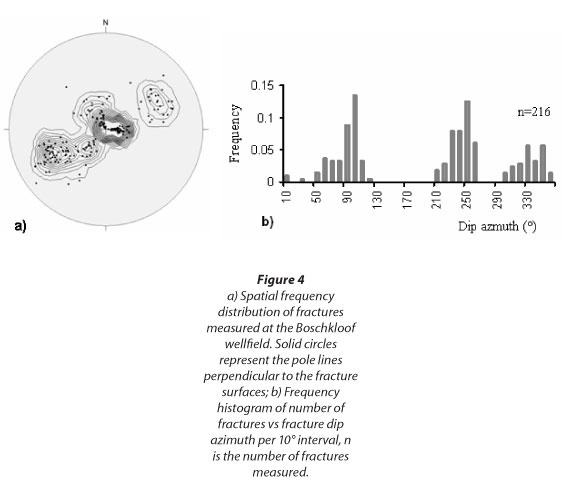
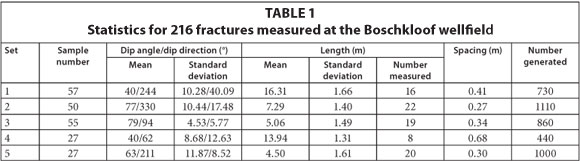
The site selected for the detailed field survey of fractures at a much smaller scale was located on the Peninsula sandstone exposure between Borehole BK1 and Borehole BK3 (Fig. 2), where dip azimuth and dip angle, spacing, and some apertures were examined and measured. Statistics on fracture geometry at the site were used to analyse the distribution of these parameters and form a solid basis for the study of aquifer properties associated with fracture networks. It is well established that fracture length often obeys a lognormal distribution, as shown by the data captured from satellite imagery, especially when few long fracture lineaments are involved (Kulatilake et al., 2003). In the TMG cases, the fracture data measured at selected sites generally showed that there are 3 to 5 sets of fractures, including bedding planes and structural fractures. Figure 4 shows the statistical variation of the orientation and density of 216 measured fractures at the Boschkloof wellfield. According to the field measurements, the bedding planes trend to the southwest, from 230° to 260°, with dipping angles ranging from 20° to 60°, while 4 sets of structural fractures are identified having average trends of N30W (30° west of north), S86E, N62E, and S41W, with average dips of 77°, 79° , 40° and 77°, respectively. Figure 4 also suggests that the orientation of each set of fractures roughly follows a normal distribution, which is quite similar to the results from the lineament statistics. Fracture density, which is dependent on fracture spacing, is assumed to be uniformly distributed, as only one type of rock material, i.e., Peninsula sandstone, is involved in the aquifer system; however, density could vary between different rock formations.
RESULTS
Based on the assumption that groundwater in the TMG sandstones is circulated through fracture networks, and in light of the field evidence, fractures were generated with the data derived from field measurements and remote sensing. This realisation is used to present, at a site scale, the geometric interconnection of fractures with length ranging from meters to tens of meters, and subsequently to yield a conceptual model that may be applied to the study of aquifer properties.
An approach to fracture realisation
Generating fracture realisations is conducted using a random process, based on the distributions of fracture elements which can be sampled and summarised from field or site measurement data. Fundamental elements include fracture orientation (strike, dip azimuth and dip angle), fracture length, and distance (spacing), for each set of fractures; the number of fractures measured needs to be large enough to represent the population of fractures at the measurement site.
As discussed above, fracture orientation follows a normal distribution. A lognormal distribution is adopted for fracture length based on the data from remote sensing and consideration of the similarity of fractures at various scales. Since it is extremely difficult to obtain enough trace-length data from measurement on the TMG sandstone exposure, the number of fracture lengths is 62 but not 216 in this study.
Random realisation of fractures is processed on the basis of statistical data for each fracture set. With respect to the number of each fracture set, many key studies using the discrete fracture network (DFN) model tend to increase fracture numbers in the realisation process and meet a critical density value to obtain a well-connected network for the study of connectivity. However, such a method of fracture generation at a domain scale amplifies the uncertainty of the statistical results derived from the samples fractures or interpreted imagery at a measurement scale. In this study, as an alternative to using an uncertain number of fractures in each fracture set, the number of fractures is determined by their spacing in a domain, and the position of fractures is accordingly assumed to be uniformly distributed.
Based on statistical features of the fracture data, it is possible to use the 'random number generation' function in Excel to geometrically generate the fractures on the surface and across the profile. The fracture data generated in Excel is then uploaded to ArcGIS where the graphical process is conducted using a VBA script developed in ArcGIS; geometric connectivity analysis is also done in ArcGIS automatically.
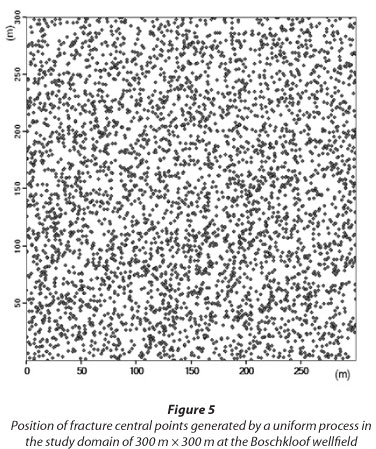
The realisation of fractures on a 2D plane (on the surface) only requires the input of stochastically-generated data for fracture strike, length and density (for the number of fracture sets). In order to avoid the boundary effect, central coordinates (x, y) should be used to position each fracture during the generating process (Fig. 5).
It is acknowledged that groundwater flow in the fracture system is not a 2D problem, but a 3D one, which requires presenting the fracture media not only on 2D plans but also on 2D profiles. This can be achieved by generating fractures with data on fracture elements such as length, dip angle and density.
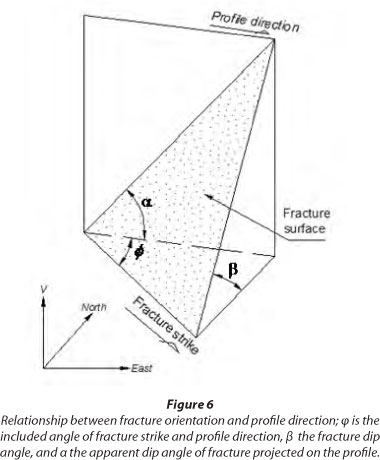
However, unlike the realisation of fractures on a 2D plan, the real dip angle of each fracture needs to be projected on the profiles with different strikes (direction) before it is generated. Figure 6 illustrates the projection from a real dip angle (β) to an apparent one (α), which can be performed using the following relationship:

where:
φ (φ = 0°~90°) is the included angle of profile strike and fracture strike.
In the meantime, fracture length is modified as well, by assuming the fracture takes a rectangular shape with an aspect (length/width) ratio of 1.5:1, while rotation of the profile does not have a major impact on the change in fracture length on the profile.
Application to the field
Table 1, Fig. 3, and Fig. 4 collectively show the basic fracture data results from field measurement on the Peninsula sandstone exposures between Boreholes BK1 and BK3, where a total number of 216 fractures, about 5.2% of the fractures to be generated (Table 1), were examined. Five sets of fractures were identified and parts of their length measured. In Table 1, Set 1, representing bedding fractures, and Set 4, representing the structural fractures, have relatively gentle dip angles and lower density compared with the other three sets. Steeply dipping fractures of Sets 2, 3 and 5 appear to predominate in the sandstone because of their relatively low spacing distance and thus high density distribution. It should be pointed out that the fracture trace-length collected at the site ranges from 1.9 m to 35 m and consequently this study can be defined as a site-scale study.
Fracture realisation is based on the statistical and parameter distribution of each fracture element as previously discussed. Fractures are generated in a study domain of 300 χ 300 m2, on both 2D plan and 2D profiles with various profile directions. It is expected to present the fracture networks on this site scale because both the borehole depths are less than 350 m and the lower limit of the main water strike is at the depth of 294 m in Borehole BK4.
The geometric nature of the fractures may be different at depth, as discussed by Shapiro et al. (2007), due to the difference in lithology and stress state of fractures. For the realisation of fractures on 2D profiles, based on the core sample study at the adjacent Rietfontein site (Lin et al., 2007), it is necessary to propose the assumption that fracture orientation and density do not change much at depth in the locally homogeneous Peninsula sandstone.
Fracture connectivity pattern
Similarly to many other stochastic studies, the generation of fractures on both the 2D plan and profiles aims to represent the assemblage of fractures in a statistical way, which does not reflect the actual position of the natural fractures because of the use of random coordinates. Therefore, each generated domain reflects the mode of fracture occurrence and the connectivity pattern that is embedded in the features of natural fractures.
The result of model application with data derived from field measurement at the Boschkloof site is shown in Fig. 7, which is a plan view of these fractures where 4 profiles with strikes ranging from NE40° to NE80° are positioned for the fracture realisation on 2D profiles. The intention of fracture realisation on multiple profiles is to comparatively analyse the connectivity pattern, which may help to explain some unique flow phenomena of the fractured rock aquifer. This will enable the establishment of a site-scale conceptual model for the studies of aquifer properties and borehole hydrogeological conditions in a statistical way, for example, determining the aquifer hydraulic properties which can be applied to groundwater modelling, or effectively using a contour map of borehole water levels to present the groundwater flow direction at a local or even regional scale.
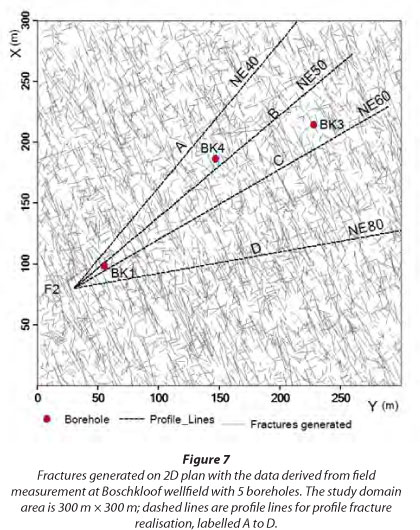
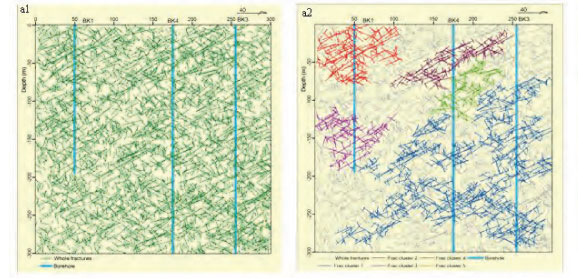
Figure 8 shows that the realisation results include both the entire fractures (Fig. 8A1~D1) and the relatively large clusters with interconnected fractures (Fig. 8B2-D2), together with 3 boreholes projected on 4 neighbouring profiles with the strike azimuth intervals of 10° to 20°. In this figure, Profiles A, B, and C are close to Boreholes BK1 BH4 and BK3, while Profile D is relatively distant from the groundwater boreholes (Fig. 7). It is clear that the interconnected fractures on each profile collectively show a mode of separated fracture clusters which commonly reveal an anisotropic feature of the fracture networks. It also suggests that the profile direction has an impact on the connectivity pattern in terms of the size and plunge of the fracture clusters. Furthermore, the generated fractures in Fig. 8 commonly show that the largest cluster with interconnected fractures on each domain does not break through the boundary of the domains either from the bottom to the top or from the left to the right (Fig. 8 A2, B2, and C2). This suggests that the fracture connectivity is mainly dependent on the factors such as orientation, length, and density of fractures, which implies that only a portion of the fractures may be involved in a flow system. For example, on Profile B the number of interconnected fractures from Cluster 1 to Cluster 5 is 954, 127, 224, 99, and 167, respectively, accounting for 23%, 3.1%, 5.4%, 2.4%, and 4.1% of the 4 140 fractures in total.
The connectivity pattern does help to explain the existence of multiple water strikes or multiple conductive zones in a borehole, as groundwater might originate from different fracture systems (clusters) without hydraulic connection. However, the validity of the connectivity pattern needs to be confirmed with the results from field observation. From borehole observations, the phenomena of multiple water strikes or several conductive intervals in a borehole, or no hydraulic communication taking place between the holes in a wellfield, are common in the TMG sandstone aquifers. In the Boschkloof wellfield, for instance, at least two conductive intervals were identified in Borehole BK3 and Borehole BK4 (but only one in Borehole BK1), while Borehole BK2 appeared to be isolated from the other three. Moreover, it was observed that the groundwater in BK1, with the major water strike at 98.7 m amsl, and in BK4, with the major strike at 30.3 m amsl, was connected (Hartnady and Hay, 2002b). The distance between BK1 and BK4 is 127.4m, from which it is likely that the north-easterly plunge of the conductive zone is 28°. This value falls within the set of fractures (Set 4) with dip angles ranging from 20° to 52°, and the length of the fractures within this set is less than that of the bedding fractures (Table 1). Field observation (Hartnady and Hay, 2002b) also showed that groundwater in Borehole BK3 is not necessarily connected to that in the other two boreholes, even though they were sited along the fault line (Fig. 2).
In respect of the observations of drawdown against time during the constant discharge (CD) pumping tests conducted at Borehole BK1 and Borehole BK4, the discharge rate matched the observed magnitude of blow yields from the boreholes during percussion drilling, it was found that the drawdown curves for the two boreholes are of different types (Fig. 9). Drawdown observed in BK1 during the CD test is very close to that of Theis flow, whereas drawdown in BK4 shows a stepwise mode. Based on the drawdown curves it appears that the groundwater originates from two aquifer systems with different characteristics; however, there is hydraulic connection between the boreholes as mentioned above.
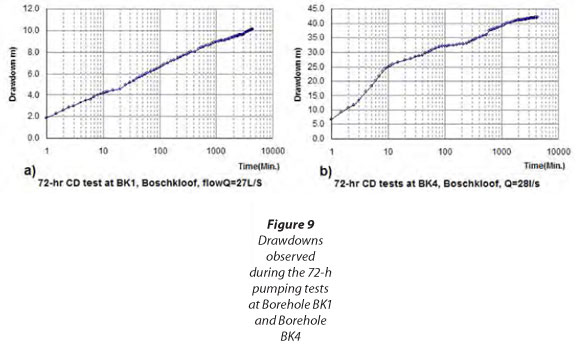
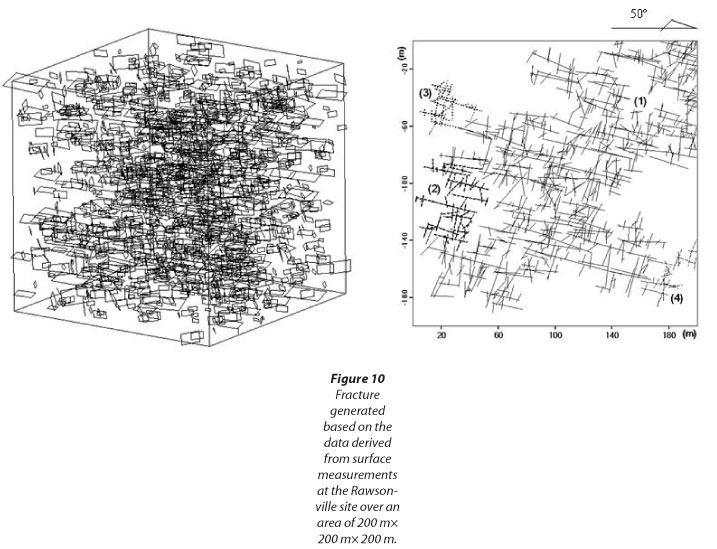
The stepwise mode of drawdown is common in the TMG sandstones and many other fractured rock aquifers in South Africa (Van Tonder et al., 2001), and is often explained as being set off by multiple boundary effects. This is true if only one flow system is intercepted by a borehole. When a borehole like BK4 intercepts at least two fracture conductive zones, the question arises as to whether the stepwise drawdown is attributed to simultaneously dynamic response of these two flow systems to the external pumping stress. On one profile, it is noted that the multiple fracture realisations using the same statistical data do not change the mode of clusters with interconnected fractures, which suggests that the stability of the clusters is extremely high. On a single site, the connectivity patterns vary in different directions, as has been discussed above, which shows the potential of preferential flow paths in the study domain and implies the necessity of studying groundwater problems in three dimensions. From site to site, the pattern of fracture connectivity varies, particularly the size of clusters with interconnected fractures, which is additionally shown by the results derived from the Rietfontein (Lin et al., 2007) and Rawsonville sites (Fig. 10).
DISCUSSION AND CONCLUSION
The significance of fractures in controlling groundwater flow in hard rock has long been discussed. Most of the current methods used for quantifying groundwater flow in fractured rock aquifers are based on the assumption that groundwater flows through a geological continuum (Wang et al., 2002). These methods are generally applicable to porous media, but have limited applicability when groundwater circulates through highly anisotropic fractures or fracture networks. Field observations show that there is seldom a uniform groundwater level from site to site. In this case, the borehole water levels and the interpolated contour map cannot be used to characterise a meso- to large-scale groundwater flow system. Even at a single wellfield with a scale of 100 m, groundwater in one borehole could have no hydraulic relationship with another. For example, at the Boschkloof site in this study, the Malkoppan site at Lambert's bay and the Gevonden site at Rawsonville, some of the nearby monitoring boreholes do not respond to the water level drop at the pumping holes. Groundwater occurring in fractured rocks, such as the TMG sandstones, mainly flows via the connected fracture networks; flow is controlled by the fracture geometry and associated hydraulic properties. In the absence of fracture information, especially connectivity, it is extremely difficult to investigate the aquifer responses to hydraulic stresses and further to perform an analysis on the aquifer properties.
Based on previous studies, the characterisation of the TMG fracture media at a wellfield scale was done in this research by interpreting the existing geological data and remote sensing imagery, identifying fracture networks in the field, and analysing pumping test data. A conceptual model for fracture network characterisation was developed on the basis of random generation of fracture realities by summarising the statistical distribution of fracture data derived from field measurement and imagery analysis, from which the fracture connectivity pattern can be studied with groundwater observations. This model intends to provide a general approach to study the fractured rock media in terms of groundwater occurrence. The application of this model in the TMG aquifers helps to enhance the understanding of the TMG fractured rock media and to provide more detailed insight into the potential flow path of the groundwater.
In the present study, graphical presentation and connectivity analysis on the fractures shows that a dominant number of the interconnected fractures are in the form of separated fracture clusters (networks). Very few of the connected networks eventually break through a study domain as postulated in many other FND models. Such connectivity pattern does help to explain the occurrence of multiple water strikes or conductive zones where groundwater is coming from different fracture systems probably without natural hydraulic connection other than the intercepting borehole. This leads to the conclusion that merely a small portion of fractures at a well-field scale are probably involved in a flow system. This conclusion, drawn from the analytical models, has been verified by many other field observations in the TMG aquifers. The abovementioned connectivity pattern of fracture networks is hence considered to be common in the TMG sandstones, especially where the hard rocks are exposed and not confined by overlaying geological formations.
ACKNOWLEDGEMENTS
The authors are grateful to the Water Research Commission (WRC) of South Africa for providing financial support to the study and permission to publish the data. Many thanks are given to Mr Leslie Strachan for his advice and contributions to the revision of this paper. The result of this study forms part of current groundwater research efforts jointly sponsored by the WRC and Council for Geoscience.
REFERENCES
BERKOWITZ B (2002) Characterizing flow transport in fractured geological media: A review. Adv. Water Resour. 25 861-884. [ Links ]
BRADBURY KR and MULDOON MA (1994) Effect of fracture density and anisotropy on delineation of wellhead protection area in fractured-rock aquifers. Appl. Hydrogeol. 94 (3) 17-23. [ Links ]
CACAS MC, LEDOUX E, DE MARSILY G, TILLIE B, BARBREAU A, DURAND E, FEUGA B and PEAUDECERF P (1990) Modeling fracture flow with a stochastic discrete fracture network: calibration and validation 1, the flow model. Water Resour. Res. 26 (3) 479-489. [ Links ]
CHILES J-P and DE MARSILY G (1993) Stochastic models of fracture systems and their use in transport modeling In: Bear J, Tsang C-F and De Marsily G (eds.) Flow and Contaminant Transport in Fractured Rock. Academic Press, New York. 204-207. [ Links ]
DE BEER CH (2002) The stratigraphy, lithology and structure of the Table Mountain Group. In: Petersen K and Parsons R (eds.) A Synthesis of the Hydrogeology of the Table Mountain Group -Formation of a Research Strategy. WRC Report No. TT 158/01. Water Research Commission, Pretoria. 9-18. [ Links ]
DEGNAN JR, CLARK SF jr. (2002) Fracture-correlated lineaments at Great Bay, Southwestern New Hampshire. USGS open-file report 02-13. United States Geological Survey, Reston. 14 pp. [ Links ]
DREUZY JR, DAVY P and BOUR O (2000) Percolation parameter and percolation-threshold estimates for three-dimensional random ellipses with widely scattered distributions of eccentricity and size. Phys. Rev. 62 (5) 5948-5952. [ Links ]
ELLEFSEN KJ, HSIEH PA and SHAPIRO AM (2002) Crosswell seismic investigation of hydraulically conductive, fractured bedrock near Mirror Lake, New Hampshire. J. Appl. Geophys. 50 299-317. [ Links ]
HÄLBICH IW and CORNELL DH (1983) Metamorphic history of the Cape Fold Belt, [ Links ] in: Sohnge APG and Halbich IW (eds.) Geodynamics of the Cape Fold Belt. Spec. Publ. Geol. Soc. S. Afr. 12 131-148. [ Links ]
HALIHAN T, LOVE A and SHARP JM (2005) Identifying connections in a fractured rock aquifer using ADFTs. Ground Water 43 (3) 327-335. [ Links ]
HARTNADY CH and HAY ER (2002a) Fracture system and attribute studies in Table Mountain Group groundwater target generation. In: Petersen K and Parsons R (eds.) A Synthesis of the Hydrogeology of the Table Mountain Group - Formation of a Research Strategy. WRC Report No. TT 158/01. Water Research Commission, Pretoria. 89-94. [ Links ]
HARTNADY CH and HAY ER (2002b) Boschkloof groundwater discovery. In: Petersen K and Parsons R (eds.) A Synthesis of the Hydrogeology of the Table Mountain Group - Formation of a Research Strategy. WRC Report No. TT 158/01. Water Research Commission, Pretoria. 168-177. [ Links ]
ILLMAN WA and TARTAKOVSKY DM (2005) Asymptotic analysis of cross-hole hydraulic tests in fractured granite. Ground Water 44 (4) 555-563. [ Links ]
KARASAKI K, FREIFELD B, COHEN A, GROSSENBACHERB K, COOK P and VASCO D (2000) A multidisciplinary fractured rock characterization study at Raymond field site, Raymond, CA. J. Hydrol. 236 (1-2) 17-34. [ Links ]
KOTZE JC (2002) Towards a Management Tool for Groundwater Exploitation in the Table Mountain Sandstone Fractured Aquifer. WRC Report No. 729/1/02. Water Research Commission, Pretoria. [ Links ]
KULATILAKE PHSW and PANDA BB (2000) Effect of rock block and joint geometry on jointed rock hydraulics and REV. ASCE J. Eng. Mech. 126 (8) 850-858. [ Links ]
KULATILAKE P, JEONG-GI UM, WANG M, ESCANDON R and NARVAIZ J (2003) Stochastic fracture geometry modeling in 3-D including validations for a part of Arrowhead East Tunnel, California, USA. Eng. Geol. 70 131-155. [ Links ]
LIN L and XU Y (2006) A tensor approach to the estimation of hydraulic conductivities in Table Mountain Group aquifers of South Africa. Water SA 32 (3) 371-378. [ Links ]
LIN L, JIA H and XU Y (2007) Fracture network characteristics of a deep borehole in the Table Mountain Group (TMG), South Africa. Hydrogeol. J. 15 (7) 1231-1437. [ Links ]
MACLEAR LGA (2001) The hydrogeology of the Uitenhage Artesian Basin with reference to the Table Mountain Group Aquifer. Water SA 27 (4) 499-505. [ Links ]
MARGOLIN G, BERKOWITZ B and SCHER H (1998) Structure, flow, and generalized conductivity scaling in fracture networks. Water Resour. Res. 34 (9) 2103-2121. [ Links ]
MIN KB, RUTQVIST J, TSANG CF and JING L (2004) Stress-dependent permeability of fractured rock masses: a numerical study. Int. J. Rock Mech. Min. Sci. 41 1191-1210. [ Links ]
MO H, BAI M, LIN D and ROEGIERS JC (1998) Study of flow and transport in fracture network using percolation theory. Appl. Math. Model. 22 277-291. [ Links ]
MOURZENKO VV, THOVERT JF and ADLER PM (1999) Percolation and conductivity of self-affine fractures. Phys. Rev. 59 (4) 4265-4284. [ Links ]
MULDOON M and BRADBURY KR (2005) Site characterization in densely fractured dolomite: comparison of methods. Ground Water 43 (6) 863-876. [ Links ]
NATIONAL RESEARCH COUNCIL (COMMITTEE ON FRACTURE CHARACTERIZATION AND FLUID FLOW) (1996) Rock fractures and fluid flow: contemporary understanding and applications. URL: http://www.nap.edu/openbook.php?isbn=0309049962&page=459. National Academy Press, Washington DC. 29-35. [ Links ]
NEWTON AR, SHONE RW and BOOTH PWK (2006) The Cape Fold Belt. In: Johnson MR, Anhaeusser CR and Thomas RJ (eds.) The Geology of South Africa. Geological Society of South Africa, Pretoria. 521- 530. [ Links ]
O'LEARY DW, FRIEDMAN JD and POHN HA (1976) Lineament, linear, lineation: some proposed new word standards for old terms. Geol. Soc. Am. Bull. 87 1463-1469. [ Links ]
PARK BY, KIM KS, KWON S, KIM C, BAE DS, HARTLEY LJ and LEE HK (2002) Determination of the hydraulic conductivity components using a three-dimensional fracture network model in volcanic rock. Eng. Geol. 66 127-141. [ Links ]
POLLARD DD and AYDIN A (1988) Progress in understanding jointing over the past one hundred years. Geol. Soc. Am. Bull. 100 1181-1204. [ Links ]
PYRAY-NOLTE LJ, MONTEMANGO CD and NOTLE DD (1997) Volumetric imaging of aperture distribution in connected fracture networks. Geophys. Res. Lett. 24 (18) 2343-2346. [ Links ]
ROSEWARNE P (2002) Hydrogeological characteristics of the Table Mountain Group aquifers. In: Petersen K and Parsons R (eds.) A Synthesis of the Hydrogeology of the TMG: Formation of a Research Strategy. WRC Report No. TT 158/01 33-44. Water Research Commission, Pretoria. [ Links ]
RUST IC (1973) The evolution of the Palaeozoic Cape basin, southern margin of Africa. In: Nairn AEM and Stehli FG (eds.) The Ocean Basins and Margins, Volume 1. The South Atlantic. Plenum, New York. 247-276. [ Links ]
SHAPIRO AM, HSIEH PA, BURTON WC and WALSH GJ (2007) Integrated multi-scale characterization of ground-water flow and chemical transport in fractured crystalline rock at the Mirror Lake Site, New Hampshire. In: Subsurface Hydrology: Data Integration for Properties and Processes. Geophys. Monogr. Series 171 201-225. [ Links ]
SERZU MH, KOZAK ET, LODHA GS, EVERITT RA and WOODCOCK DR (2004) Use of borehole radar techniques to characterize fractured granitic bedrock at AECL's Underground Research Laboratory. J. Appl. Geophys. 55 137-150. [ Links ]
VAN TONDER GJ, BOTHA JF and VAN BOSCH J (2001) A generalized solution for step-drawdown tests including flow dimension and elasticity. Water SA 27 (3) 345-354. [ Links ]
WANG M, KULATILAKE PHSW, UM J and NARVAIZ J (2002) Estimation of REV size and three-dimensional hydraulic conductivity tensor for a fractured rock mass through a single well packer test and discrete fracture fluid flow modelling. Int. J. Rock Mech. Min. Sci. 39 887-904. [ Links ]
WATERS PG, SMART PL and OSMASTON H (1990) Application of remote sensing to groundwater hydrology. Remote Sens. Rev. 4 223-264. [ Links ]
WEAVER JMC, TALMA AS and CAVE LC (1999) Geochemistry and isotopes for resource evaluation in the fractured rock aquifers of the Table Mountain Group. WRC Report No. 481/1/99. Water Research Commission, Pretoria. [ Links ]
WOODFORD AC and CHEVALLIER L (2002) Regional characterization and mapping of Karoo fractured aquifer systems - an integration approach using geographical system and digital image processing. WRC Report No. 653/1/02. Water Research Commission, Pretoria. 40-55. [ Links ]
 Correspondence:
Lixiang Lin
+27 12 841 1453
e-mail: llin@geoscience.org.za
Received 28 June 2012
Accepted in revised form 18 March 2014

