


Services on Demand
Article
 English (pdf)
 Article in xml format
 Article references
Indicators

Related links
-
 Cited by Google
 -
 Similars in Google
Share

 Permalink
Water SA
On-line version ISSN 1816-7950
Print version ISSN 0378-4738
Water SA vol.40 n.2 Pretoria Apr. 2014
Use of the FAO AquaCrop model in developing sowing guidelines for rainfed maize in Zimbabwe
Teddious MhizhaI; Sam GeertsII; Eline VanuytrechtII; Amos MakarauIII; Dirk RaesII
IDepartment of Physics, University of Zimbabwe, Mount Pleasant Drive, Harare, Zimbabwe
IIDivision of Soil and Water Management, K.U. Leuven University, Celestijnenlaan 200E, 3001 Leuven, Belgium
IIIMeteorological Services Department, P.O. Box BE150, Belvedere, Harare, Zimbabwe
ABSTRACT
This paper presents a procedure in which the water-driven water productivity model AquaCrop was fine-tuned and validated for maize for the local conditions in Zimbabwe and then applied to develop sowing management options for decision support. Data from experiments of 2 seasons in Harare and from 5 other sites around Zimbabwe were used for the local calibration and validation of AquaCrop. Model parameters such as the reference harvest index (HIo); the canopy growth coefficient (CGC); early canopy decline and normalised biomass water productivity (WPb*) were adjusted during model calibration. Model performance was satisfactory after calibration with a Nash-Sutcliffe model efficiency parameter (EF = 0.81), RMSE = 15% and R2 = 0.86 upon validation. To develop sowing guidelines, historical climate series from 13 meteorological stations around Zimbabwe were used to simulate maize yield for 6 consecutive sowing dates determined according to criteria applicable in Zimbabwe. Three varieties and typical shallow and deep soil types were considered in the simulation scenarios. The simulated yield was analysed by an optimisation procedure to select the optimum sowing time that maximised long-term mean yield. Results showed that highest yields depended on the climate of the site (rainfall availability), variety (length of growing cycle) and soil depth (soil water storage capacity). The late variety gave higher mean yields for all sowing dates in the maize belt. Staggered sowing is recommended as a way of combating the effects of rainfall variability and as an answer to labour constraints.
Keywords: biomass water productivity, AquaCrop, maize sowing dates, crop modelling
INTRODUCTION
The global population is projected to continue on an upward trend (FAO, 1996; Mpande and Tawanda, 1998), more so in sub-Saharan Africa where food deficit is already a significant challenge (Pinstrup-Andersen et al., 1999). Competing demands for both freshwater and land use, such as from industry and municipalities, as well as environmental problems such as pollution, will limit future extension of both freshwater for irrigation and the cultivated land area. With limited room for expansion of both agricultural land and the irrigated portion of the arable land (Rockström and Baron, 2007), additional food production will have to come from intensification of production in rainfed farming systems. Rockström et al. (2003) showed that it is possible to at least double rainfed staple food production by producing more 'crop per drop' of rainwater. It is therefore necessary to explore ways of increasing water use efficiency in rainfed agricultural systems.
Climate variability has been identified as the major constraint to agricultural productivity in southern Africa, and hence reducing the risk associated with climate variability has a high potential for increasing productivity in Zimbabwe (Phillips et al., 1998). Despite commanding a large share of the annual grain output, rainfed production of maize in Zimbabwe is largely unstable (Mhizha, 2010). The fluctuations echo in the availability of food in the country, often with a telling effect on the economy as resources are channelled towards securing food to avert starvation, resources which would have otherwise gone to other economic sectors for development. The instability in rainfed production is largely credited to availability of rainwater, which itself shows wide variability in both total amounts and seasonal quality (Rockström and Barron, 2007). Rainfall variability, especially the less well defined onset of the rainy season has increased in the recent past possibly linked to climate change. The start and end of the rainy season defines the length of the rainy season which strongly determines the success or failure of rainfed crops. In addition, the quality of the growing season, as indicated by the length and severity of within-season dry spells, will also influence the yield gap and can often cause total crop failure (Geerts et al., 2006; Phillips et al., 1998). While agricultural water management has largely succeeded in maximising rainfall infiltration through soil and water conservation, the challenge of how to cope with dry-spells, short periods of water stress during crop growth, remains largely unsolved (Fox and Rockström, 2003). Because false planting dates requiring replanting are increasingly common in Zimbabwe (Raes et al., 2004), there is an increasing demand for sowing strategies that minimise risk of total crop failure, such as staggered planting.
Judicious management decision making, such as planting dates and fertiliser application rates, can contribute to increased yields under rainfed conditions. Management decision support for rainfed farming systems is a challenge for resource-poor communities such as subsistence farmers in Sub-Saharan Africa. Optimum management practices, such as planting date, cultivar selection, fertilisation, or water and pesticide application, can be assessed through validated models for making seasonal or within-season decisions (Boote et al., 1996). Simulation experiments can be of significant use in exploring different management options for decision support in cases where field experiments are scarce. Accurate modelling of crop response to water plays an important role in development of guidelines for improving water use efficiency in agriculture (Geerts et al., 2009a). There are many models that simulate the growth and development of maize, such as CERES-Maize (Jones et al., 1987) and Hybrid-Maize (Yang et al., 2004), but most are often applicable only to the fields for which they are calibrated and require a number of parameters next to impossible to collect in rainfed field conditions. AquaCrop, on the other hand, although based on complex crop physiological processes, uses a relatively small number of explicit and mostly intuitive parameters and attempts to balance simplicity, accuracy and robustness (Steduto et al., 2009; Raes et al., 2009a). AquaCrop can in this regard be considered suitable for application in resource-challenged communities where extensive input data may not be available.
AquaCrop is a crop water productivity model (Steduto et al., 2009; Raes et al., 2009a) broadly tested for simulating maize yield response to water (Hsiao et al., 2009; Heng et al., 2009). The model was validated for a wide range of environmental conditions, namely, extraordinarily high evapotran-spiration and wind speed in Bushland, Texas, rainy weather and sandy soil in Gainesville, Florida, and semiarid conditions in Zaragoza, Spain (Heng et al., 2009). Many papers have reported the application of AquaCrop in simulating various management scenarios for many crops including maize (Hsiao et al., 2009, Heng et al., 2009, Stricevic et al., 2011), quinoa (Geerts et al., 2009a), cotton (Garcia-Vila et al., 2009), sunflower (Todorovic et al., 2009, Stricevic et al., 2011) and sugar beet (Stricevic et al., 2011) with success. Against such background, Aquacrop is expected to be potentially suitable for simulating maize yield response to water availability in the semi-arid conditions of Zimbabwe, although reported studies are lacking. To account for the unpredictability of rainfall in the season, farmers often aim at minimising risk, which often means settling for low inputs and low but stable yields (Phillips et al., 1998). One possible strategy is to sow several varieties of a single crop on several planting dates at the start of the rainy season. The varieties differ in their length of the growing cycle and their potential yield. Depending on the length of the rainy season, the total amount of rainfall received during the season and the frequency, length and period of dry spells, it is expected that at least one variety on one of the planting dates will give good yields. As such the farmer is guaranteed an income each year. However the guidelines for this sowing strategy have not been clearly laid down in literature for Zimbabwe's agro-ecological zones. Also the sowing strategy needs to be evaluated for effectiveness in reducing risk of crop failure.
Raes et al. (2004) evaluated the performance of 3 criteria that can be used to determine first planting dates for maize in Zimbabwe. The study concluded that the 3 criteria had different failure rates of 1 in 2 years, 2 in 5 years and 1 in 4 years, depending on the severity of the criterion. The analysis was limited to the establishment stage (first 30 days after sowing) and the rest of the growing season was not assessed. The aim of this paper is to apply AquaCrop to develop decision support guidelines for sowing maize under rainfed conditions for the semi-arid tropical climate of Zimbabwe. A combination of field trials and model simulation experiments were used in this study to analyse response of maize yield to long-term variation in rainfall at climate stations around Zimbabwe. The results are then applied to guide a sowing strategy that minimises year to year variation in rainfed maize yields of smallholder farmers. Field experiments at a research station in Harare and 5 other locations in areas around Zimbabwe where maize is commonly grown provided data for model evaluation. The first part of the paper presents the local calibration of AquaCrop for maize by adjusting for a lower soil fertility level. The second part presents the application of the validated AquaCrop to simulate maize yield response to a long climate data series in order to develop optimised staggered sowing guidelines for rainfed maize in Zimbabwe.
MATERIALS AND METHODS
Study area
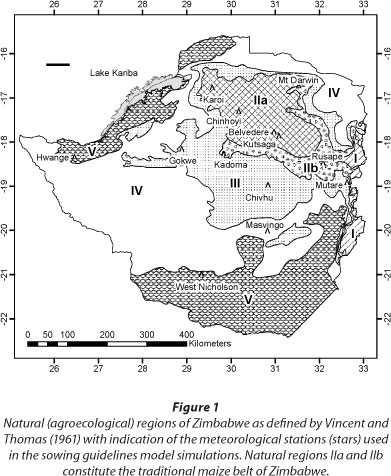
The study was conducted in the so-called maize belt of Zimbabwe and its surroundings (Fig. 1). Vincent and Thomas (1960) divided Zimbabwe into 5 main natural regions primarily on the basis of rainfall, but also considering other factors such as soil type, altitude and land use. Rainfall patterns and crop production progressively deteriorate from Region I to V. Annual mean rainfall is highest in Natural Region I which covers approximately 2% of the land area. It is a specialised and diversified farming region with plantation forestry, fruit and intensive livestock production. Natural Region II, covering 15% of the land area, receives lower rainfall than Region I, but is nevertheless suitable for intensive farming based on crop or livestock production. Rainfed maize production has the highest potential in Regions IIa and IIb (Fig. 1) (Eicher, 1995; Burt et al., 2001; Philips et al., 2002) because rainfall in Regions III to V is too low and erratic for the reliable production of rainfed maize. Natural Region II is traditionally referred to as the maize belt of Zimbabwe.
Field trials and observations
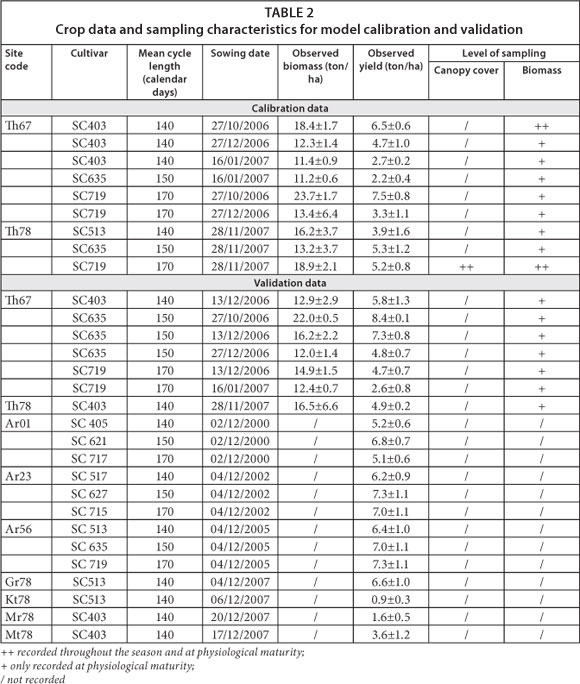
The data for calibration and validation of AquaCrop were obtained from field experiments conducted at 6 locations in 5 seasons (Table 1).

Intensive measurements for model calibration data collection were carried out at Thornpark (Table 1) during the 2006 to 2007 and 2007 to 2008 farming seasons, while the other sites were extensively monitored to give datasets for the validation process (Table 2). At Thornpark, land preparation each year was by ploughing and harrowing in October before the first rains. All sowing was wet sowing after rainfall, except in 2006 when supplementary irrigation was applied at sowing to allow for very early sowing before the first rains. All plots measured 10 x 10 m and plants were spaced 90 cm between rows and 30 cm in row. One seed was sown per sowing station giving a target plant density of about 37 000 plants/ha. At sowing, a basal fertiliser of compound D (nitrogen; phosphorus; potassium, (NPK): 7%; 16%; 5%, respectively) was applied at a rate of 300 kg/ha. Basal dressing was applied in the sowing holes and covered together with the seed. Top dressing was applied at 5 weeks using ammonium nitrate (34.5% N) granules at a rate of 300 kg/ha (about 104 kg/ha N). This application rate, although it is recommended for the rainfed conditions in Zimbabwe, is rather low when compared to the optimal rate of 200 kg/ha N recommended by FAO (2010). Spot application without covering with soil was used for the top dressing. Management at the other sites is considered similar to Thornpark although no detailed records are available.
The parameters observed for the trials at Thornpark farm included canopy cover (CC), soil water content (SWC), maximum effective rooting depth (Zr) above ground biomass (B) and grain yield (Y). Weather data, including daily rainfall, were observed on site by means of an automated weather station. Data collected at the other locations consisted of grain yield, daily rainfall and reference evapotranspiration (ETo) estimated from weather data of the weather station nearest the trial site via the FAO Penman-Monteith equation (Allen et al., 1998).
Canopy cover (CC) was estimated using the meter-stick method (Armbrust, 1990), in which the proportion of the ground shaded by the crop canopy under clear skies and within 2 hours of solar noon (Local time = GMT + 2 h) is expressed as CC in percentage. The restriction of time was imposed to reduce bias caused by effects of the solar elevation angle on the size of the shaded area.
Soil water content (SWC) was measured fortnightly at 10 cm depth intervals up to 1 m gravimetrically. Bulk densities were determined by using an undisturbed soil sampling kit consisting an auger and cylindrical cores of known volume (100 cm3), then weighing the soil after oven drying at 105°C for 24 h. Observed root zone water content was calculated by considering measured SWC for the soil depth equal to the effective rooting depth. The estimated maximum effective rooting depth (Zr ) was used for this purpose.
Maximum effective rooting depth (Zr) was estimated by visual inspection of 1.5 m deep pits dug in the plots to expose the roots at physiological maturity. Washing of the profile with water facilitated clarity in identifying the roots and the lowest level where roots of the maize crop could be observed was considered the maximum effective rooting depth. Soil water retention characteristics were derived from a soil baseline study at the Thornpark site and literature (Mhizha, 2010).
Above-ground biomass (B) samples were collected by cutting the maize at a stubble height of 5 cm and oven-drying at 80°C for 48 h. The sampling was at 2-weekly intervals from approximately the end of the establishment phase of the crop (30 days after sowing) to biological maturity.
At harvest, the grain yield (Y) was weighed and its moisture content measured by a crop moisture meter. The fresh weight was standardised by calculating the equivalent mass at standard moisture content of 12.5% using Eq. (1).

where:
mstd is the grain mass (kg) at 12.5% moisture content
m is the measured mass of grain (kg) at M% moisture content wet basis at harvest.
The harvest index was calculated as the ratio of standardised grain yield to the dry above-ground biomass at harvest.
The crop characteristic variables monitored and the sites of their observation are described in Table 2. The data fields for calibration and validation are identified in this table.
AquaCrop
For detailed description of AquaCrop parameterisation refer to Raes et al. (2009a), Raes et al. (2009b) and Steduto et al. (2009). The AquaCrop input parameters for maize were reported by Hsiao et al. (2009) and validated by Heng et al. (2009) to be either conservative or cultivar specific. Conservative crop parameters are considered constant for all maize cultivars (Hsiao et al., 2009; Heng et al., 2009) while cultivar-specific parameters, on the other hand, may need fine tuning to be applicable to specific local cultivar characteristics. The conservative crop parameters describe the crop development, transpiration, biomass accumulation and grain yield production for optimal environmental conditions. These processes are modified when water stress exists, in which case the modelled processes are adjusted in proportion with the level of stress through the various water stress coefficients (Raes et al., 2009b).
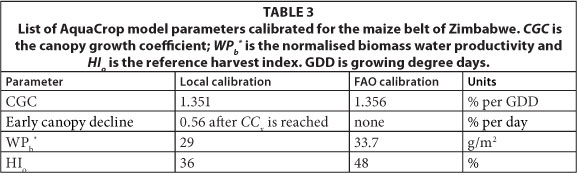
In AquaCrop the effect of soil fertility needs to be calibrated by means of a set of soil fertility stress coefficients (Raes et al., 2009b). The calibration corrects for the effect of soil fertility stress on: (i) canopy development (CGC), (ii) rate of canopy decline once maximum canopy cover (CCx) is reached (early canopy decline), (iii) biomass water productivity (WPb) and (iv) reference harvest index (HIo). As the fertilisation level was below optimum, some of the conservative crop parameters (Table 3) were adjusted for the local 'near optimal' soil fertility levels of the field trials. The AquaCrop model parameters calibrated for this study are presented in Table 3.
The calibration procedure followed (Mhizha, 2010) involved adjusting model parameters for canopy development (CGC), early canopy decline, biomass accumulation (WPb) and grain yield production (HIo) using measured data on canopy cover (CC), biomass and grain yield respectively. The procedure consisted in using specific observed variables as the reference variables (Table 4) in the calibration and adjusting only those parameters (degrees of freedom) that are known to influence the reference variables the most.

The match between simulated and observed reference variables (Table 4) was assessed using goodness of fit tests comprising: the Nash-Sutcliffe model efficiency coefficient (EF) (Nash and Sutcliffe, 1970; Wglarczyk, 1998; Krause et al., 2005) that was evaluated to assess the predictive power of the model; the root mean square error (RMSE) and the coefficient of determination (R2) (Loague and Green, 1991) that were evaluated to assess the error in the model estimates and the correlation between modelled and observed variables, respectively. RMSE was minimised while EF and R2 were maximised in the termination criteria of the calibration. In the validation process, separate data fields (Table 2) were used as observed reference variables in similar goodness of fit tests without any further changes to the calibrated parameters.
Development of sowing guidelines
This section describes how AquaCrop was applied to simulate the response of maize yield to scenarios of sowing date and variety over a long series of climate data at 13 stations in Zimbabwe. The yield response data were used to develop guidelines for sowing maize under rainfed conditions in the study areas.
Climate data
Historical climate data for the study area (Table 5) were used as the input for the climate environment in AquaCrop. Each climate file comprised of daily rainfall data, daily (or monthly) maximum and minimum air temperatures and daily (or monthly) reference evapotranspiration (ET0) data. The default CO2 file within AquaCrop was used to adjust the normalised biomass water productivity (WPb*) to the CO2 concentration of the simulated year (Raes et al., 2009a).
Crop and soil characteristics
In addition to climate input, 3 varieties differing only in growth cycle length (Table 6), with the rest of the crop parameters as calibrated in the previous section, were considered for each site. The soil type at each site (Table 5) was considered for the respective sites. Typical shallow (0.6 m) and deep (1.2 m) soil depths were considered making 2 soil files for each site. Overall there were 3 crop files and 2 soil files for each climate site.

Simulated sowing scenarios
The first sowing date can be defined as the first rainfall event capable of supporting germination (Keatinge et al., 1995). In this study the first sowing date of the season was defined according to the DEPTH criterion, (Raes et al, 2004). According to the DEPTH criterion, first sowing date in Zimbabwe is defined as the first day after 1 October on which the occurrence of 40 mm of rainfall within a 4-day period is observed (Raes et al., 2004). After the first sowing date, 5 other subsequent sowing dates in the same season were determined using a less severe criterion, AREX (Agricultural Research and Extension) (Raes et al., 2004) which defines a sowing date as the occurrence of 25 mm in 7 days after the initial search date, the first sowing date in this case. The AREX criterion replaced the DEPTH criterion for subsequent sowing date determination for the following reasons. First, the DEPTH criterion is more difficult to meet hence fewer sowing dates, often less than 5 in a season could be determined using it. Second, the rather severe conditions of the DEPTH criterion were explained in Raes et al. (2004) as necessary to bring a dry topsoil at wilting point to field capacity and sustain germination and survival of the seedling until the next rains are received. Since the first sowing date would indicate the start of the growing period in 3 out of 4 years, the soil was no longer expected to be at wilting point and so a less strict AREX criterion (25 mm in 7 days) was considered appropriate.
All simulation runs were started on the first day of October in each season, before the start of the rainfall season and assuming a bare soil. All of the soil's readily available water (RAW) would have been lost by this time, 4 months after the latest normal cessation date of the previous rainfall season, estimated to be the end of May (Mhizha, 2010). Therefore all simulation runs started before sowing with a uniform soil water content of θWP. Overall, for each of the 13 climate stations, 18 treatments (3 varieties and 6 sowing dates) were simulated for each climate year. With an average of 28 climate years per station and with 2 soil depths considered at each station, a total of 13 104 treatment simulations were run for 13 climate stations in and around the maize belt of Zimbabwe.
Analyses
Optimisation analysis of the simulated yield was applied to obtain the algorithms that allocate the best acreage proportions to the 18 sowing treatments for maximum total yield and maximum yield stability over the 28 years. Microsoft Excel's Solver tool was used for the optimisation analysis. Coefficients or weighting factors for each sowing date and variety treatment were optimised such that 1, 2 or 3 of the 18 sowing options were selected as an optimised sowing strategy. In this way, optimised sowing strategies were selected for zero, 2-stage or 3-stage staggered sowing. The objective of the optimisation procedure was to maximise the average and minimise the standard deviation of the simulated grain yield over the 28 years analysed.
The Microsoft Excel solver is a general-purpose spreadsheet optimisation modelling system in use since 1991 (Fylstra et al., 1998). Solver allows for a choice to be made between the simplex algorithm for linear models and the non-linear generalised reduced gradient (GRG2) code. The non-linear GRG2 model was used in this analysis. Since steepest gradient methods used by Solver are local optimisers, the initial starting points of the search process were changed in order to capture a more global optimal solution of the parameter estimation.
For the purpose of developing the optimisation objective function, a total yield term YT was defined as the weighted summation of the grain yield simulated for each of the 18 sowing options (3 varieties by 6 sowing dates):

where:
Yis is the simulated grain yield of the ith variety sown on the
sth sowing date
ais is the weighting factor assigned to the ith variety sown on the sth sowing date by the optimisation procedure
The weighting factors (ais) given to each yield term in the summation were aimed at giving more weight to more desirable treatments and less (even none) to undesirable treatments that are not likely to add value (increase mean and decrease standard deviation) to the average yield. Therefore these weighting factors formed the changing cells of the optimisation procedure with the target cell being the mean of YT averaged over the 28 years. The target cell was maximised for highest stable yields. In addition, by making the target cell the standard deviation of YT over the same period of 28 years, and then minimising the target cell, optimised sowing options were selected that minimised year-to-year yield variation (maximises yield stability). By means of constraints, the number of options selected in the optimisation could be restricted to 1, 2, or 3. This allowed for optimisation for staggered sowing strategies with 1, 2 or 3 stages of sowing. For instance by applying the constraint (Eq. (3)) and by making another constraint such that the number of changing cells ais with non-zero values is equal to 1, only one ais weighting factor is selected that allocates 100% of the land to 1 of the 18 sowing options resulting in the selection of a non-staggered sowing strategy:

The optimisation procedure was applied to each climate station and soil depth so that sowing strategies could be selected for each station and soil type. Grouping stations from the same region (maize belt, border and outside of the maize belt), modal sowing strategies were selected for generalised application to the whole region.
RESULTS AND DISCUSSION
Field observations
Observed weather data are presented in Table 7. Irrigation was applied to 1 treatment at Thornpark in the 2006/07 season to sustain the crop which was planted on 27 October 2006 before the onset of the rainfall season. Reference evapotranspiration (ETo) was calculated from observed daily temperature, relative humidity, wind speed and solar irradiance data where automated weather stations (AWS) were available using a software package ETo Calculator (FAO, 2009) based on the procedures described by Allen et al. (1998). The weather at the different sites showed considerable variation which is useful in the validation of AquaCrop to ensure the results are widely applicable to the general climate of Zimbabwe. Previous model testing of AquaCrop were also done under varying climatic conditions (Heng et al., 2009; Hsiao et al., 2009).
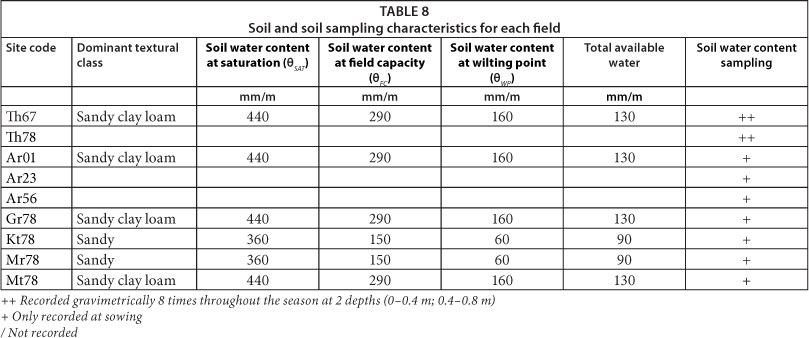
By considering the soil water retention characteristics influencing the total available water from a soil baseline study of the sites (Mhizha, 2010), 2 major soil types emerged and were considered representative for the study sites as described in Table 8. Sandy clay loam soils were predominant at Th67, Th78, Ar01, Ar23, Ar56, Gr78 and Mt78, while deep uniform sandy soils were observed at Kt78 and Mr78 fields (Table 1).
Maximum effective rooting depth (Z) estimated at Thornpark was 0.8 m, a result which is consistent with the observed depth of the soil at Thornpark reported in the soil baseline study carried out at this site (Mhizha, 2010). Water retention characteristics for the 2 soil types indicate total available soil water content of 90 mm/m and 130 mm/m for the sandy and sandy clay loam soils respectively. These results compare well with reported values of 90 mm/m and 127 mm/m for similar soils in Zimbabwe (Raes et al., 2004).
For the Thornpark trials, statistical analysis of final above-ground biomass and yield data was done by means of analysis of variance (ANOVA) and separation of means carried out on the observed data using Statistical Analysis Software (SAS version 9.3.1). The least significant difference at 5% level (LSD005) was used to separate the means of the main and interaction effects where appropriate.
In Table 9, it is shown that yield for each sowing date was significantly different from the others in the 2006/07 trial, with an observed decrease in yield with delayed sowing. Since the 2006/07 season was a relatively dry season, it can be suggested, that based on these results, the effect of sowing date on maize yield is clearly apparent in dry years although further trials over more seasons need to be studied to confirm this.

There was no significant difference between means of all three varieties in the two rainfed trials of 2006/07 and 2007/08 (Table 10). Also, comparing the overall means with the potential yields of the three varieties in the region as provided by SeedCO (2005) - 4-8 Mg/ha for the early maturing, 5-10 Mg/ha for the medium maturing and 7-13 Mg/ha for the late maturing variety - it can be observed that the rainfed yields were significantly below the potential values. This yield gap was part of the reason for calibration of AquaCrop parameters which reduced simulated yields to levels comparable to observations under rainfed conditions.

Model calibration
The list of parameters adjusted during calibration is presented in Table 3. The combined effect of adjusting CCx and canopy decline from mid-season improved the simulation of CC. The biomass water productivity (WPb*) and reference harvest index (HIo) input parameters of AquaCrop were adjusted from the default values of 33.7 g/m2 and 48% to 29 g/m2 and 36%, respectively, to account for the low soil fertility conditions. The adjusted WPb* led to improved simulation of the final above-ground biomass.
The biomass water productivity parameter was adjusted according to Eq. (4):
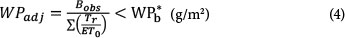
where:
Tr is simulated crop transpiration the conservative normalised WPb* = 33.7 g/m2
WPadj. is the normalised WPb* adjusted for the low soil fertility conditions
Bobs is the observed final above-ground biomass.
This approach assumes the model is simulating crop transpiration accurately such that Tr is approximately the actual crop transpiration. Reference harvest index HIo was adjusted by assuming correct simulation of final above-ground biomass and using the relationship between biomass and grain yield. Table 11 presents the statistical parameters for assessing the model performance after local calibration. The coefficients of determination for all variables tested in the calibration were above 0.75, showing a high linear correlation between simulated and observed parameters. The highest RMSE percentage of 16.1% was calculated for biomass accumulation. The relatively large error was attributed to higher random errors in measuring observed biomass. However, the Nash-Sutcliffe model efficiency coefficients were all above 0.75 indicating a good overall model performance.

Scatter plots of simulated against observed final above-ground biomass and grain yield are shown in Fig. 2. The correlation (R2 = 0.86 and 0.96 for grain yield and biomass, respectively) was good while slopes of 0.92 and 0.77 for yield and biomass, respectively, were also quite good for the relatively small datasets used, implying a good fit between calibrated model output and observations. The results of the assessment of model performance after calibration were satisfactory, showing AquaCrop to be capable of simulating maize yield responses to variety and sowing dates.

Model validation
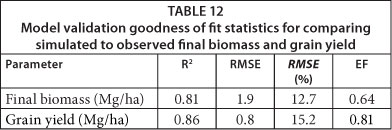
Results of validation of AquaCrop with a different dataset (Table 2) are presented as scatter plots of the simulated against observed final above-ground biomass and grain yield in Fig. 3. With R2 = 0.86 and 0.96 for grain yield and biomass, respectively, as well slopes of 0.79 and 0.71 for grain yield and biomass, respectively, the fit between observed and modelled parameters during validation was good. AquaCrop was able to simulate above-ground final biomass and grain yield for 6 stations around the maize belt of Zimbabwe. The statistical measures of model performance during validation are presented in Table 12. The EF value for biomass (0.64) is lower than that for grain yield (0.81), possibly due to the relative difficulty in measuring observed biomass when compared to grain yield. Zinyengere et al. (2011) and Masanganise et al. (2012) used AquaCrop to simulate maize yields in Zimbabwe without calibrating it, but the order of magnitude and sensitivity of the simulations to variety and sowing dates were reported to be satistfactory. This study provides further evidence that AquaCrop can be used to reliably simulate maize yields for common varieties grown at different locations in Zimbabwe, although further testing of the model under farmers' field conditions can still be valuable.

Model application for developing sowing guidelines
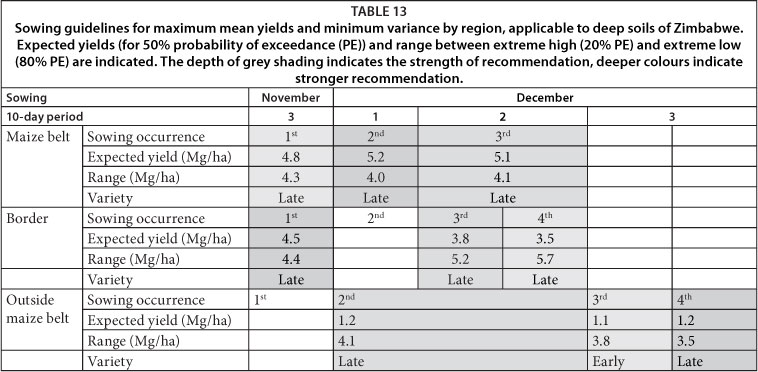
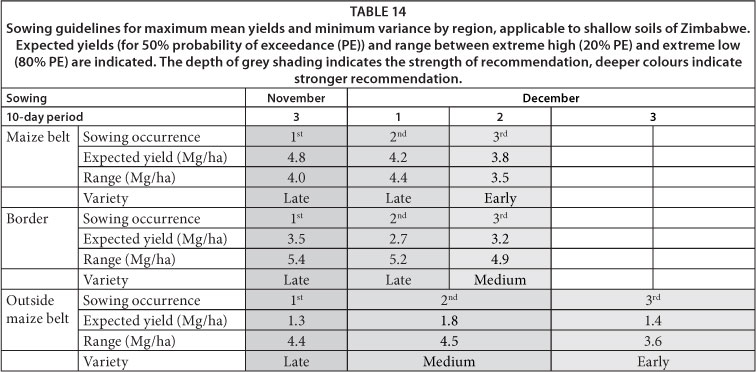
The developed sowing guidelines were summarised into simple charts presented in Table 13 (deep soil) and Table 14 (shallow soil).
Tables 13 and 14 show the 10-day periods in which sowing is recommended in order to obtain maximum yield under rainfed cultivation of maize in the maize belt, at its border and outside regions and for the two soil depths considered. The expected average yield is indicated together with expected yield range, defined by the difference between yields with probabilities of exceedance of 80% and 20%. The range is an indicator of the yield variation due to inter-annual variability in quality of the rainfall season at the concerned location with wider ranges indicating higher risks of yield variability. The depth of grey shading indicates the strength of recommendation. Although the best option for the farmer in each of the three regions is to sow all fields in the recommended dekad, staggered sowing in Zimbabwe is often practiced due to labour constraints. In this case, the degree of shading indicates the order of preference for sowing periods. For late sowing, short maturing varieties should be used.
Storage capacity of the deep soil (Table 13) allows later sowing dates than on the shallow soil (Table 14). This results in higher yields on the deep soil because the uncertainty at the start of the rainy season can be avoided. To avoid insufficient rainfall at the end of the growing season, sowing should be as early as possible on the shallow soil. From the simulated expected mean yield results, it can be concluded that highest yields can be obtained inside the maize belt while maize production can still be considered viable in the border region. Farming maize outside the maize belt is not recommended because of the low average yields and high variation expected. This wide range in expected yields was also reported by Zinyengere et al. (2011), who reported expected maize yields for Masvingo (outside the maize belt) ranging from 0 to 6 t/ha after using an uncalibrated version of AquaCrop and a weather generator. Mhizha et al. (2012) used analysis of relative transpiration to show that the quality and length of the rainfall season is more suited for rainfall in the maize belt than outside it, concluding that deeper soils and shorter varieties are desirable to obtain better yields outside the maize belt. Phillips et al. (2002) reported that maize is the dominant crop in the wetter zones of Zimbabwe, while in the drier zones the more drought-tolerant crops, pearl millet (Pennisetum glaucum L.) and sorghum [Sorghum bicolor (L.) Moench], and livestock herding are the dominant components of the farming system.
The results presents the recommended sowing windows for 3 climate zones of Zimbabwe and 2 typical soils. The sowing windows span from the third 10-day period of November in all areas to the third 10-day period of December in the marginal zone outside the maize belt. The sowing periods were determined by optimising mean yields and therefore were influenced by extreme values. It is recommended that the guidelines be used in conjunction with seasonal climate forecasts to reduce effect of inter-annual variability in rainfall patterns. The main advantage of these sowing recommendations is that they are based not only on rainfall characteristics at the start of the season but also take into account the rest of the growing season's characteristics together with the crop and soil characteristics.
CONCLUSIONS
AquaCrop for maize was able to simulate grain yield accurately for the local environmental conditions of Zimbabwe after fine-tuning for soil fertility. The local calibration of AquaCrop considered the local varieties' characteristics and local fertility management levels, which were below optimum levels. Overall, model validation results were satisfactory and it was concluded that AquaCrop could simulate with satisfactory accuracy maize production under rainfed conditions in Zimbabwe.
The validated AquaCrop model was applied together with an optimisation model to select optimum sowing dates and varieties for climate stations in and around Zimbabwe's maize belt. Optimum sowing time was shown to be sensitive to soil depth. Deep soils had a wider sowing window while shallow soils required very early sowing to give better yields in comparison. However, the optimisation procedure used can be improved by including in its formulation other important parameters, such as labour, which influence overall production at farm level.
The developed sowing guidelines were summarised into a simple chart that is easy to use as a general guide applicable to the study area. However, the developed guidelines are still rather general and are in terms of sowing date occurrences not calendar days. Their application at farm level is therefore difficult unless they are simplified further. The major outstanding point is that of determining when the first, second, etc., sowing date occurrence has arrived at a particular farm site. Since sowing date occurrences vary from year to year, it would be useful if the short-term weather forecasts could incorporate sowing date occurrences to help farmers keep track of the progression of the sowing season and hence be able to implement the sowing guidelines.
It must be noted that the results of this study were developed by linking real historical climate data; typical soil characteristics for the locations; current maize cultivar characteristics as well as prevailing management practices like fertilisation rates and planting densities. Should any of these be considered to have changed, e.g., climate due to climate change, the model may need to be re-run to come up with updated and relevant guidelines. Modelling is not a substitute for field experiments but rather is complementary. It is therefore recommended to test the model results by field experiments in the study area in order to validate the practical applicability of the recommendations of this study.
ACKNOWLEDGEMENTS
This research was funded by the Flemish Inter-University Council of Belgium (VLIR - IUC) through PhD and Post-Doc fellowships. The authors are grateful to Olivier Crespo for a critical review of the revised manuscript.
REFERENCES
ALLEN RG, PEREIRA LS, RAES D and SMITH M (1998) Crop evapotranspiration - Guidelines for computing crop water requirements. FAO Irrigation and Drainage Paper No. 56. FAO, Rome. 300 pp. [ Links ]
ARMBRUST DV (1990) Rapid measurement of crop canopy cover. Agron. J. 82 1170-1171. [ Links ]
BOOTE KJ, JONES JW and PICKERING NB (1996) Potential uses and limitations of crop models. Agron. J. 88 704-716. [ Links ]
BURT R, WILSON AM, KANYANDA CW, SPURWAY JKR and METZLER JD (2001) Properties and effects of management on selected soils in Zimbabwe. Geoderma 101 119-141. [ Links ]
EICHER CK (1995) Zimbabwe's maize-based green revolution: Preconditions for replication. World Dev. 23 (5) 805-818. [ Links ]
FAO (FOOD AND AGRICULTURAL ORGANISATION OF THE UNITED NATIONS) (1996) Food requirements and population growth. World Food Summit Technical Background Document No. 4. URL: http://www.fao.org/docrep/003/w2612e/w2612e4a.htm (Accessed 21 January 2010). [ Links ]
FAO (FOOD AND AGRICULTURAL ORGANISATION OF THE UNITED NATIONS) (2009) The ETo Calculator Version 3.1. Reference Manual. URL: http://www.fao.org/nr/water/docs/_ReferenceManualETo.pdf (Accessed 20 July 2012). [ Links ]
FAO (FOOD AND AGRICULTURAL ORGANISATION OF THE UNITED NATIONS) (2010) Crop Water Information: Maize. URL: http://www.fao.org/nr/water/cropinfo_maize.html (Accessed 20 July 2012). [ Links ]
FOX P and ROCKSTRÖM J (2003) Supplemental irrigation for dry spell mitigation of rainfed agriculture in the Sahel. Agric. Water Manage. 61 29-50. [ Links ]
FYLSTRA D, LASDON L, WATSON J and WARREN A (1998) Design and use of the Microsoft Excel Solver. Interfaces 28 (5) 29-55. [ Links ]
GARCÍA-VILA M, FERERES E, MATEOS L, ORGAZ F and STEDUTO P (2009) Deficit irrigation optimization of cotton with AquaCrop. Agron. J. 101 477-487. [ Links ]
GEERTS S, RAES D, GARCIA M, DEL CASTILLO D and BUYTAERT W (2006) Agro-climatic suitability mapping for crop production in the Bolivian Altiplano: A case study for quinoa. Agric. For. Meteorol. 139 399-412. [ Links ]
GEERTS S, RAES D, GARCIA M, MIRANDA R, CUSICANQUI JA, TABOADA C, MENDOZA J, HUANCA R, MAMANI A, CONDORI O, MAMANI J, MORALES B, OSCO V and STEDUTO P (2009a) Simulating yield response of Quinoa to water availability with AquaCrop. Agron. J. 101 499-508. [ Links ]
HENG LK, EVETT SR, HOWELL TA and HSIAO TC (2009) Calibration and testing of FAO aquacrop model for rainfed and irrigated maize. Agron. J. 101 488-498. [ Links ]
HSIAO TC, HENG LK, STEDUTO P, ROJAS-LARA B, RAES D and FERERES E (2009) AquaCrop-the FAO crop model to simulate yield response to water: III. Parameterization and testing for maize. Agron. J. 101 448-459. [ Links ]
JONES CA, KINIRY JR and DYKE PT (1987) CERES-Maize: A Simulation Model of Maize Growth and Development. Texas A and M University Press, Texas. [ Links ]
KEATINGE JDH, AIMING Q, KUSMENO GLU I, ELLIS RH, SUMMERFIELD RJ, ERSKINE W and BENIWAL SPS (1995) Defining critical weather events in the phenology of lentil for winter sowing in the west Asian highlands. Agric. For. Meteorol. 74 251-263. [ Links ]
KRAUSE P, BOYLE DP and BASE F (2005) Comparison of different efficiency criteria for hydrological model assessment. Adv. Geosci. 5 89-97. [ Links ]
LOAGUE K and GREEN RE (1991) Statistical and graphical methods for evaluating solute transport models: overview and application. J. Contam. Hydrol. 7 51-73. [ Links ]
MASANGANISE J, CHIPINDU B, MHIZHA T and MASHONJOWA E (2012) Model prediction of maize yield responses to climate change in north-eastern Zimbabwe. Afr. Crop Sci. J. 20 (2) 505-515. [ Links ]
MHIZHA T (2010) Increase of yield stability by staggering the sowing dates of different varieties of rainfed maize in Zimbabwe. PhD thesis, Katholieke Universiteit Leuven. [ Links ]
MHIZHA T, GEERTS S, VANUYTRECHT E, MAKARAU A and RAES D (2012) Relative transpiration as a decision tool in crop management: a case for rainfed maize in Zimbabwe. Afr. Crop Sci. J. 20 (1) 47-57. [ Links ]
NASH JE and SUTCLIFFE JV (1970) River flow forecasting through conceptual models Part I: A discussion of principles. J. Hydrol. 10 282-290. [ Links ]
PHILIPS JG, DEAN D, UNGANAI L and CHIMELI A (2002) Implications of farm-level response to seasonal climate forecasts for aggregate grain production in Zimbabwe. Agric. Syst. 74 351-369. [ Links ]
PHILLIPS JG, CANE MA and ROSENZWEIG C (1998) ENSO, seasonal rainfall patterns and simulated maize yield variability in Zimbabwe. Agric. For. Meteorol. 90 39-50. [ Links ]
PINSTRUP-ANDERSEN P, PANDYA-LORCH R and ROSEGRANT MW (1999) World food prospects: Critical issues for the early twenty-first century. URL: http://www.ucc.ie/famine/conference/papers/Pandya-Lorch.pdf (Accessed 29 August 2008). [ Links ]
RAES D, SITHOLE A, MAKARAU A and MILFORD, J (2004) Evaluation of first sowing dates recommended by criteria currently used in Zimbabwe. Agric. For. Meteorol. 125 177-185. [ Links ]
RAES D, STEDUTO P, HSIAO TC and FERERES E (2009a) AquaCrop-The FAO crop model for predicting yield response to water: II. Main algorithms and soft ware description. Agron. J. 101 438-447. [ Links ]
RAES D, STEDUTO P, HSIAO TC and FERERES E (2009b) AquaCrop Reference Manual. URL: http://www.fao.org/nr/water/aquacrop.html (Accessed 6 September 2011). [ Links ]
ROCKSTRÖM J and BARRON J (2007) Water productivity in rainfed systems: overview of challenges and analysis of opportunities in water scarcity prone savannahs. Irrig. Sci. 25 299-311. [ Links ]
ROCKSTRÖM J, BARRON J and FOX P (2003) Water productivity in rain-fed agriculture: challenges and opportunities for smallholder farmers in drought-prone tropical agroecosystems. In: Kijne JW, Barker R and Molden D (eds.) Water Productivity in Agriculture: Limits and Opportunities for Improvement. International Water Management Institute (IWMI), Colombo. [ Links ]
SEEDCO (2005) SEEDCO AGRONOMY MANUAL. URL: http://www.seedco.co.zw/productmanuals.cfm (Accessed 24 November 2009). [ Links ]
MPANDE RL and TWANDA M (1998) Case study: Southern Africa population dynamics and the emerging competition for water use in the Zambezi river basin. URL: http://www.aaas.org/interna-tional/ehn/waterpop/southaf.htm. (Accessed 13 July 2011). [ Links ]
STEDUTO P, HSIAO TC, RAES D, FERERES E (2009) AquaCrop-the FAO crop model to simulate yield response to water: I. Concepts and underlying principles. Agron. J. 101 426-437. [ Links ]
STRICEVIC R, COSICA M, N DJUROVICA N, PEJIC B AND MAKSIMOVICC L (2011) Assessment of the FAO AquaCrop model in the simulation of rainfed and supplementally irrigated maize, sugar beet and sunflower. Agric. Water Manage. 98 (10) 1615-1621. [ Links ]
TODOROVIC M, ALBRIZIO R, ZIVOTIC L, ABI SAAB M, STWCKLE C and STEDUTO P (2009) Assessment of AquaCrop, CropSyst and WOFOST models in the simulation of sunflower growth under different water regimes. Agron. J. 101 509-521. [ Links ]
VINCENT V and THOMAS RG (1961) An agricultural survey of Southern Rhodesia: Part I: agro-ecological survey. Government Printer, Salisbury. [ Links ]
WGLARCZYK S (1998) The interdependence and applicability of some statistical quality measures for hydrological models. J. Hydrol. 206 98-103. [ Links ]
YANG HS, DOBERMANN A, LINDQUIST JL, WALTERS DT, ARKE-BAUER TJ and CASSMAN KG (2004) Hybrid-maize-a maize simulation model that combines two crop modeling approaches. Field Crops Res. 87 131-154. [ Links ]
ZINYENGERE N, MHIZHA T, MASHONJOWA E, CHIPINDU B, GEERTS S and RAES D (2011) Using seasonal climate forecasts to improve maize production decision support in Zimbabwe. Agric. For. Meteorol. 151 (12) 1792-1799. [ Links ]
 Correspondence:
Teddious Mhizha
+263 712 798260; fax: +263 4 307130
e-mail: tmhizha@gmail.com
Received 29 January 2013
Accepted in revised form 3 March 2014

