


Servicios Personalizados
Articulo
 Inglés (pdf)
 Articulo en XML
 Referencias del artículo
Indicadores

Links relacionados
-
 Citado por Google
 -
 Similares en Google
Compartir

 Permalink
Water SA
versión On-line ISSN 1816-7950
versión impresa ISSN 0378-4738
Water SA vol.40 no.2 Pretoria abr. 2014
Managing water pressure for water savings in developing countries
Branislav Babić; Aleksandar Dukić; Miloš Stanić
University of Belgrade - Faculty of Civil Engineering, Department of Hydraulic and Environmental Engineering, Bulevar kralja Aleksandra 73, 11000 Belgrade, Serbia
ABSTRACT
Many water utilities, particularly in the developing countries, continue to operate inefficient water distribution systems (WDSs) with a significant amount of water and revenue losses. Various factors, manageable to different extents, contribute to water losses, such as poor infrastructure, high pressures, illegal water use, etc. Whilst the problem of water losses in WDSs is global in scale, solutions need to be tailored to local circumstances due to the various causes of water loss and the mechanisms available to manage them. This paper investigates the potentials of the available pressure management methodologies and their implementation in developing countries, using a case study of a district metering area (DMA) in Kotež-Serbia. The minimal night flow method was applied for assessment of real losses. A particular focus is on assessment of water savings due to reduction of pressures. A total of three methods for estimation of water savings are described and tested against data measured in the DMA under initial and reduced pressures: (i) the method based on Leakage Index (LI) calculations, (ii) the PRESMAC model and (iii) a newly-developed method which is based on the assumption that both leakage and consumption are pressure dependent. The results indicate that the third method leads to the most accurate prediction of the total amount of water savings under reduced pressures, with only 6% difference between measured and estimated volume of saved water.
Keywords: water supply, water losses, minimum night flow, pressure, consumption, water savings
INTRODUCTION
Water utilities in developing countries are putting significant effort into providing customers with a reliable level of service, often via poor water distribution infrastructure and restricted budgets. There are many factors contributing to water losses in water distribution systems (WDS), such as: ageing infrastructure, high pressures, external and internal pipeline corrosion, service tank overflows, poorly designed and constructed WDSs, metering errors, illegal use and poor operation and maintenance practices. Understanding the condition and operation of the WDS is a key factor in minimising water losses.
Although regular pipeline inspection seems like an ideal direct method, it is costly and unaffordable for many water companies in developing countries. Alternative indirect assessment of water distribution systems based on the water balance and performance indicators seem to be more practical. The International Water Association (IWA) has developed a standard water balance methodology and an array of performance indicators for benchmarking of water utilities regarding water losses (Alegre et al., 2006). Due to large discrepancies in WDSs development, network data availability and reliability of monitoring data, operation practices, available water loss management methodologies used in developed countries often cannot be directly applied to the utilities in developing countries.
The efficiency of WDSs is measured by the difference between WDS input volume and water delivered to customers and billed (revenue water), commonly referred to as non-revenue water (NRW). NRW consists of water losses (real and apparent losses) and authorised unbilled consumption (such as water for fire fighting and pipeline flushing). Real losses include tank overflows and leakage on mains, distribution network and service connections, while apparent losses consist of unauthorised consumption and metering inaccuracies. The quantity of water lost is a measure of the operational efficiency of a WDS. High levels of water losses are an indication of poor governance and poor physical condition of the WDS (Mutikanga, 2012).
Water and revenue losses are a major problem for water utilities worldwide. The amount of water lost from WDSs is astounding - NRW from WDSs worldwide is estimated at 48 billion m3 per year (Kingdom et al., 2006). The same report indicates that about 55% of the global NRW by volume occurs in the developing countries. Large discrepancies in NRWs are noticeable even in the developed countries. The lowest leakage levels are reported in the Netherlands (3-7%), while in most developed countries these figures are higher: 15% in USA, 13.8% in Canada, 42% in Italy and 34.9% in Greece (Mutikanga, 2012). Reported NRW amounts in the 12 largest cities in Serbia are in the range of 27% (in Leskovac) to 67.80% (in Lazarevac). Due to insufficient data available from the local water utilities, reported values of NRW in Serbia are obtained from restricted calculations based only on the total volume of water abstracted and the total authorised volume of water used (Topalovic et al., 2012).
Even though the problem of water losses in WDS is global, solutions need to be tailored to local circumstances due to variation in the causes of water losses and the mechanisms available to manage them. For instance, in developing countries, apparent losses often represent a very significant portion of total losses, while in developed countries, physical losses are by far the highest loss factor.
Reduction of pressures within the whole or part of the WDS is one of most efficient and most frequently applied methods for reducing leakage (Fantozzi and Lambert, 2008). The influence of pressure reduction on reduction of leakage is well investigated and documented, with elaborated and proven methods for estimating and reduction of NRW due to pressure reduction. Influence of pressure on water consumption is also observed, but much less investigated. Therefore there is a need for development of more accurate methods for predicting water savings due to pressure reduction. These methods should provide better assessment of the overall water savings in WDSs, which would be of particular importance for water utilities where excessive pressures and irrational water use is observed, which is the case in many developing countries. Although there are pressure-driven demand methods (PDD), that can be efficiently used for estimating water savings when a calibrated simulation model exists (Trifunovic and Vairavamoorthy, 2012; Giustolisi et al., 2008), in the case of developing countries this situation is rare, so simplified methods based on a limited amount of available data that give a reasonably good estimate of water savings are more practical, and this paper deals with these methods.
METHODS FOR REAL WATER LOSS ASSESSMENT AND CONTROL
The Minimum Night Flow method for water loss assessment
The first step towards the reduction of NRW and water losses is to establish an accurate water balance (WB) and determine its main components: system input volume (SIV) and billed authorised consumption (revenue water), which are the basic parameters for NRW estimate. The second step includes detailed analysis and monitoring of WB components: leaks and bursts along pipelines and service connections, overflow from service tanks, metering inaccuracies, data-processing errors, etc. Accuracy and reliability of WB calculations and assessment of NRW components are directly related to the accuracy and reliability of the input data.
The Minimum Night Flow (MNF) method has been widely adopted as the most accurate for assessment of real water losses. The MNF is the lowest flow supplied to a hydraulically isolated supply zone (Fig. 1). During the night, most commonly between 02:00 and 04:00, water use is at its lowest and pressures in the network are at the highest levels, meaning that a significant portion of MNF is likely to be leakage. Monitoring of MNF for estimation of leakage rates is usually carried out in a discrete supply zone within a network - i.e. a District Metered Area (DMA).
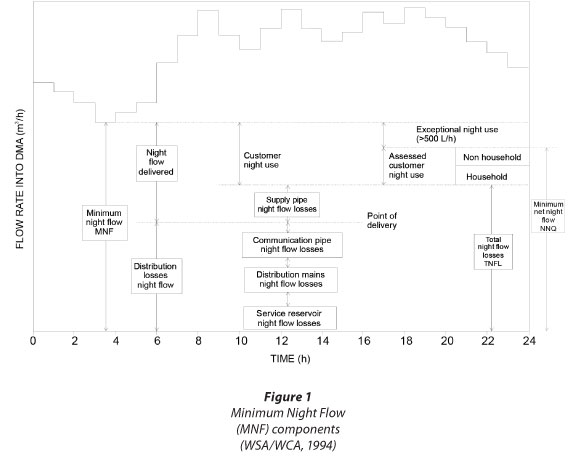
Night water consumption is assigned only to a certain number of consumers in the DMA. The actual number of active night consumers is dependent on the day of the week, social habits of consumers, etc. However, the number of active night consumers that consume high amounts of water during the night is significantly lower than the total number of consumers in the DMA. Experience in various parts of the world has shown that approximately 6% of the population is active during the time of MNF and that the water use is 10ℓ∙person-1∙h-1. The value is based on a standard 10-ℓ toilet tank and may vary from one region to another. Literature data indicates that normal night household use is either 1.7ℓ∙household-1∙h-1 or 0.6 ℓ∙capita-1∙h-1 (McKenzie, 1999).
It is well known that pressure influences leakage rates and consequently the MNF and annual water losses. The first comprehensive concept of real loss components and influencing parameters, the Burst and Background Estimates (BABE) methodology, was developed, applied and calibrated in the UK in the mid-1990s (WSA/WCA, 1994). The main MNF components are shown in Fig. 1.
Extensive experiments in the number of DMAs in the UK were carried out to establish the relationship between average night zone pressure (AZNP) within a DMA and water losses. Experimental results were presented in a non-dimensional form, by dividing registered net night flow at reduced pressure with net night flow at unreduced pressure. The obtained non-dimensional parameter was named the Leakage Index (LI). Further analyses showed that all LI curves obtained for different DMAs have a similar shape. Statistical processing of the experimental data provided the generalised empirical relation between the LI and AZNP in a DMA, given by the following equation (WSA/WCA, 1994):

where:
AZNP is expressed in meters (m)
The above equation is used for prediction of LI values at variable AZNP. AZNP is determined through field measurements and a calibrated mathematical model of the DMA distribution network.
Eq. (1) enables the following:
• Prediction of the net night flows and leakage rates due to pressure variations in DMA
• Assessment of daily leakage rates
The report by WSA/WCA (1994) indicates that actual pressure-leakage relation cannot be simply described by a single general equation but an alternative methodology was not proposed. Further insight into the pressure-leakage relation was provided by the Fixed and Variable Areas Discharges concept (FAVAD) (May, 1994). The FAVAD approach enabled common interpretation and understanding of the different empirical relations resulting from numerous investigations in various countries. Both BABE and FAVAD methodologies were applied for consideration of a variety of water loss issues in a number of countries.
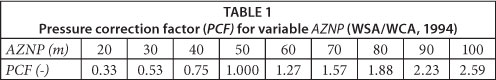
According to the BABE methodology, 50 m of pressure was adopted as a standard pressure for leakage assessment calculations. If AZNP has a different value, the pressure correction factors (PCF) are introduced to express leakage rates at standard pressure. The pressure correction factor, given in Table 1, represents the ratio of leakage indexes at certain and standard pressure of 50 m.
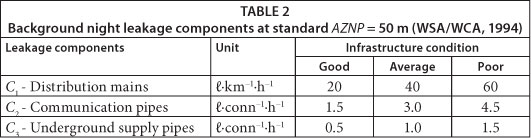
Background night leakage - BLN (ℓ/h) in a particular section of a DMA along the known length of pipelines without bursts, with a known number of service connections and a determined average operating pressure, can be assessed according to (WSA/WCA, 1994):

where:
PCF is the pressure correction factor related to AZNP
L (km) is the length of pipelines
N is the number of service connections (conn.)
C1, C2 and C3 are leakage components, presented in Table 2
Assessment of daily water losses (LD) based on night flow monitoring requires consideration of pressure variations during 24 h. Night water losses estimated on the basis of registered night flows can be transferred into daily water losses by multiplying them with a time factor (T) dependent on the daily pressure variations. Therefore, daily water losses are calculated as (WSA/WCA, 1994):

where:
LD (m3∙d-1) = daily water losses
T (h) = time factor
TNFL (ℓ∙h-1) = total night flow water losses
Time factor T is dependent on the pressure variations in the DMA. In DMAs where daily pressure variations are less than 10 m, the values of the time factor T ranges between 19 and 21 h, but if the daily pressure variations are higher than 10 m, the algorithm for time factor T calculations is as follows (WSA/WCA, 1994):
• The 24 -h period is divided into the n equal time intervals Δt.
• For each time interval AZNP is estimated.
• For each estimated AZNP calculate LI.
• The T factor is calculated as a sum of LI obtained for each time interval divided by LI for night minimal flow and multiplied by Δt.
Pressure management for leakage control
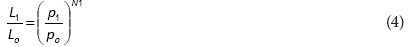
Theoretically, the flow rate through the opening on the pressurised pipeline is proportional to the square root of the pressure. However, a series of experiments have shown that the given relationship does not reflect the impact of pressure on water losses in WDSs. Therefore, the following pressure-water loss relation is recommended (McKenzie, 2001; Lambert, 2001; Thornton and Lambert, 2005):
where:
Lo (m3∙h-1) is initial water loss in at initial pressure po (m)
L1 (m3∙h-1) is new water loss at new pressure p1 (m)
N1 is the pressure exponent
Pressure exponent N1 is estimated upon real water losses at the time of MNF at variable pressures. Previous investigations indicated that most common N1 values are in the range of 0.5 to 1.5 while the max N1 values may reach 2.5. Pressure exponent values depend on pipe material, operating conditions and the type of pipe damage (fractures or small cracks, etc.). Therefore, a small reduction of pressure can cause a significant reduction in actual water losses.
The basic philosophy governing pressure management for leakage control in WDSs is the reduction of excess pressure in a system in order to reduce leakage. The main objectives of pressure management are: to reduce frequency of new breaks within a WDS, to reduce flow rates through breaks and background leakage, and to reduce the risk of further leaks. Although there is no simple solution to the complex problem of excess pressure in a WDS, considerable research and development has taken place over the past decade. This has resulted in the creation of various techniques and equipment that can help to control pressure and, thus, reduce leakage. Pressure reduction is usually achieved by either pressure-reducing valves (PRVs) or reduced pumping heads (by variable-speed pumps). There are 3 types of PRVs commonly applied in practice:
• Fixed outlet - downstream of the PRV pressure is maintained at a fixed level. The fixed pressure level must enable continual water supply at each critical node downstream of the PRV at the time of maximal water consumption.
• Time modulated - a variant of the previous pressure control method, which allows the reduction of the outlet pressure at certain periods of the day. This method is based on a consistent water demand pattern on a daily basis, and enables reduction of excessive pressure during the night when water consumption is at its lowest.
• Flow modulated - the pressure follows the curve of hourly water consumption, and at time intervals when the demand is low the pressure is reduced to a minimum, thus lowering water losses and irrational water consumption.
Moreover, water consumption is also pressure dependent. Considering volumes of water used by consumers in DMAs over a period of time (e.g. 1 day), certain categories of water consumption may be considered as pressure-independent (such as toilet tanks, washing machines, dishwashers, etc.), meaning that under high pressure these appliances consume water faster but the volumes of consumed water remain the same. However, if actual inflow into the DMA measured in ℓ∙s-1 is considered, all of its components (i.e. consumption + losses) can be considered as pressure-dependent. However, the exact pressure-flow relations for various consumption and loss components are still under debate among researchers. Lambert and Tailor (2010) suggest that night leakage rates up to the property line are pressure-dependent, with N1 between 0.5 and 1.5, depending on the types of leaks, while customer night consumption after the property line contain components which are pressure-dependent (leakage and exceptional night use, N1 between 0.5 and 1.5) and almost pressure-independent (normal night use, N1 close to zero). Greyvenstein and Van Zyl (2007) indicated that the pressure-water consumption relationship follows Eq. (4) but the value of the pressure exponent N1 is usually lower than 0.5.
Impacts of pressure on consumption reduction should be further investigated, since there are only a few theoretical and empirical examples of the technical and financial impacts of water consumption reduction and water savings due to pressure reduction in WDS presented in literature.
EXPERIMENTAL
Field monitoring in the pilot zone Belgrade - Kotež
Belgrade, the capital of Serbia, is supplied with water from both ground and surface water resources in the riparian belt of the Sava River. Belgrade Waterworks annually produces over 210 million m3 of potable water in 6 water treatment plants. Over 1.3 million inhabitants of Belgrade and the surrounding suburbs, all commercial consumers, institutions and the majority of industrial plants in the area are supplied with potable water through 3 275 km of water distribution network.
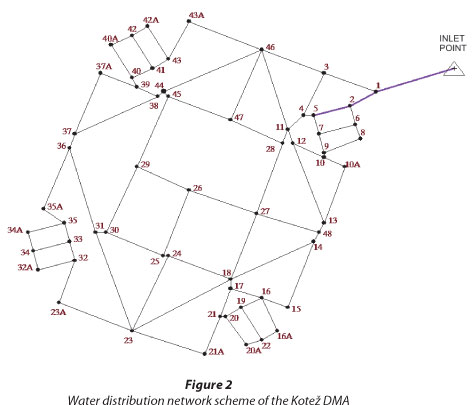
The Kotež district is a suburb located in the northern part of the city, on the flatlands on the left bank of the Danube River at an altitude of 71.50 m asl, at the edge of the Belgrade water supply system's lowest pressure zone. The water distribution network in Kotež was constructed during the 1970s and is presented in Fig, 2. The district is residential, with no significant commercial or industrial water consumers. The district is supplied with potable water through a 150 mm diameter pipeline (Fig. 2: inlet point-1-2-5). The secondary distribution network within Kotež is built of asbestos-cement pipelines 100 mm in diameter. The total length of the pipes is 7.764 km.
The Kotež district was selected as a pilot DMA to investigate water savings at reduced pressures. The Kotež DMA includes 203 building service connections supplying 6 409 residents, 152 service connections for individual households (2 households sharing 1 service connection) and 1 commercial service connection (a total of 356 service connections). Water meters are placed on each service connection. The total number of inhabitants (consumers) in the Kotež DMA is 7 625.
According to data on revenue water from the Belgrade Water Utility, specific water consumption in the Kotež DMA is 220 ℓ∙capita-1∙d-1. During the experimental period (June 2011), according to water meter readings, specific water consumption was approximately 250 ℓ∙capita-1∙d-1. Billed annual water consumption of the commercial consumer was 60 m3∙yr-1. High values of specific water consumption are an indicator of irrational water use and high amounts of water wasted on broken plumbing downstream of households' water meters. According to the flows and water volumes registered on water meters, NRW is estimated to be 20% of SIV.
This relatively high consumption recorded in Kotež was also observed in other parts of Belgrade during investigations which included the development of a detailed hydraulic model of the 1st pressure zone of Belgrade's water distribution network (Martinet and Thetiot, 2006). These investigations included the establishment of a pilot DMA in one of the residential areas of the Belgrade WDS and extensive water metering and monitoring. Registered water consumption in the DMA at the time was approximately 200 ℓ∙capita-1∙d-1, while in the previous period, billed water consumption was even higher. At the same time, the night household consumption in the metered area was registered at 3 ℓ∙capita-1ℓ∙h-1 which was significantly higher than values reported in other studies (WSA/WCA, 1994).
Available data from other water utilities in Serbia indicate that specific consumption in larger urban developments is often 200 ℓ∙capita-1∙d-1 or higher (Topalovic et al., 2012). Such high consumption per capita rates are frequent in Serbia and the developing countries particularly when potable water is an inexpensive budget category and public awareness on rational water consumption is low. Also, it has been suggested that leakage downstream of the point of delivery may also be a significant contributing factor to high metered consumption (Lugoma et al., 2012).
A fixed outlet PRV has been installed in the main inlet pipeline into the Kotež DMA, in a concrete chamber designed for measurement and monitoring purposes. Pressure and flow monitoring downstream of the PRV is performed with a Spectrascan Microlog-2L turbine transducer with data logger. Data were registered and logged every 15 min. The hydraulic model of the Kotež DMA was developed in EPAnet software (Rossman, 2000). Network and other model input data were obtained from the Belgrade Water Utility. Readings of consumers' water meter in the Kotež DMA were performed before and after the completion of the experiment. Nodal demands were calculated according to exact network data on the number and position of service connections within the DMA. The model was developed to select nodes that will be used as representative for the Average Zone Pressure (AZP) and Critical point pressure. However, the model could not be considered to be calibrated, due to the fact that there were no measurements of pressure or flow rates inside the DMA.
In the period from 8 to 17 June 2011, flow and pressure monitoring was carried out at unregulated inlet pressures. Determination of minimal inlet pressure into the DMA is often a complex task that includes hydraulic modelling of the DMA under peak consumption and analyses of minimal pressures in critical nodes (Jacobs and Strijdom, 2009). Hydraulic analyses of Kotež DMA indicated that minimal inlet pressure, that should guarantee supply without shortages during peak flows in the DMA, is in the range of 28 to 30 m, which is much less than unregulated inlet pressure into the DMA (approx. 60 m during night).
However, in order to examine MNF under various reduced inlet pressures, during nighttime hours on 17 to 18 June 2011 measurements were carried out at fixed-outlet pressure downstream of the inlet point at 17.7 m. In the morning of 18 June 2011 fixed-outlet pressure was increased to 29.5 m, and after 20 June 2011 the pressure log probe broke down and consequently monitoring data from that point onward were no longer available. An insufficient amount of monitoring data due to frequent failures of monitoring equipment is a common obstacle in WDS governance and monitoring in the developing countries.
Inlet point pressure in the hydraulic model of the Kotež DMA is set according to field monitoring results. An hourly water demand pattern was determined according to registered flow data. Previously listed data were sufficient for the DMA model setup. A hydraulic model was developed for initial and reduced pressure consumption patterns.
RESULTS
Monitoring at unregulated (initial) pressure
Pressure and flow monitoring data at unregulated (initial) pressure revealed the following results:
• Average daily flow: 2 450 m3∙d-1 (28.5 ℓ∙s-1)
• Max registered flow: 34.3 ℓ∙s-1
• Min registered flow: 19.1 ℓ∙s-1
• Max registered inlet pressure: 63 m
• Min registered inlet pressure: 36 m
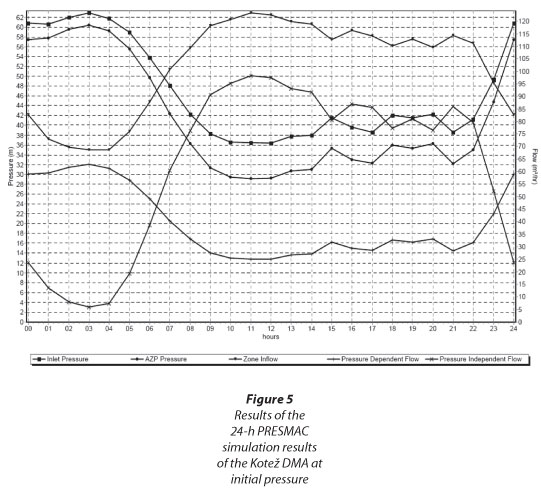
During the monitoring period at initial pressure, variations in pressure and water consumption were approximately the same each day of the monitoring period. Therefore, a single day (Sunday 12 June) was selected for comparison with the monitoring results at reduced pressures (since the same day of the week was monitored at reduced pressures). The 24-h monitoring data and EPAnet hydraulic simulation results are presented in Fig. 3.
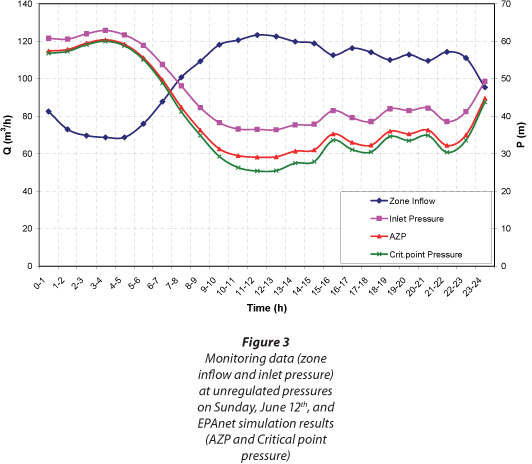
An average zone pressure (AZP) was calculated for each time interval during 24 h. Hydraulic simulation results indicated that AZP occurs at Node 28 every hour during the day. Daily AZP (AZPday) is an average of AZPs during 24 h. Average inflow in the DMA is 102.4 m3∙h-1. MNF was registered between 03:00 and 04:00 and amounted to 68.74 m3∙h-1 (the absolute minimum was 18.74 ℓ∙s-1). AZNP at Node 28 was 60.4 m and daily AZP (AZPday) was calculated to 40.8 m.
Monitoring results under initial pressure led to the following conclusions:
• Under initial pressure high fluctuations in water pressure occur (up to 30 m), which has a deteriorating effect on pipe material and causes the occurrence of cracks and other pipe damage. Pressure drop at the hourof maximum water consumption is caused either by small pipe diameters or by reduced valves upstream of the inlet point.
• High initial pressures at the inlet point (up to 65 m) that occur during the night increase leakage rates and cause physical damage to pipes and household plumbing.
• MNF registered at 18.74 ℓ∙s-1 is 67% of daily average water inflow, which is, in regard to the type of consumers (only households, no industrial consumers), an indication of high levels of water losses in the DMA. Besides 1 eakage,a substantial portion of water is wasted in household plumbing. It is worth mentioning that monitoring was carried out during a wet weather period so water was not used for garden watering.
Monitoring at reduced pressures
During nighttime hours from 17 to 18 June 2011, measurements were performed at fixed-outlet pressure of 17.7 m, for MNF measurement purposes only. The MNF was registered at 01:00 and amounted to 5.26ℓ∙s-1.
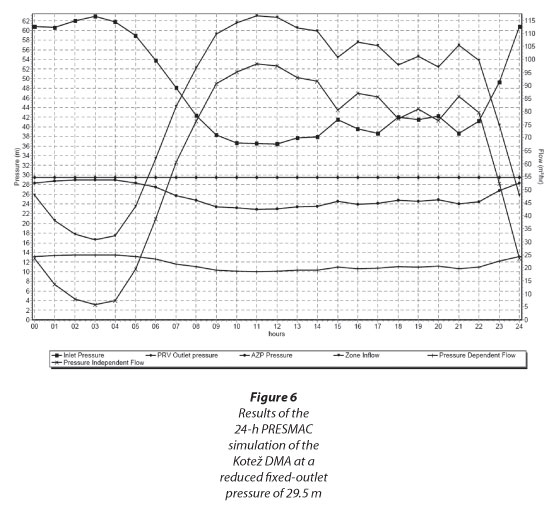
Monitoring results for 19 June 2011 at 29.5 m fixed-outlet pressure at the inlet point are presented in Fig. 4, together with EPAnet hydraulic simulation results. Average inflow amounted to 63.75m3∙h-1. MNF was registered between 04:00 and 05:00 and amounted to 30.2 m3∙h-1 while the absolute minimum value was 7.24 ℓ∙s-1. AZNP at Node 28 at the time of MNF was 28.7 m.
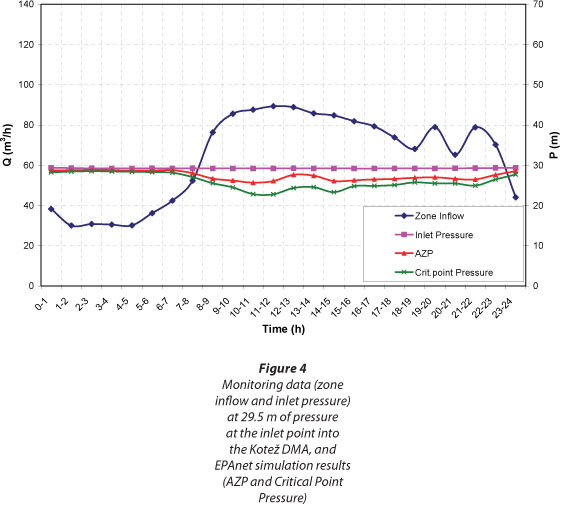
Measured results clearly show significant influence of pressure reduction on the reduction of inflow to the DMA, i.e. reduction of water losses (leakage) and water consumption. The water savings assessment in the Kotež DMA under reduced pressures, by using different methods, is presented in the following sections.
Water savings assessment
LI method for water savings assessment
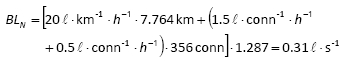
Applying the LI methodology, and in regard to data in Table 1 and Table 2, assuming a good state of WDS infrastructure, background night leakage (without bursts) in the DMA is calculated as:
where:
1.287 is the pressure correction factor (PCF) at AZNP = 60.4 m
The minimum Net Night Flow (NNQ) without bursts and large consumers is estimated when the night consumption component is added to a calculated background night leakage:
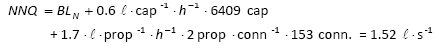
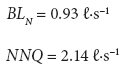
Since there are no large consumers in the DMA, NNQ should be equal to MNF (Fig. 1). Significantly higher values of registered MNF (registered at 18.74ℓ∙s-1 compared to the estimated 1.52ℓ∙s-1) indicate the poor condition of the water distribution infrastructure as well as large amounts of water wasted through leaky household plumbing. If the poor condition of the water distribution infrastructure is assumed, then the background leakage and NNQ amount to:
Since the data from Table 2 used in previous calculations are obtained in statistical calculations of registered data upon burst elimination, calculated value of minimum net night flow does not include burst water losses. Besides undetected bursts, large differences between registered and calculated NNQ might be caused by irrational water consumption or losses downstream from the point of delivery. Plumbing fittings of poor quality that are often offered at low prices in developing countries might be the cause of high wastage of water in households, which is also indicated by the high values of registered specific water consumption.
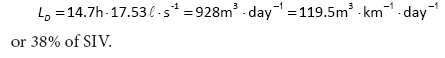
For daily water loss assessment AZP needs to be calculated for the Kotež DMA. Continuous 24 h computer simulation of the water distribution system in the Kotež DMA showed that AZP occurs at Node 28. AZNP at Node 28 was 60.4 m giving LI = 45.5. Total daily water loss is estimated according to Eq. (3), considering daily pressure variations and multiplication factor T. Due to large daily pressure variations, up to 30 m, time factor T was calculated and amounted to 14.7 h.
Assuming good condition of the water distribution infrastructure, total night flow losses (TNFL) on the day of simulation were calculated as:

Then, daily water losses are (Eq. (3)):
At fixed-outlet pressure of 17.7 m at the inlet point, hydraulic simulation showed AZNP = 17 m and consequently LI =10 (Eq. (1)). Then, estimated MNF is:
Registered MNF was 5.2 ℓ∙s-1 at a fixed-outlet pressure of 17.7 m at the inlet point.
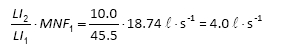
At fixed-outlet pressure of 29.5 m at the inlet point, hydraulic simulation showed AZNP = 28.7 m and consequently LI = 17.8 (Eq. (1)). Then, estimated MNF is:
Registered minimum night flow was 7.2 l-s-1 at fixed-outlet pressure of 29.5 m at the inlet point. The above results indicate that LI methodology (Eq.( 1)) provides very good estimates of MNFs at reduced pressures in the investigated Kotež DMA.
Application of LI methodology also provides estimates of daily water savings at reduced pressure. For reasons given above, only the results obtained at reduced inlet pressure at the inlet point of 29.5 m will be used for estimation, and for this case the calculated value of multiplication factor T is 21 h. If the night consumption in households (1.21 ℓ∙s-1) is subtracted from minimum net night flow, total daily water losses are (Eq. (3)) 460 m3∙d-1. Water saving is estimated as a difference between daily water losses for unregulated inlet pressure and for reduced inlet pressure, and amounts to 468 m3∙d-1.
On the simulation day at fixed-outlet pressure of 29.5 m, the total amount of registered water saving was 927 m3∙d-1. A pressure reduction in water distribution networks inevitably leads to the decrease of overall water consumption which was not taken into consideration in previous calculations and is assumed to be the main reason for the discrepancy between the registered and calculated values. This is particularly important in water distribution systems experiencing excessive pressures and high specific consumption where a substantial amount of wasted water is assigned to irrational consumption or leakage after the point of delivery.
PRESMAC model for water savings assessment
In 1999 the South African Water Research Commission launched a research project to investigate, promote and implement water savings techniques and methodologies suited to local circumstances. During project development a Pressure Management Model - PRESMAC - was developed based on BABE methodology (McKenzie, 2001). The PRESMAC pressure management model is used to assess the likely savings (in monetary terms) of various pressure reduction options in a selected DMA. The PRESMAC model is based on Eq. (4) and the head loss equation for estimation of head loss between the inlet point and both the AZP and critical points for any particular flow. It is a simplification of the normal friction factor equation in which all of the terms excluding the flow are lumped into a single coefficient K:

where:
HL is head loss (m)
K is head loss coefficient (h2·m-5)
Q is flow (m3·h-1)
The PRESMAC model was used for calculations of water savings at reduced pressures in the Kotež DMA. Input network data such as number of service connections; length of pipelines; number of properties; population; expected leakage rates from connections, properties and mains; pressure exponent for the system as a whole; details of any commercial consumers; had to be provided for the model setup. In addition, three 24-h pressure profiles and the 24-h zone inflow are provided. The average hourly values, based on measured values (4 per hour), are provided for the pressure at the inlet point, the pressure at the average zone point, the pressure at the critical point and for inflows to the zone. The value of calculated pressure exponent N1 is 1.26.
Based on the PRESMAC model calculations, the following results are obtained for the day with initial (unregulated) pressure:
• Total daily pressure-dependent water volume: 931.19 m3
• Total daily pressure-independent water volume: 1 525.40 m3
• Total daily input volume: 2 456.60 m3
• Time factor T = 14.8 h
• MNF is 68.74 m3∙h-1 (19.1 ℓ∙s-1)
For the day with reduced fixed-outlet pressure at 29.5 m, the PRESMAC model provided the following results:
• Total daily pressure dependant water volume: 509.29 m3
• Total daily pressure independent water volume: 1 525.50 m3
• Total daily input volume : 2 034.79 m3
• Time factor T = 20.4 h
• MNF is estimated at 30.8 m3∙h-1 (8.5ℓ∙s-1)
Detailed PRESMAC 24-h simulation results at initial and reduced fixed-outlet pressure (at 29.5 m) are presented in Fig. 5 and Fig. 6, respectively.
The results show that estimated water savings are 422 m3∙d-1 which is much lower than the registered 927 m3∙d-1. However, this discrepancy could be expected since the authors of PRESMAC state that, in practice, assumptions and simplifications upon which the PRESMAC model is based lead to much lower predicted savings than actually achieved (McKenzie, 2001).
• Water losses in distribution mains and network upstream water meters (point of delivery)
• Authorised consumption, which consists of:
- Water that was actually used by consumers, including excessive water use
- Leakage inside buildings - water wasted inside buildings in leaky plumbing due to poor maintenance
Water losses/consumption relations to pressure are described by Eq. (4). It is assumed that a pressure exponent has different values for water losses in the distribution network upstream water meters ( N1), water consumption ( N2) and leakage inside buildings (N3).
In the LCP method, specific water consumption inside DMA (qtot, in ℓ∙capita-1∙d-1) is divided into water that is actually used by consumers - consumption (qwc), and leakage inside buildings (qlib):

where:
qtot is derived from data that are usually readily available from the waterworks company (meter readings - billed consumption, number of consumers) and corresponds to the initial (unregulated) pressure conditions in the DMA.
Additional input data are as follows: the total number of consumers (Npop), the number of service connections (Nconn) and measured inflows into the DMA under unregulated and regulated pressure conditions.
Unknown parameters in the LCP method are: qwc, qlib, N1, N2 and N3. The first 3 parameters (qwc, qlib and N1) are calculated from measurement data (explained below), which leaves only 2 parameters (N2 and N3) that need to be adopted in order to achieve the best estimate on water savings.
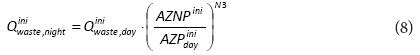
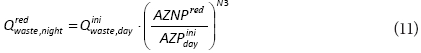
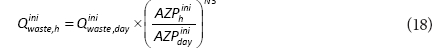
This method requires iterative calculation that starts with an initial qlib estimate as a fraction of qtot Based on an initially adopted value of qlib, daily leakage rates inside buildings at the initial inlet pressure (Qiniwaste,day) can be calculated as:

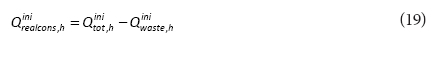
The estimated leakage rate inside buildings at the time of MNF and at AZNPini is:
It is also assumed that night consumption downstream from the water meters (property line) includes 6% of active pressure-independent consumers consuming 10 ℓ∙h-1, or 0.6 ℓ∙capita-1-h-1; or 1.7 ℓ∙household-1∙h-1 (McKenzie, 1999). The total night consumption is obtained by adding night consumption to the calculated value.

Total night consumption subtracted from registered MNFinnight yields night water losses (WL):

At reduced (regulated) pressure at the inlet into the DMA, estimated leakage inside buildings at the time of MNF and AZNP is:
Adding the night consumption to the estimated leakage rate inside buildings at the time of MNF, total night consumption is:

Total night consumption subtracted from registered MNFrednight yields water losses (WL):

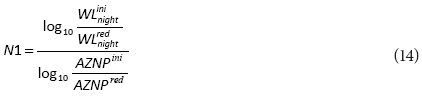
Using the above values, the pressure exponent (N1) for water losses in the distribution network is calculated as:
Conditions at initial (unregulated) inlet pressure
For each interval over a 24-h period, an average hourly inflow in the DMA and average pressure is determined from the measured data. Water losses on an hourly basis are calculated as follows:
where:
WLhini is hourly water losses
WLini night is water losses at the MNF time
AZPinih is hourly average zone pressure at initial (unregulated) inlet pressure
AZNPini average night zone pressure
Total hourly consumption is determined by subtraction of water losses from registered inflow into the DMA:
However, the calculated value has to match the registered specific water consumption (qtot). If not, the assumption on leakage inside buildings (qlib) needs correction by the value Aq calculated as a difference between registered and calculated specific water consumption:
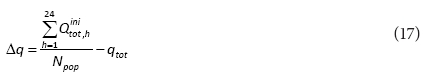
The corrected value of qlib that will be used in the next iteration is: qiterlib= qiter-1lib + Δq. The next iteration starts with Eq. (7). The LCP method usually requires only a few iterations to fulfil the required accuracy of Δq < 0.1 ℓ∙capita-1∙h-1. In previous steps, parameters: qwc, qlib and N1 are determined. Then, the total water delivered to consumers (downstream the property line or water meter) is divided into consumption and leakage inside buildings. Leakage inside buildings, on an hourly basis, is calculated as:
Actual water consumption, on an hourly basis, is calculated as:
Conditions at reduced fixed-outlet pressure
Calculations are performed in similar manner as for the initial pressure conditions, as follows:
where:
WLhred is hourly water losses
AZPhred is hourly average zone pressure, all at reduced inlet pressures
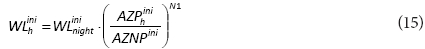
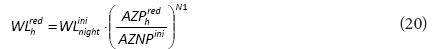
Average hourly leakage rates inside buildings are calculated in the same manner as leakage at initial pressures, except that the AZPhred represents average daily zone pressure at reduced pressure conditions:
Actual water consumption at reduced pressure is determined when water consumption is multiplied by (AZPhred / AZNFini)N2. It was also assumed that the minimum night consumption, at the time of MNF, is pressure-independent.
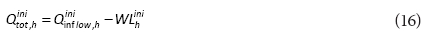
The final result of the LCP method is the calculated inflow in the DMA for reduced (regulated) pressure conditions:

The described LCP method was applied and tested on the Kotež DMA. According to water metering data from the Belgrade
Water Utility specific water consumption (qtot) in the Kotež DMA, during the experimental period was 250 £-capita_1-d_1. The total number of inhabitants (Npop ) is 7 625 and Nconn is 152.
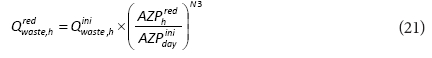
Model input data are calculated according to the monitoring results: AZNPini= 60.40 m, AZPdayinii= 40.80 m, MNF night ini = 68.74 m3∙h-1, MNF nightred = 30.56 m3∙h-1 and AZNPred = 28.75 m.
As recommended by Lambert and Taylor (2010), the adopted values for pressure exponents were 0.5 for N2 and 1.0 for N3. In order to start iterative calculations of qlib and qwc, it was assumed that only 10% of total specific consumption (qtot) is leakage inside buildings (qlib). As a result of iterative calculations (Eqs 7 - 17), qlib was calculated to be 50 ℓ∙capita-1∙d-1 and qwc was 200 ℓ∙capita-1∙d-1.
Estimated daily leakage rate inside buildings within the DMA at initial inlet pressure (Eq. 7) is:

Estimated leakage rate inside buildings at the time of MNF and at AZNPini = 60.40 m (Eq.(8)) is:
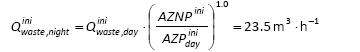
Total night consumption is 27.9 m3∙h-1 (Eq. (9)). Hence, the calculated night water losses are 40.86 m3∙h-1 (Eq. (10)).
At 29.5 m inlet pressure, estimated leakage inside buildings at the time of MNFred and AZNPred of 28.75 m, (Eq. (11)) is:
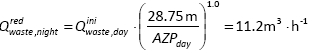
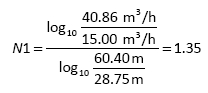
while the total night consumption is 15.6 m3∙h-1 (Eq. (11)). Calculated night water losses are 15.0 m3∙h-1 (Eq. (13)). Pressure exponent (N1) for water losses in the distribution network amounts to (Eq. (14)):
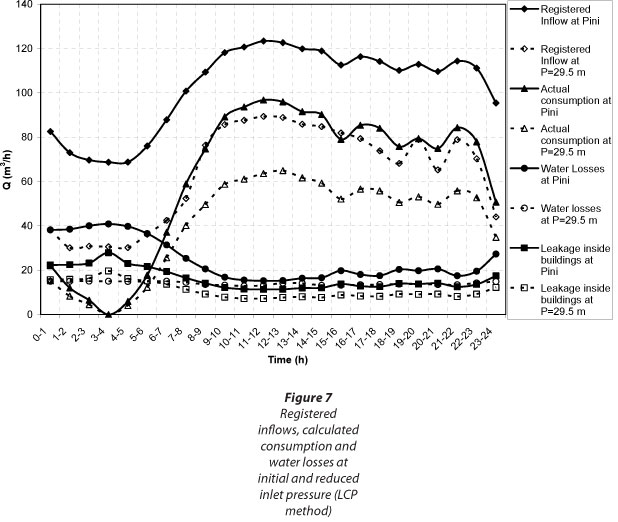
Registered inflows, calculated consumption and water losses at initial and reduced inlet pressure are shown in Fig. 7. A summary of LCP calculations is presented in Table 3.
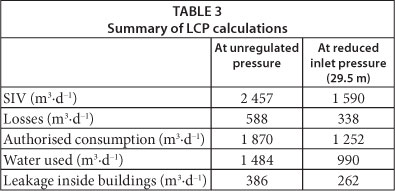
Estimated total input volume into the DMA at reduced pressure is 1 590 m3∙d-1, showing that total water savings, comparing to total input volume at initial (unregulated) pressure, are 867 m3∙d-1. This value is close to the registered value of 927 m3∙d-1 (6% difference).
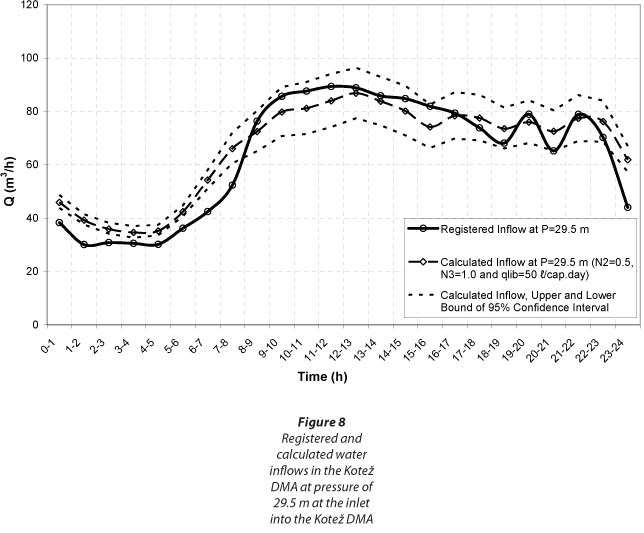
Also, a comparison between registered inflows and inflows into the DMA calculated as a sum of consumption and leakage components, shows a reasonably good agreement over the considered time period, as shown in Fig. 8.
In order to test sensitivity of the LCP method on variation of input parameters: N2, N3 and initial value of qlib, a simple sensitivity analysis is conducted for the day when inlet pressure into the Kotež DMA was reduced to 29.5 m. It was assumed that parameters are normally distributed with average values that are: N2=0.5, N3=1.0 and qlib=50 ℓ∙capita-1∙d-1, and standard deviations that are 25% of average values. The method was run 1 000 times with randomly generated parameters, and calculated results for inflows into the DMA, in the form of a 95% confidence interval, are presented in Fig. 8.
CONCLUSION
It is common in developing countries for water distribution networks to suffer from excessive pressures, large daily pressure variations and high water consumption per capita. The Kotež DMA, where high specific water consumption of 250 ℓ∙capita-1∙d-1 was observed, was selected for investigation of water savings at reduced pressures. A fixed outlet PRV has been installed in the main inlet pipeline into the Kotež DMA, and flow and pressure monitoring was carried out at unregulated and reduced inlet pressures of 29.5 and 17.7 m. Monitoring at unregulated inlet pressure showed high pressure variations (up to 30 m) in the DMA and high MNF, suggesting that a high level of leakage occurs. Monitoring results at unregulated pressure and at reduced inlet pressure of 29.5 m showed that the reduction of pressure led to water savings (reduction of SIV) of 927 m3∙d-1. The following methodologies were applied for estimation of water savings at reduced pressures in the Kotež DMA:
• Leakage Index was used for estimation of real water losses (leakage) under initial and reduced pressures, while water consumption was assumed to be pressure independent. Estimated water savings under reduced pressure were 468 m3∙d-1, which is 50% of the registered water savings in the DMA.
• The PRESMAC pressure management model was used for assessment of water savings. The model, by using its algorithm, calculates portions of pressure-dependent and pressure-independent water consumption volumes. Estimated water savings under reduced pressure were 422 m3∙d-1, or 46% of the registered water savings.
• A new method (named the Leakage-Consumption-Pressure - LCP method) was developed under the assumption that not only leakage, but also water consumption, is pressure dependent. In the case of the examined Kotež DMA, this assumption can be justified by the fact that the measured data for the inflow into the DMA consist of actual flow rates, and not volumes. Additionally, it is assumed that the metered water consumption consists of water actually used by the consumers and water leakage inside buildings. Dependence of consumption and losses on pressure is described by Eq. (4). The LCP method includes iterative calculations, described in the paper, to determine leakage inside buildings. Monitoring results at initial and reduced pressures at the inlet to the DMA were used to calculate the pressure exponent for water losses in the distribution network. Pressure exponents for water used by consumers and leakage inside buildings were estimated by using recommendations from literature, and amounted to 0.5 and 1.0, respectively. Estimated water savings under reduced pressure were 867 m3∙d-1, or 94% of the registered water savings in the DMA. Sensitivity analysis indicated low sensitivity of calculated water inflows (SIV) to variations of input parameters. The assumptions adopted in this paper on pressure exponents should be subjected to further analyses and investigations.
In similar water distribution networks with high water consumption per capita, where excessive pressures and large pressure variations occur, impact of pressure on water consumption should not be neglected since the assessment of water savings at reduced pressures is likely to be underestimated.
ACKNOWLEDGEMENT
The authors are grateful to the Serbian Ministry of Education, Science and Technological Development for financial support through Projects No. TR-37009 and TR-37010.
REFERENCES
ALEGRE H, BAPTISTA JM, CABRERA JR E, CUBILLO F, DUARTE P, HIRNER W, MERKEL W, PAREN R (2006) Performance Indicators for Water Supply Services. IWA Publishing, London. 125-130. [ Links ]
FANTOZZI M and LAMBERT A (2008) Recent developments in predicting the benefits and payback periods of introducing different pressure management options into a Zone or small distribution system. IWA Conference Proceedings 'Water Loss Management 2008', June 2008, Skopje. URL: http://www.miya-water.com/user_files/Data_and_Research/miyas_experts_articles/3_DMAs_Pressure_management/12_ Recent%20developments%20in%20predicting%20the%20benefits%20and%20payback%20periods%20 of%20introducing%20different%20pressure%20management%20options.pdf (Accessed March 2013). [ Links ]
GIUSTOLISI O, SAVIC D, KAPELAN Z (2008) Pressure-driven demand and leakage simulation for water distribution networks. J. Hydraul. Eng. 134 (5) 626-635. [ Links ]
GREYVENSTEIN B and VAN ZYL JE (2007) An experimental investigation into the pressure-leakage relationship of some failed water pipes. J. Water Supply Res. T 56 (2) 117-124. [ Links ]
JACOBS HE and STRIJDOM JL (2009) Evaluation of minimum residual pressure as design criterion for South African water distribution systems. Water SA 35 (2) 183-191. [ Links ]
KINGDOM B, LIEMBERGER R and MARIN P (2006) The Challenge of Reducing Non-Revenue Water (NRW) in Developing Countries. The World Bank, Washington, DC. [ Links ]
LAMBERT A (2001) What do we know about pressure: leakage relationships in distribution systems? IWA Conference Proceedings on System Approach to Leakage Control and Water Distribution Systems Management, Brno. ISBN 80-7204-197-5. [ Links ]
LAMBERT A and TAYLOR R (2010) Water Loss Guidelines. Water New Zealand - The New Zealand Water and Wastes Association, Wellington. 53 pp. [ Links ]
LUGOMA MFT, VAN ZYL JE and ILEMOBADE AA (2012) The extent of on-site leakage in selected suburbs of Johannesburg. Water SA 38 (1) 127-131. [ Links ]
MARTINET T and THETIOT L (2006) Improvement of Belgrade Water Supply System. Final Report. SCE Aménagement-Environnement & Belgrade Water Utility, Belgrade. 62-65. [ Links ]
MAY J (1994) Pressure dependent leakage. World Water Environ. Eng. Manage. 17 (8) 13. McKENZIE R (2001) Pressure Management Program (PRESMAC). WRC Report No. TT 152/01. Water Research Commission, Pretoria. 1.17-1.18. [ Links ]
McKENZIE R (1999) Sunflow - South African Night Flow Analyses Model User Guide. WRC Report No. TT 109/99. Water Research Commission, Pretoria.
MUTIKANGA HE (2012) Water Loss Management: Tools and Methods for Developing Countries. PhD thesis, UNESCO-IHE Institute for Water Education, Delft University of Technology. [ Links ]
ROSSMAN LA (2000) Epanet 2 - Users Manual. National Risk Management Research Laboratory Office of Research and Development U.S. Environmental Protection Agency, Cincinnati, OH. [ Links ]
THORNTON J and LAMBERT A (2005) Progress in Practical Prediction of Pressure: Leakage, Pressure: Burst Frequency and Pressure: Consumption Relationships. Proceedings of IWA Special Conference 'Leakage 2005', September 2005, Halifax. URL: http://173.254.28.127/~leakssui/wp-content/uploads/2012/11/2005_ThorntonLambert-IWA-Halifax-2005U.pdf (Accessed March 2013).
TOPALOVIC S, DUKIC A and NAUNOVIC Z (2012) Cost recovery of water and wastewater utilities in Serbia. Water Res. Manage. 2 (4) 19-32. [ Links ]
TRIFUNOVIC N and VAIRAVAMOORTHY K (2012) Simplified emitter based approach for pressure-driven demand calculations of networks with extreme topography. 14th Water Distribution Systems Analysis Conference, 24-27 September 2012, Adelaide, South Australia. [ Links ]
WSA/WCA ENGINEERING AND OPERATIONS COMMITTEE (1994) Managing Leakage: UK Water Industry Managing Leakage Reports A-J. Report A - Summary Report; Report B - Reporting Comparative Leakage Performance; Report C - Setting Economic Leakage Targets; Report D - Estimating Unmeasured Water Delivered; Report E - Interpreting Measured Night Flows; Report F - Using Night Flow Data; Report G - Managing Water Pressure; Report H - Dealing With Customer's Leakage; Report J -Techniques, Technology and Training. WRC/WSA/WCA, London.
 Correspondence:
Aleksandar Dukić
(+381) 11 3218 557
e-mail: djukic@grf.bg.ac.rs
Received 29 April 2013
Accepted in revised form 3 March 2014

