


Services on Demand
Article
 English (pdf)
 Article in xml format
 Article references
Indicators

Related links
-
 Cited by Google
 -
 Similars in Google
Share

 Permalink
Water SA
On-line version ISSN 1816-7950
Print version ISSN 0378-4738
Water SA vol.40 n.2 Pretoria Apr. 2014
Validation of remotely-sensed evapotranspiration and NDWI using ground measurements at Riverlands, South Africa
Nebo JovanovicI; Cesar L GarciaII, III; Richard DH BuganI; Ingrid TeichII, IV; Carlos M Garcia RodriguezII, V
ICSIR, Natural Resources and Environment, PO Box 320, Stellenbosch 7599, South Africa
IICONICET, Haya de la Torre S/N, Campus Univ. Nacional de Córdoba, C.P 5000, Argentina
IIIEHCPA, Universidad Católica de Córdoba, Av. Armada Argentina 3555, Campus Córdoba, C.P 5017, Argentina
IVEstadística y Biometría, Facultad Ciencias Agropecuarias, Av Valparaiso S/N, Campus Univ. Nacional de Córdoba, C.P 5000, Argentina
VCETA, Facultad de Ciencias Físicas Exactas y Naturales, Av Filloy S/N, Campus Univ. Nacional de Córdoba, C.P 5000, Argentina
ABSTRACT
Quantification of the water cycle components is key to managing water resources. Remote sensing techniques and products have recently been developed for the estimation of water balance variables. The objective of this study was to test the reliability of LandSAF (Land Surface Analyses Satellite Applications Facility) evapotranspiration (ET) and SPOT-Vegetation Normalised Difference Water Index (NDWI) by comparison with ground-based measurements. Evapotranspiration (both daily and 30 min) was successfully estimated with LandSAF products in a flat area dominated by fynbos vegetation (Riverlands, Western Cape) that was representative of the satellite image pixel at 3 km resolution. Correlation coefficients were 0.85 and 0.91 and linear regressions produced R2 of 0.72 and 0.75 for 30 min and daily ET, respectively. Ground-measurements of soil water content taken with capacitance sensors at 3 depths were related to NDWI obtained from 10-daily maximum value composites of SPOT-Vegetation images at a resolution of 1 km. Multiple regression models showed that NDWI relates well to soil water content after accounting for precipitation (adjusted R2 were 0.71, 0.59 and 0.54 for 10, 40 and 80 cm soil depth, respectively). Changes in NDWI trends in different land covers were detected in 14-year time series using the breaks for additive seasonal and trend (BFAST) methodology. Appropriate usage, awareness of limitations and correct interpretation of remote sensing data can facilitate water management and planning operations.
Keywords: Fynbos, LandSAF ET, scintillometry, SPOT-Vegetation NDWI
INTRODUCTION
Accurate quantification of the water cycle is fundamental in assessment, planning, allocation and protection of water resources. Evapotranspiration (ET) and soil water content are the most critical variables in arid areas, where ET may reach nearly 100% of rainfall (Bugan et al., 2012). In addition, soil moisture and ET have a significant impact on the energy, carbon and water cycles. ET is unique in that it provides the link between the energy and water cycles at the land surface as well as between the water and carbon cycle through vegetation transpiration. Soil water plays an important role in partitioning rainfall into runoff and infiltration, two components that determine water supply to ET, and also has a direct impact on weather conditions and thus short-term weather forecasting (LeMone et al., 2007). By understanding how ET and soil water content vary in space and time, a critical component of the water cycle can be understood.
Optical remote sensing from aircraft and satellites involves the measurement of reflected electromagnetic energy using sensors to generate multi- or hyper-spectral digital images. These data can then be used to estimate spatial variables such as surface and cloud temperatures, surface reflectance and wetness, vegetation indices (e.g. the Normalised Difference
Vegetation Index NDVI) that describe the vegetation activity and its energy status, etc. These methods were not available in the past at large scales and high frequency; however, with the latest technological advances, their spatial and temporal coverage and resolution have significantly improved. Broadly, remote sensing methods to link vegetation and ET are classified into empirical and physically-based methods. Empirical methods involve the use of statistical relationships between ET and vegetation indices (e.g. NDVI) (Nadler et al., 2005; Glenn et al., 2007), while the physical approaches are based on either solving the surface energy balance equation (Bastiaanssen et al., 1998a, b; Su, 2002; Mu et al., 2007; Allen et al., 2007a, b; Sinclair and Pegram, 2010) or the application of the combination Penman-Monteith type of equations (Monteith, 1977).
Nowadays, there is an increasing number of remote sensing and earth observation (EO) products obtained from satellite images that are available at continental or global scales for estimating water cycle-related variables such as ET, precipitation, soil moisture, vegetation indices, etc. Nevertheless there is not a similar effort in validating these large-scale products with global or continental coverage in different regions of the world. These products, once properly validated, will enable hydrolo-gists to adopt new and significantly improved approaches for water resource assessment and to move beyond the current approach, which has remained little changed since the 1960s. The EO data can also be used as inputs into spatially distributed hydrological models for the prediction of water flow discharge and quality. Thus, the hydrological models can in turn be applied for catchment water management and used to support water management boards and similar institutions.
The question that needs to be answered in this novel field of remote sensing research is: are satellite estimates of water balance components feasible and accurate? In past research, Ghilain et al. (2011) compared LandSAF (Land Surface Analyses Satellite Applications Facility) ET with ground observations obtained from FLUXNET eddy correlation towers (from the CarboEurope network and national weather services) located in different European climatic regions, in temperate forests and Mediterranean and temperate grasslands. They obtained a correlation of 80-90% between LandSAF ET and ground measurements around midday. LandSAF products have been previously used to test reference ET in Ethiopia: De Bruin et al. (2010) showed that, for the Fogera flood plain, ET determined from LandSAF solar radiation data and the radiation-temperature based approximate formula proposed by Makkink compares well with the ground truth when the locally measured air temperature is used (r=0.88). The Normalised Difference Water Index (NDWI) was used to determine the vegetation water content of agricultural crops in Iowa, USA: Chen et al. (2005) found that NDWI is one the best indexes for corn water content estimation. For linear regressions between corn water content and NDWI obtained from different satellites, they obtained R2 values of 0.84, 0.74 and 0.72. However, linear relationships were not as strong for soybean, which had relatively low water content levels. NDWI was also used to determine the phenology of boreal forests (Delbart et al., 2005), giving better estimations of the start of greening up than NDVI (reduced RMSE, bias and dispersions, and higher correlation). NDWI has also been used to characterise areas that are susceptible to saturation in New York, USA (DeAlwis et al., 2007), to delineate water surfaces (Ji et al., 2009), as well as to observe and quantify riparian vegetation in Namibia (Yoshida, 2005). In South Africa, Verbesselt et al. (2006) used the NDWI as an indication of vegetation moisture for identifying fire danger in the Kruger National Park, while Sinclair and Pegram (2010) developed a spatial soil water model as part of a flood warning hydrological system.
Earth observation-based estimation methods still need more validation effort, particularly for specific conditions of Africa and more specifically Southern Africa. The objective of this study was to test the reliability of EO products for a site at Riverlands Nature Reserve in the Western Cape (South Africa), which supports a near-continuous ground cover of endemic fynbos vegetation. At the studied site, measurements of evapotranspiration with a scintillometer were taken every 30 min for a period of 14 days during October 2010 and soil water contents were monitored at different depths from May 2007 to February 2011. The most adequate time series of satellite ET data to compare with the ground data is that generated by LandSAF, mostly because it is produced at a 30 min and daily time resolution. In the case of soil water content, there are many products available from active satellites and indexes derived from passive satellites, but for this work SPOT-Vegetation NDWI (Normalised Difference Water Index) was chosen, mainly because it is a 10-day composite developed specifically for Africa by the European Union Framework Programme 7 VGT4Africa project (VGT4Africa, 2013). SPOT-VEGETATION-NDWI also presents the advantage of having a 1 km pixel as spatial resolution and a freely available time series from 1998 to the present day. Besides, both LandSAF ET and NDWI can be obtained in real time for the whole African continent with a GEONETCast receiving station (EUMETCast, 2013).
METHODOLOGY
Study area
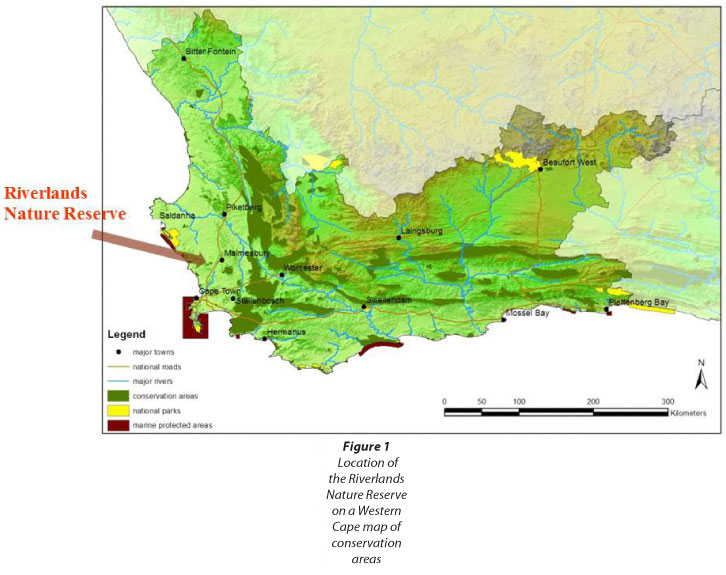
Riverlands Nature Reserve (1 111 ha) was established in 1987 and is one of the important conservation areas managed by Cape Nature Conservation. It is located about 10 km south of Malmesbury (Western Cape, South Africa; Fig. 1). The reserve is in a predominantly flat area (slope <1%), and the soils are deep, well-leached, generally acidic and coarse sand of marine and aeolian origin (Luvic Cambisol; FAO, 1998). The reserve is situated on Cenozoic deposits with Cape granite outcrops occurring in the surroundings. A complete description of the topography, soil physical and chemical properties, and geology has been reported by Jovanovic et al. (2009). The climate is Mediterranean with the mean annual rainfall being about 450 mm, occurring mainly from May to October. Mean potential annual evaporation is about 2 150 mm and daily evaporation exceeds rainfall about 70% of the time.
The dominant vegetation type of the reserve is Atlantis Sand Plain Fynbos (FFd4, Rebelo et al., 2006), one of the 11 forms of Sand Plain Fynbos that occurs on the coastal plains of the western and southern coast of the Western Cape. The reserve has at least 400 plant species, a number of which are endemic. Most of the vegetation of the reserve is relatively young, following fires in 2004 and 2005, but the area of ET measurements was situated in an 11-15 year old stand. Canopy cover, measured with an AccuPar light sensor in the range of photosynthetically active radiation (Decagon Devices Inc., USA), was between 29.0 and 48.9% (39.2% on average). Leaf area index calculated from AccuPar measurements was between 1.12 and 1.54 (1.30 on average).
Evapotranspiration
For ground measurements, a boundary layer large-aperture scintillometer system (BLS900, Scintec AG, Germany) was used to determine fynbos ET in the period 14-27 October 2010. The accuracy of scintillometer measurements was tested previously and compared favourably to Bowen ratio and eddy covariance systems for grassland evaporation (Savage et al., 2010). This window period for ET measurements was chosen to be at season change in spring, at a time when both sunny days with high atmospheric evaporative demand and overcast days with low ET occurred. The BLS900 system measures the averaged structure parameter of the refractive index of air (CN2) over a horizontal path. The BLS900 system determines CN2 and ET over distances of 500 m to 5 km. Estimates of total evaporation are spatially averaged over the area between the transmitter and receiver sensor with a larger proportion of the flux emanating from the middle of the transect. The measurements with the BLS900 system were done over a 1 160 m transect. The coordinates at the transmitter were 33.49665°S, 18.57265°E and the altitude 114 m asl. The receiver was located at 33.50103°S, 18.58454°E and 111 m asl.
Measurements of CN2 together with standard meteorological observations (air temperature, wind speed, air pressure and vertical temperature gradients) collected with an automatic weather station were used to derive the sensible heat flux density (H). The net irradiance was measured using a north-facing net radiometer (CNR1, Kipp & Zonen, Delft, The Netherlands) installed over representative vegetation, while the soil heat flux was measured at 3 different locations using pairs of soil heat flux plates (Campbell Scientific. Ltd, USA) installed at depths of 0.03 and 0.08 m. The latent heat flux (LE) was subsequently calculated as a residual of the simplified surface energy balance equation (Rosenberg et al., 1983), from measurements of net irradiance, soil heat flux and H (estimated with the large aperture scintillometer). The assumptions were closure of the surface energy balance and that the energy used for processes like photosynthesis was negligible. A detailed description of the scintillometer measurements and the set-up used at Riverlands is available in Jovanovic et al. (2012).
The remote sensing estimation of ET was produced by LandSAF using data from MeteoSat. MeteoSat is a series of stationary satellites operating since 1995 with the current MeteoSat Second Generation (MSG) system expected to operate until 2015. MSG provides data for Europe and Africa, specifications of the MeteoSat sensor can be found on the EUMETSAT website (EUMETSAT, 2013). LandSAF has processed EUMETSAT satellite images into daily ET and 30-min ET at a pixel resolution of 3 x 3 km. Daily ET and 30-min ET data have been collected by the satellite since 2007. These data were freely downloaded from the LandSAF site (LSASAF, 2012), following registration on the website. The LandSAF ET is calculated using input data from the MSG satellites and the method considers each pixel as a mix of homogeneous tiles, each tile representing a particular soil surface. In the model, some variables and parameters are defined at the pixel level while others are computed at the tile level. The global pixel value is obtained through the weighted contribution of each tile. The main set of equations used for deriving ET are common to most soil-vegetation atmosphere transfer (SVAT) schemes with specific parameterisations adopted from the ECMWF TESSEL SVAT scheme (Van den Hurk et al., 2000), in which some adaptations have been done in order to use satellite remote-sensing derived data. The complete procedure is described in the user manual (LSASAF, 2011).
The 1 160 m scintillometer transect at Riverlands was located over a fynbos land cover and was coincident with a single LandSAF ET pixel. Most of the fynbos conservation area of the Riverlands Nature Reserve was located in the same LandSAF ET pixel (863 ha), accounting for 65% of its land cover (Fig. 2). Daily ET and 30-min ET data of that specific pixel were extracted for the period from 14-27 October 2010, coincident with the scintillometer measures. According to the UTC (universal time coordinates), the shift between satellite time and local time at the measurement site is 2 h for the period of study. The 30-min ET was integrated into daily values to analyse the concordance of daily and 30-min LandSAF products.

Soil wetness
Soil water contents were measured at different depths in the profile (0.1, 0.4 and 0.8 m), both adjacent to fynbos bushes and in exposed areas. Continuous hourly records were collected with Echo-TE sensors and logged with Echo-loggers (Decagon Devices Inc., USA) from May 2007 to February 2011, with some interruptions due to sensor and logger malfunction. The location of soil water content measurements (33.489574°S; 18.573941°E; 115 m asl) was considered to be representative of the scintillometer transect, as vegetation, canopy cover and sandy soil were relatively uniform across the field. As ground-measures of soil water content and NDWI may co-vary with precipitation, rainfall was included in the analyses. Rainfall data were obtained from a pluviometer placed in the Riverlands Nature Reserve.
The soil water content point-measurements were compared to NDWI calculated from SPOT-Vegetation images. The NDWI is not an estimation of soil water content, but a dimensionless index introduced by Gao (1996) that responds to the presence of water in the soil surface and vegetation. It is calculated according to the formula:
where:
ρ3 is the reflectance in the near-infrared (NIR) band and ρ4 is the reflectance in the short-wave infrared (SWIR) band.
The SWIR is absorbed by water, both as free water bodies or as water contained in plant cells. The index therefore increases with vegetation water content or from dry soil to free water. The formula is similar to that of the well-known NDVI, except for the fact that the NDWI formula contains the SWIR instead of the reflectance of visible (red) light. This usage of SWIR reflectance makes NDWI more sensitive to water content. Detailed information on NDWI can be obtained from the product user manual (VGT4Africa, 2006).
SPOT (Systeme Pour l'Observation de la Terre) is a system of high-resolution satellites operating from 1986 and scheduled to operate until 2023 (SPOT 6 and 7). SPOT satellites have on board a sensor called SPOT-Vegetation with a pixel resolution of 1 x 1 km. The daily images from SPOT-Vegetation are composited to obtain 10-day NDWI images of the African continent, a methodology that provides cloud-free images but is still sufficient to capture the variations of vegetation/water interaction over time (Lewis et al., 1998). The NDWI data were obtained from VITO (Mol, Belgium) through the website of the DevCoCast European Union Framework Programme 7 project (DevCoCast, 2013), where NDWI time series are available from 1998 onward.
NDWI is suitable for identifying long-term trends of the wetness of the land surface because it is an index of the wetness of the land surface combining exposed bare soil and vegetation water content. In addition to the NDWI pixel that matches the measurement location (pixel 5, Fig. 2), another 18 pixels of 10-day NDWI with different land cover were analysed in order to describe its temporal behaviour (Fig. 2). The pixels covered a range of land uses: fynbos (white pixels 2 to 9); land invaded by predominantly Acacia saligna (blue pixels 10 to 14); agricultural land (yellow pixels 15 to 17); invasive cleared/bare soil (pink pixel 18); pixel 1 represents the location of the Reserve office (red). Pixel number 5 corresponds to the location of the fynbos soil water measurement station.
Data analysis
To validate the EO-based estimations, correlations and linear regression models between ground measurements and satellite estimates at both temporal resolutions (daily and 30 min) were evaluated. Measured and satellite-derived evapotranspiration were compared through simple Pearson correlations and an adjusted linear regression model. To analyse the relationship between soil water content and NDWI we also took into account precipitation. First, cross-correlations for several lags between NDWI, precipitation and soil water content at the three different depths (10, 40 and 80 cm) were performed to identify the lag with the maximum coefficient of correlation. Secondly, multiple regression models were adjusted for soil water content with precipitation and NDWI as fixed effects. We also adjusted simple regression models without including precipitation as a covariate. All models were fitted by restricted maximum likelihood. These analyses were performed using InfoStat software (Di Rienzo et al., 2012).
NDWI long-term time series were analysed using the breaks for additive seasonal and trend (BFAST) methodology (Verbesselt et al., 2010a, b). A harmonic seasonal model was implemented in 'BFAST' library of R software (R Core Team, 2013) to account for changes in NDWI. BFAST is an iterative algorithm that combines the decomposition of time series into seasonal, trend and residual components, and allows one to detect trend changes within the time series, while accounting for seasonality. An additive decomposition model is used to iteratively fit a piecewise linear trend and a seasonal model (Haywood and Randall, 2008). For each period between consecutive breakpoints, the slope (ß) was obtained from an adjusted linear model and its significance was assessed with an analysis of variance (ANOVA) test.
RESULTS AND DISCUSSION
Evapotranspiration
Satellite-derived LandSAF ET temporal behaviour was significantly related to the measured ET at Riverlands in the period 14-27 October 2010 (Figs 3 and 4). The Pearson correlation coefficient for the 30-min product was 0.85 and the relationship was statistically significant (p<0.0001). The linear regression model estimated for the 30-min measured ET was ETmeasured =1.032 * ETLandSAF -0.014, with a R2 of 0.72 (Fig. 4). The daily integration of measured and estimated 30-min data showed an improvement in the correlation between the datasets (r = 0.91, p < 0.0001). In this case the R2 of the simple regression model was 0.75 and the adjusted model was ETmeasured =0.899*ET LandSAF + 0.249 (Fig. 4).


When Ghilain et al. (2011) compared LandSAF ET and ground observations obtained from FLUXNET eddy correlation towers, they obtained a correlation of 80-90%, which is within the range of the correlations obtained in this study. Our results show that satellite-derived ET estimates relate well to ground-measured ET at the hourly and daily temporal scales. However, it is necessary to validate the adjusted models and further analyse the relationship in other land covers.
Soil wetness
Soil water content measured at 10, 40 and 80 cm soil depth (SWC10cm, SWC40cm, SWC80cm ), and NDWI (10-day mean of ' daily data) are shown in Fig. 5. Cross correlations between precipitation and soil water content were evaluated only for positive lags, as an effect of precipitation on soil water content can be expected but not vice versa. For the three soil depths, correlation analyses between the NDWI series and soil water content calculated by cross correlation function (CCF) showed positive significant correlations that were higher than with precipitation. Moreover, in the multiple regression analyses, NDWI showed significant and positive regression coefficients after accounting for precipitation, whereas precipitation only had a significant regression coefficient in the model adjusted for SWC40cm. The maximum correlation coefficients between soil water content and precipitation were 0.31, 0.46 and 0.11 (at 10, 40 and 80 cm deep respectively) and in all cases were found at Lag 0 (with no delay). Correlation coefficients between soil water content and NDWI were higher than 0.65; the lags yielding maximum correlation coefficients varied for different depths. The highest correlation with NDWI was found at Lag 1 for soil water content measured at the 10 cm depth (r= 0.80, p<0.0001), meaning that changes in NDWI values occur 0 to 10 days after changes in soil water content. In the multiple regression model for soil water content at 10 cm depth, NDWI at Lag 1 had a positive and significant effect (p<0.0001), whereas precipitation did not (p=0.0684). The adjusted R2 of the fitted model with precipitation as a covari-ate (SWC10cm =0.1369+0.5593*NDWI(at lag 1)+0.0003*Pp(at lag 0)) was 0.71. When precipitation was not included in the model (SWC10cm=0.1447+0.5772*NDWI(at lag 1)) it produced an R2 of 0.70 (Fig. 6).


When the relationship was analysed with soil water content at 40 cm depth, the correlation was highest at Lag 2 (r= 0.69, p<0.0001), which means that NDWI responds to soil water content changes at 40 cm between 10 and 20 days later. The delay in the response can be explained because the NDWI provides an integrated index of wetness of the land surface (combining exposed top soil and plants); the bulk of the root system usually develops at 40 cm soil depth and vegetation takes time to respond to wetting and drying events. In the multiple regression model for soil water content at 40 cm depth (Fig. 7), both NDWI at Lag 2 and precipitation had a positive and significant effect (p<0.0001). The regression coefficient for NDWI was higher than for precipitation (0.4719 vs. 0.0006). The R2 of the adjusted multiple regression model (SWC40cm =0.1576+0.4719*NDWI(at lag 2)+0.0006* Pp(at lag 0)) was 0.59. The R2 of the simple regression model (sWC40cm =0.1447+0.5287*NDWI(at lag 2)) was 0.52.

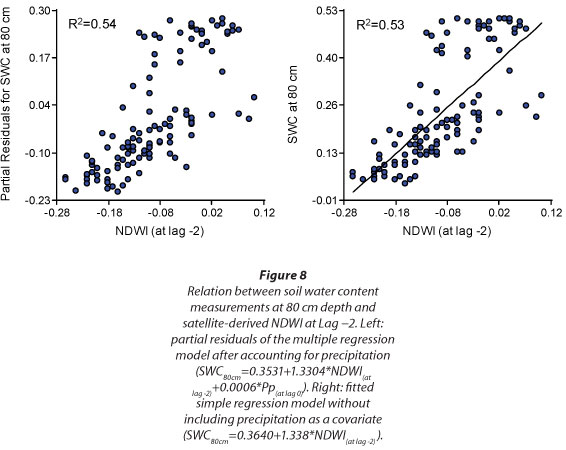
In the case of soil water content measured at 80 cm depth, the maximum correlation was found at Lag-2 (r= 0.72, p<0.0001) meaning that changes in NDWI values occur 10 to 20 days before changes in soil water content. In this case, the multiple regression model showed a positive and significant relation with NDWI at Lag -2 (p<0.0001), but not with precipitation (p=0.1295). The R2 of the adjusted model with precipitation (SWC80cm=0.3531+1.3304*NDWI(at lag -2) +0.0006*Pp(at lag 0) ) was 0.54 whereas for the simpler model the R2 was 0.53 (SW80cm=0.3640+1.338*NDWI(at lag -2)) (Fig. 8). The peak values of soil water content at 80 cm correspond to saturation conditions due to the rising of the shallow groundwater table in the winter rainfall season. These saturation values of soil water content are therefore due to lateral movement of groundwater rather than direct vertical recharge. The rising of the groundwater table due to lateral flow of groundwater takes some time to manifest.
In previous work in California (USA), Serrano et al. (2000) compared hyperspectral reflectances of 23 vegetation stands of chaparral plant communities at different phenological stages and with different canopy cover. They found that NDWI responds not only to canopy structure and cover, but also to relative water content of the vegetation at landscape scale. Similarly, Chen et al. (2005) found correlation coefficients (R2) between 0.52 and 0.84 for soybean and corn grown in Iowa (USA) by comparing NDWI and vegetation water content.
The long-term behaviour of the wetness index can be seen in Figs 9-12 where 14 years of NDWI data (time series of 508 10-day periods from 1998 until 2012) are shown for 4 pixels with different land uses. The decomposition of the NDWI time series into seasonal, trend and remainder components is also shown, as well as the changes detected for both the trend and seasonal components. Seasonal variations in wetness are evident for all pixels. Figure 9 shows the results of BFAST methodology for pixel 5, in which the dominant vegetation is fynbos. No phenological changes were detected in the seasonal component. Two breakpoints and three significant trends were identified and interpreted for the 14-year time series. The decreasing trend (β1=-0.009, p=0.001) in NDWI of the first period (from April 1998 to June 2003) was attributed to the clearing of exotic invasive species in order to re-establish indigenous vegetation in the Riverlands Nature Reserve (Witbooi, 2012). Large areas invaded by Acacia saligna and A. cyclops, which were used to control drift sands from the mid-1800s up to the 1950s, often in areas that were denuded of vegetation by grazing and excessive burning, were cleared countrywide by the Working for Water program (established in 1994 by the South African Department of Water Affairs) in order to conserve water resources. The sandy soil at Riverlands Nature Reserve is inherently well-drained and its top layer dries out during periods between rains. Both indigenous and invasive vegetation taps water from a shallow groundwater table, which fluctuates between about 1 and 2 m soil depth (Jovanovic et al., 2013). As a result of the clearing of relatively dense and mature Acacia stand, less land was covered by vegetation and more soil remained exposed. This increased reflectance, in particular in the SWIR band, and resulted in a decreasing NDWI trend during the period of clearing (1998-2003). Canopy cover was therefore the main determinant in the change of NDWI. During the period from June 2003 to August 2006, NDWI had an increasing trend (β2=0.037, p<0.0001) as the fynbos was recovering. The third period (from June 2006 to May 2012) coincided with the full recovery of fynbos. During this period, NDWI displayed a slightly decreasing trend (β3= -0.009, p<0.0001), possibly due to environmental variability (e.g. rainfall).


The dominant vegetation of pixel 11 (Fig. 10) is invasive Acacia stand, outside the Riverlands Nature Reserve, where clearing has not taken place. In this vegetation, a long period with no trend in NDWI was identified from October 1999 to April 2008 (Fig. 10, p>0.05). Two periods with increasing (April 1998 to October 1999) and decreasing trend (April 2008 to May 2012) were also identified and they were possibly due to environmental variability.
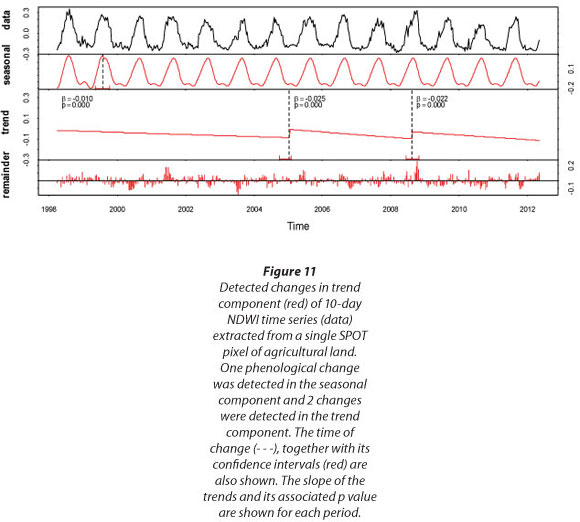
Agricultural land (pixel 15, Fig. 11) showed larger amplitudes of NDWI compared to evergreen fynbos and Acacia forest because cropping is practiced in the area during the winter rainy season, whilst land is dry in summer. Two breakpoints were identified in January 2005 and in August 2008 with 3 periods of significantly (p<0.0001) decreasing trends in NDWI (β1= -0.010, β2= -0.025 and β3= -0.022, respectively). This was entirely dependent on the crops, cropping areas and agronomic practices. A change in seasonality was identified in July 1999. This change in seasonality was also due to changes in farm management, possibly the introduction of new crops and/or planting dates.
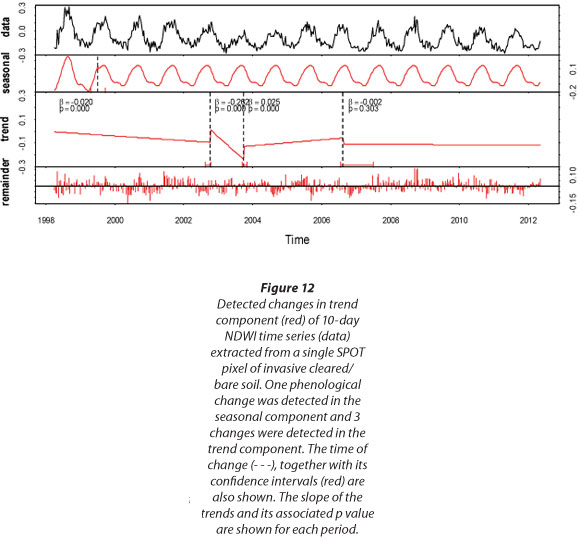
Large seasonal amplitudes in NDWI occurred also on invasive cleared/bare soil (pixel 18, Fig. 12). Three breakpoints were identified in October 2002, September 2003 and August 2006. During the first two periods, from April 1998 to September 2003, blue gum trees (Eucalyptus spp.) were cleared from the area (Witbooi, 2012) and the NDWI showed a decreasing trend (p<0.0001), particularly during the second period (β1 = -0.020, β2 = -0.262). The third period (September 2003 to August 2006) indicates a slightly increasing trend in NDWI (β3 = 0.025, p<0.0001), reflecting the recovery of sparse grass. The slope of the linear model adjusted for the trend in the 4th period was not statistically significant (p=0.303), indicating no changes in mean NDWI during this period. The seasonality change in June 1999 (Fig. 12) could be due to the phased clearing of the Eucalyptus trees.
CONCLUSIONS
This study demonstrated that application of satellite products in water resource management is very promising. However, only appropriate usage, awareness of limitations and correct interpretation of remote-sensing data can facilitate water management and planning operations. Evapotranspiration (both daily and hourly) was successfully estimated with LandSAF products in a flat area dominated by fynbos vegetation that was representative of the satellite image pixel (e.g. Riverlands Nature Reserve). Therefore, this product at 3 x 3 km resolution appears to be promising for large-scale applications in catchment management. However, analyses in areas with other land cover are necessary to further validate LandSAF products. Moreover, in topographically heterogeneous areas, sensor readings may be less reliable due to the effect of shadows, slope, etc. A more detailed study that explores this issue is necessary before using LandSAF products in large and heterogeneous areas.
The NDWI (from SPOT-VEGETATION images) is not a measure of soil water content; it is rather a measure of soil wetness of land surface combining exposed top soil and vegetation. Local calibration and interpretation is possible in order to relate this variable to soil water content at specific depths. NDWI proved suitable to indicate trends, such as, for example, decreasing wetness due to the effects of clearing alien invasive at Riverlands Nature Reserve, when the 14 years of 10-day records were analysed. Additional analysis of NDWI and soil water content data could be done for pixels representing other dominant land covers, in particular considering the soil water content measurements at 40 and 80 cm depth.
Validation analyses of EUMETSat products were carried out in order to determine their accuracy and reliability for inclusion in hydrological models. The outcomes from these analyses provided an unbiased assessment of the data sets under local semi-arid conditions. Further comparisons with ground measures for longer time periods and different land covers should be made in order to proceed to the next phases of research, which will concern testing selected remote-sensing techniques, products and variables (e.g. NDWI, ET) as inputs to selected hydrological models (e.g. distributed models), thereby integrating the information derived from remote sensors and hydrological models for various applications. The benefits of using remote sensing and hydrological modelling are envisaged to be in the accurate quantification of the catchment water balance and facilitation of a variety of operational and management actions, such as, for example, water demand, allocation and use, water use efficiency, water footprinting, management of carbon and land resources, drought, flood and climate change studies, risk assessment for bushfires and dust storms, removal of alien plant species, irrigation scheduling and planning for food security.
ACKNOWLEDGEMENTS
The authors acknowledge the CSIR Parliamentary Grant and the National Research Foundation (NRF) for funding the research, Riverlands Nature Reserve (Cape Nature) for providing the study site, and the Water Research Commission for funding the historic data collection. Dr Caren Jarmain and Dr Colin Everson (University of KwaZulu-Natal), Dr Sebinasi
Dzikiti and Ms Sumaya Israel (CSIR) are acknowledged for assisting with the scintillometer data collection; Dr David Le Maitre (CSIR) is thanked for the vegetation description. We also greatly appreciate the constructive feedback we received from two anonymous reviewers.
REFERENCES
ALLEN RG, TASUMI M and TREZZA R (2007a) Satellite-based energy balance for mapping evapotranspiration with internalized calibration (METRIC) - Model. J. Irrig. Drain. Div. 133 (4) 380-394. [ Links ]
ALLEN RG, TASUMI M, MORSE A, TREZZA R, WRIGHT JL, BASTIAANSSEN W, KRAMBER W, LORITE I and ROBINSON CW (2007b) Satellite-based energy balance for mapping evapotran-spiration with internalized calibration (METRIC) - Applications. J. Irrig. Drain. Div. 133 (4) 395-406. [ Links ]
BASTIAANSSEN WGM, MENENTI M, FEDDES RA and HOLTSLAG AAM (1998a) A remote sensing surface energy balance algorithm for land (SEBAL) 1. Formulation. J. Hydrol. 212-213 198-212. [ Links ]
BASTIAANSSEN WGM, PELGRUM H, WANG J, MA Y, MORENO JF, ROERINK GJ and VAN DER WAL T (1998b) A remote sensing surface energy balance algorithm for land (SEBAL) 2. Validation. J. Hydrol. 212-213 213-229. [ Links ]
BUGAN RDH, JOVANOVIC NZ and DE CLERCQ WP (2012) The water balance of a seasonal stream in the semi-arid Western Cape (South Africa). Water SA 38 201-212. [ Links ]
CHEN D, HUANG J and JACKSON T (2005) Vegetation water content estimation for corn and soybeans using spectral indices derived from MODIS near- and short-wave infrared bands. Remote Sens. Environ. 98 (2-3) 225-236. [ Links ]
DELBART NJ-P, KERGOAT L, LE TOAN T, LHERMITTE J and PICARD G (2005) Determination of phenological dates in boreal regions using Normalised Difference Water Index. Remote Sens. Environ. 97 (1) 26v38. [ Links ]
DE BRUIN HAR, TRIGO IF, JITAN MA, TEMESGEN ENKU N, VAN DER TOL C and GIESKE ASM (2010) Reference crop evapotranspi-ration derived from geo-stationary satellite imagery: A case study for the Fogera flood plain, NW-Ethiopia and the Jordan Valley, Jordan. Hydrol. Earth Syst. Sci. 14 2219-2228. [ Links ]
DEALWIS DA, EASTON ZM, DAHLKEL HE, PHILOPT WD and STEENHUIS TS (2007) Unsupervised classification of saturated areas using a time series of remotely sensed images. Hydrol. Earth Syst. Sci. 4 1663-1696. [ Links ]
DEVCOCAST (2013) GEONETCast for and by Developing Countries Database. URL: http://www.devcocast.eu (Accessed 11 October 2012). [ Links ]
DI RIENZO JA, CASANOVES F, BALZARINI MG, GONZALEZ L, TABLADA M and ROBLEDO CW (2012) Grupo InfoStat, FCA, Universidad Nacional de Córdoba, Argentina. URL: http://www.infostat.com.ar (Accessed 1 March 2013). [ Links ]
EUMETCast (2013) EUMETCast: EUMETSAT's primary dissemination mechanism for the near real-time delivery of satellite data and products. URL: http://www.eumetsat.int/Home/Main/DataAccess/EUMETCast/SP20100519114624675?l=en (Accessed 10 October 2013).
EUMETSAT (2013) MeteoSat Second Generation satellites. URL: http://www.eumetsat.int/website/home/Satellites/CurrentSatellites/Meteosat/index.html (Accessed 10 October 2013). [ Links ]
FAO (1998) World Reference Base for Soil Resources. United Nations Food and Agricultural Organization, Rome, Italy. [ Links ]
GAO BC (1996) NDWI - A normalised difference water index for remote sensing of vegetation liquid water from space. Remote Sens. Environ. 58 257-266. [ Links ]
GHILAIN N, ARBOLEDA A and GELLENS-MEULENBERGHS F (2011) Evapotranspiration modelling at large scale using near-real time MSG SEVIRI derived data. Hydrol. Earth Syst. Sci. 15 771-786. [ Links ]
GLENN EP, HUETE A, NAGLER P, HIRSCHBOECK KK and BROWN P (2007) Integrating remote sensing and ground methods to estimate evapotranspiration. Crit. Rev. Plant Sci. 26 139-168. [ Links ]
HAYWOOD J and RANDALL J (2008) Trending seasonal data with multiple structural breaks. NZ visitor arrivals and the minimal effects of 9/11. Research Report 08/10, vol. p.p. 26. University of Wellington, Victoria, New Zealand. [ Links ]
JI L, ZHANG L and WYLIE B (2009) Analysis of dynamic thresholds for the normalised difference water index. Photogramm. Eng. Remote Sens. 75 (11) 1307-1317. [ Links ]
JOVANOVIC NZ, HON A, ISRAEL S, LE MAITRE D, RUSINGA F, SOLTAU L, TREDOUX G, FEY MV, ROZANOV A and VAN DER MERWE N (2009) Nitrate leaching from soils cleared of alien vegetation. WRC Report No. 1696/09. Water Research Commission, Pretoria. [ Links ]
JOVANOVIC N, BUGAN RDH, ISRAEL S, DZIKITI S, KAPANGA-ZIWIRI E, LE MAITRE D, ROZANOV A, STANDER M, MIKES D, MAY F, JAIRMAIN C and EVERSON C (2012) Reducing uncertainties of evapotranspiration and preferential flow in the estimation of groundwater recharge. WRC Report No. 1909/09. Water Research Commission, Pretoria. [ Links ]
JOVANOVIC NZ, BUGAN RDH and ISRAEL S (2013) Rainfall, soil water content, and groundwater levels at the Riverlands Nature Reserve (South Africa). Dataset Papers Geosci. 2013 DOI: http://dx.doi.org/10.7167/2013/724819. 14 pp. [ Links ]
LSASAF (LAND SURFACE ANALYSIS SATELLITE APPLICATIONS FACILITY) (2011) Product User Manual, Evapotranspiration (ET): LSA-16 (MET), LSA-17 (DMET). URL: http://landsaf.meteo.pt/GetDocument.do?id=458_ (Accessed 8 November 2013). [ Links ]
LSASAF (LAND SURFACE ANALYSIS SATELLITE APPLICATIONS FACILITY) (2012) Land Surface Analysis Satellite Applications Facility. URL: https://landsaf.meteo.pt/ (Accessed 27 June 2012). [ Links ]
LEMONE MA, CHEN F, ALFIERI JG, TEWARI M, GEERTS B, MIAO Q, GROSSMAN RL and COULTER RL (2007) Influence of land cover and soil moisture on the horizontal distribution of sensible and latent heat fluxes in southeast Kansas during IHOP 2002 and CASES-97. J. Hydrometeorol. 8 68-87. [ Links ]
LEWIS JE, ROWLAND J and NADEAU A (1998) Estimating maize production in Kenya using NDVI: some statistical considerations. Int. J. Remote Sens. 19 2609-2617. [ Links ]
MONTEITH JL (1977) Climate and the efficiency of crop production in Britain. Philos. Trans. R. Soc. London 281 277-297. [ Links ]
MU Q, HEINSCH FS, ZHAO M and RUNNING SW (2007) Development of a global evapotranspiration algorithm based on MODIS and global meteorology data. Remote Sens. Environ. 111 519-536. [ Links ]
NADLER P, CLEVERLY J, LAMPKIN D, GLENN E and HUETE A (2005) Predicting riparian evapotranspiration from MODIS vegetation indices and meteorological data. Remote Sens. Environ. 94 17-30. [ Links ]
REBELO AG, BOUCHER C, HELME N, MUCINA L, RUTHERFORD MC (2006) Fynbos Biome. In: Mucina L and Rutherford MC (eds.) The Vegetation of South Africa, Lesotho and Swaziland. Strelitzia 19 53-219. South African National Biodiversity Institute, Pretoria, South Africa. [ Links ]
R CORE TEAM (2013). R: A language and environment for statistical computing. R Foundation for Statistical Computing, Vienna, Austria. URL: http://www.R-project.org/ (Accessed 25 October 2013). [ Links ]
ROSENBERG NJ, BLAD BL and VERMA SB (1983) Microclimate: The Biological Environment (2nd edn.) Wiley, New York. [ Links ]
SAVAGE MJ, ODHIAMBO GO, MENGISTU MG, EVERSON CS and JARMAIN C (2010) Measurement of grassland evaporation using a surface-layer scintillometer. Water SA 361-8. [ Links ]
SERRANO L, USTIN SL, ROBERTS DA, GAMON JA and PENUELAS J (2000) Deriving water content of chaparral vegetation from AVIRIS Data. Remote sens. Environ. 74 570-581. [ Links ]
SINCLAIR S and PEGRAM GGS (2010) A comparison of ASCAT and modelled soil moisture over South Africa, using TOPKAPI in land surface mode. Hydrol. Earth Syst. Sci. 14 613-626. [ Links ]
SU Z (2002) The Surface Energy Balance System (SEBS) for estimation of turbulent heat fluxes. Hydrol. Earth Syst. Sci. 685-99. [ Links ]
VAN DEN HURK B, VITERBO P, BELJAARS A and BETTS A (2000) Offline validation of the ERA40 surface scheme. ECMWF Technical Memorandum No. 295, 42 pp. [ Links ]
VERBESSELT J, SOMERS B, LHERMITTE S, JONCKHEERE I, VAN AARDT J and COPPIN P (2006) Monitoring herbaceous fuel moisture content with SPOT VEGETATION time-series for fire risk prediction in savanna ecosystems. Remote Sens. Environ. 108 (1) 357-368.
VERBESSELT J, HYNDMAN R, NEWNHAM G and CULVENOR D (2010a) Detecting Trend and Seasonal Changes in Satellite Image Time Series. Remote Sens. Environ. 114 (1) 106-115. [ Links ]
VERBESSELT J, HYNDMAN R, ZEILEIS A and CULVENOR D (2010b) Phenological Change Detection while Accounting for Abrupt and Gradual Trends in Satellite Image Time Series. Remote Sens. Environ. 114 (12) 2970-2980. [ Links ]
VGT4AFRICA (2006) VGT4Africa User Manual: First Edition. European Commission, Directorate-General Joint Research Centre, Institute for Environment and Sustainability. URL: http://www.vgt4africa.org/PublicDocuments/VGT4AFRICA_user_manual.pdf (Accessed 10 October 2013). [ Links ]
VGT4AFRICA (2013) URL: http://www.vgt4africa.org (Accessed 10 October 2013). [ Links ]
WITBOOI J (2012) Personal communication, 30 November 2012. Mr Johny Witbooi, field ranger, Cape Nature, PO Box 538, Malmesbury 7299, South Africa. [ Links ]
YOSHIDA H (2005) Observation of riparian vegetation in Western Namibia by using NDVI and NDWI derived from SPOTVegetation. Afr. Stud. Monogr. Suppl. 30 153-163. [ Links ]
 Correspondence:
Nebo Jovanovic
+27 21 888 2506; Fax: +27 21 888 2682
e-mail: njovanovic@csir.co.za
Received 4 March 2013
Accepted in revised form 28 February 2014

