


Services on Demand
Article
 English (pdf)
 Article in xml format
 Article references
Indicators

Related links
-
 Cited by Google
 -
 Similars in Google
Share

 Permalink
Water SA
On-line version ISSN 1816-7950
Print version ISSN 0378-4738
Water SA vol.40 n.2 Pretoria Apr. 2014
Measurement and modelling of evapotranspiration in three fynbos vegetation types
S Dzikiti; NZ Jovanovic; R Bugan; S Israel; DC Le Maitre
Council for Scientific and Industrial Research, Natural Resources and Environment, 11 Jan Cilliers Street, 7599, Stellenbosch, South Africa
ABSTRACT
Many studies have investigated the water relations of indigenous plants in the fynbos shrublands of the Cape, South Africa. These have mainly focused on understanding the mechanisms by which individual plant species respond to droughts, the frequency and severity of which is expected to increase due to climate change. However, comparatively little information exists on the dynamics of water use by indigenous plants in the region, and, in particular, how water use varies seasonally and between sites. In this study we determined water use by 3 fynbos vegetation types growing at 4 different sites, namely: (i) lowland Atlantis Sand Plain fynbos growing on deep sandy soils, (ii) Kogelberg Sandstone fynbos growing in a riparian zone on deep alluvial soils, (iii) dryland Kogelberg Sandstone fynbos growing on shallow sandy soils at a montane site, and (iv) alluvial Swartland fynbos growing in clayey soils. Evapotranspiration (ET) was quantified at each site during specific periods using a boundary layer scintillometer and energy balance system. A simple dual source model in which the stand ET was calculated as the algebraic sum of outputs from soil evaporation and transpiration sub-models was used to scale up the ET measurements to annual values. The data showed large differences in ET depending on site characteristics and on plant attributes. Dense stands of riparian Sandstone Fynbos had an annual ET of 1 460 mm which exceeded the reference ET of 1 346 mm. Dryland Sandstone Fynbos used only 551 mm of water per year while the Sand Plain Fynbos' annual ET was 1 031 mm, which was similar to the reference ET of 1 059 mm. We conclude that some indigenous plant species use large volumes of water which should be accounted for in, e.g., groundwater recharge estimates, and calculations of incremental water gains after clearing alien invasive plants, among other applications.
Keywords: Evapotranspiration, fynbos, scintillometer, Western Cape
INTRODUCTION
Indigenous vegetation in the Mediterranean-type climate region of South Africa is threatened by ongoing land transformation for agriculture, forestry, industrial development and urban developments (Jacobsen et al., 2007; West et al., 2012). Climate change, the encroachment of alien invasive plants and wild fires also threaten the region's biodiversity (Midgley et al., 2002; Rebelo et al., 2006). Fynbos, a sclerophyllous shrubland dominated by species of the Proteaceae, Ericaceae and reed-like Restionaceae, forms the dominant indigenous vegetation cover in the Cape Floral Region (CFR) (Rebelo et al., 2006). Climate change induced decreases in the area under fynbos in the CFR are projected to be extensive, possibly as much as 51-65% by 2050 (Midgley et al., 2003).
Compounding the threats to the region's biodiversity is the increased rate of spread of alien invasive plants which use large quantities of water (Le Maitre et al., 1996). The projected future climatic conditions are likely to be more conducive to the growth and dispersal of the alien invasive plants (Hellmann et al., 2008). It is therefore not surprising that numerous studies in the fynbos biomes have mainly focused on the mechanisms by which plant species respond to seasonal patterns in moisture availability and how these vary along rainfall gradients (Miller et al., 1983; Richards et al., 1995; Richardson and Kruger, 1990; Von Willert et al., 1989) and during droughts (West et al., 2012). These studies have largely targeted specific plant species and few were conducted at the community or vegetation-type levels (Jacobsen et al., 2007; Midgley et al., 2002). Quantitative information on water use by indigenous vegetation at the community scale is therefore generally sparse in the CFR. Indigenous vegetation water use information is important for a variety of applications. For example, the conservation of biodiversity in riparian areas strongly depends on adequate water allocations to meet environmental flows. Accurate information on water use by the riparian vegetation is crucial to ensure 'safe' abstraction levels from the region's rivers and groundwater sources (Dye et al., 2001; 2008). In studies to quantify the hydrological impacts of alien invasive plants, information on the water use by the indigenous vegetation is critical for determining the incremental water gains that can be achieved by clearing the alien plants (Doody et al., 2011; Dzikiti et al., 2013a). Potential water savings depend on the water use characteristics of the indigenous vegetation that replace the cleared alien plants (Bosch et al., 1986; Dye et al., 2001; Dzikiti et al., 2013b; Le Maitre et al., 1996). In a recent Water Research Commission study (Jovanovic et al., 2012), uncertainties in groundwater recharge estimates were reduced significantly by including accurate data on the water use by indigenous vegetation in the hydrological models. Lastly, in the emerging water footprint concept, accurate baseline information on the water use by indigenous vegetation is critical for the determination of the water footprints of various land use practices such as agricultural and forestry activities, among others (Hastings and Pelgrum, 2012).
The aim of this study was to provide estimates of the seasonal water use by 3 endangered fynbos ecosystems, the water consumptions of which are not known. These include Sand Plain Fynbos growing on deep well-drained sandy soils at a site with a shallow water table, and riparian Sandstone Fynbos growing on deep sandy soils in one case, and on shallow sandy soils at a montane site in another. The last vegetation type comprised the alluvium Swartland Fynbos growing on clayey soils. Evapotranspiration was measured using a boundary layer scintillometer and energy balance system while ancillary data on the microclimate, leaf-area index, and profile soil water content was also collected to gain insights into the water requirements of these biomes. All of these data were used in a modified Shuttleworth and Wallace (1985) dual source model of evapotranspiration which was subsequently used to estimate the annual water use by the ecosystems.
MATERIALS AND METHODS
Data was collected from fynbos vegetation types in 3 protected Nature Reserves in the Western Cape Province namely: Riverlands, Kogelberg, and Elandsberg. Measurements could not be taken simultaneously on all three sites due to equipment limitations. Instead we conducted the experiments during selected periods between 2009 and 2013.
Study sites and vegetation characteristics
Riverlands Nature Reserve
Riverlands Nature Reserve (RNR) is located between the towns of Malmesbury and Atlantis (S 33.50°; E 18.58°; 113 m asl) in the Western Cape Province of South Africa. The reserve (~1 112 ha) is a biodiversity hotspot with more than 420 species of indigenous plants (Jovanovic et al., 2012). Riverlands is situated in the catchment of the Groen River which drains into the Diep River (Jovanovic et al., 2009). The dominant vegetation type at the reserve is the highly threatened Atlantis Sand Plain Fynbos (Rebelo et al., 2006) which is dominated by deep-rooted evergreen shrubs about 1.0-1.5 m tall, interspersed with reed-like Restionaceae and sedges with a variety of herbaceous species (e.g. geophytes) which are dormant during the dry summer months. The mean canopy cover is about 60%. More details of the vegetation are given by Jovanovic et al. (2012).
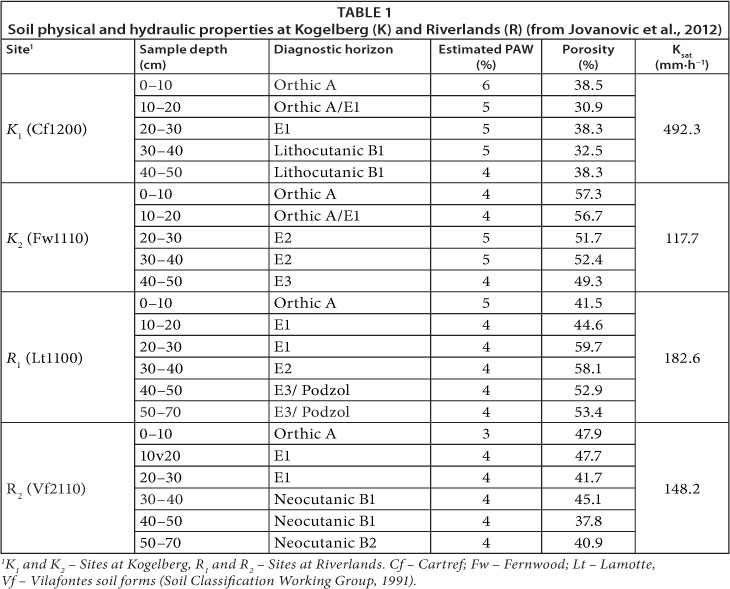
Climate at RNR is Mediterranean with mean annual rainfall of about 450 mm with most of it falling during winter, from May to August. Mean daily temperature varies from about 7.0°C in July to about 28°C in February while the annual potential evapotranspiration is about 2 150 mm. Daily evaporation exceeds rainfall for about 70% of the time (Jovanovic et al., 2009). The soils at the study site were deep, well-leached, generally acidic and coarse sandy soils of marine and aeolian origin. Jovanovic et al. (2012) classified the soils as Vilafontes 1120/10 and Lamotte 1100 (Soil Classification Working Group, 1991) or Luvic Cambisol (FAO, 1998). Additional soil physical attributes are given in Table 1.
Kogelberg Nature Reserve
The second study site was situated in the relatively pristine Kogelberg Nature Reserve (KNR) (S 34.33°; E 18.96°, 112 m asl), located about 90 km to the south-east of Cape Town. Its rugged and montane nature and poor soils has ensured minimal disturbance from agricultural activities, unlike other areas in the Cape, and this has contributed to the relatively intact state of the site. The total area of KNR is about 18 000 ha and it has about 1 654 indigenous plant species, of which about 150 are endemic (Jovanovic et al., 2012). The study site was located in the Oudebosch catchment of the KNR which lies within the lower Palmiet River basin. The Oudebosch valley is oriented southeast-northwest along an ancient fault line which defines the main valley axis (Jovanovic et al., 2012). A small stream (Oudebosch River) flows through the middle of the valley which has deep alluvial sands derived from sandstone formations while the lower lying areas along the stream comprise a wetland with a thick accumulation of organic matter forming peaty soils. Along the mountain slopes are shallower, rocky soils with coarse sands derived from hard sandstones (Jovanovic et al., 2012).
The vegetation at KNR forms part of the Kogelberg Sandstone Fynbos which occurs in mountain areas (Rebelo et al., 2006). The vegetation on the lower slopes comprises an open community (50 - 60% plant cover) with a high proportion of fine-leaved shrubs, interspersed with a tall (up to 4 m), dense community (> 90% cover) dominated by a mixture of ericoid shrubs (fine-leaved, evergreen) and proteoid shrubs (medium-sized leaves, evergreen) (Jovanovic et al., 2012). A short (<6 m tall) woodland to closed forest vegetation occurs along the streamline itself and on the stream banks. Along the north-facing slopes of the Elephant Rock mountain there was a drier form of the Protea-Tetraria community with a low canopy cover of between 10 and 30%. This dryland fynbos community was dominated by the sedges, restiods (reeds), ericoid and pro-teoid shrubs. More details on the vegetation and plant species are given in Jovanovic et al. (2012).
Elandsberg Nature Reserve
The third study site was located at Elandsberg Nature Reserve (ENR) (S 33.47°; E 19.06°, 150 m asl) situated on the west-facing foot-slopes of the Elandskloof mountain range, about 2 km north of the town of Hermon in the Western Cape Province. The reserve is about 2 000 ha in extent and has at least 820 indigenous plant species of which 5 species are endemic. The dominant vegetation types at ENR are the Swartland Alluvial Fynbos on deeper, sandy soils interspersed with patches of Swartland Shale Renosterveld on more stony, shale-derived soils. The adjacent mountain slopes comprise Hawequas Sandstone Fynbos. The vegetation on the study site itself is primarily Swartland Alluvial Fynbos which is dominated by 0.7-0.9 m tall, small-leaved proteoid shrubs, with a lower layer of fine-leaved shrubs and reed-like restioids. The total canopy cover ranges from 20-50%.
Climate at the study site is also Mediterranean with annual rainfall of about 470 mm, most of it falling during the winter months (May-August) while the temperature ranges from an absolute minimum of 2°C to an absolute maximum of 43°C. The underlying geology at the study site is Malmesbury Shale with some sandstone talus from the adjacent mountain slopes and extensive areas of gravelly soils derived from ferricrete formed on old terraces (Rebelo et al., 2006). Where the shale is exposed, renosterveld vegetation types replace the fynbos. In the shallow stream valleys, sandy, alluvial soils have accumulated which, together with the additional moisture, support a community which has a greater cover of sedges and grasses than the adjacent dryland fynbos.
Data collection
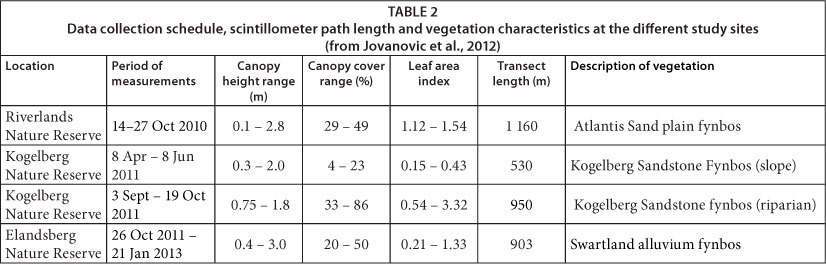
Intensive microclimate, soil water content, and actual evapo-transpiration data were collected at Riverlands Nature Reserve from 14 to 27 October 2010 (Table 2). The microclimate data were collected using an automatic weather station in which the temperature and relative humidity were measured using a temperature and humidity probe (Model CS500, Vaisala, Finland). Wind speed and direction were measured using a wind sentry (Model 03001, R.M. Young; Campbell Scientific Inc., Logan, USA) installed at 2.0 m height while the solar irradiance was measured using a pyranometer (Model SP 212, Epogee Instruments, Inc., Logan UT, USA). The rainfall was monitored using a tipping bucket rain gauge (Model TE525-L; Campbell Scientific, Inc., Logan UT, USA). The net radiation (iy absorbed by the surface was measured using a net radiometer (Model CNR 1, Kipp & Zonen, Delft, The Netherlands) mounted at a mean height of about 2.5 m above the ground while the soil heat flux (G) was measured using a cluster of 4 soil heat flux plates (REBS, Inc. Seattle, WA, USA) installed at 80 mm depth at different locations within the study area. To correct for the heat stored above the soil heat flux plates, we measured the soil temperature at 20 and 60 mm depth using soil averaging thermocouples (Model TCAV-L; Campbell Scientific Inc., Logan UT, USA), while the soil moisture content was measured using capacitance probes (Model CS616 Campbell Scientific Inc., Logan UT, USA). All of the sensors were connected to a data logger (Model CR23X; Campbell Scientific Inc. Logan UT, USA) programmed with a scan interval of 10 s and all outputs were processed every 10 min.
Latent energy flux, which is the energy equivalent of actual evapotranspiration (λET, in W-m-2) was determined using a shortened surface energy balance equation (Monteith and Unsworth, 1990) in which:

where:
H is the sensible heat flux (in W.m-2)
The sensible heat flux component was calculated from the changes in the refractive index of the air between a transmitter of monochromatic infrared radiation (at 880 nm) and a receiver along a fixed transect of about 1 160 m, using the large aperture boundary layer scintillometer (BLS 900, Scintec, AG, German). The coordinates of the scintillometer transmitter were S 33.49665°, E 18.57265° and elevation of 114 m asl, while the receiver was located at S 33.50103° S, E 18.58454° and an elevation of 111 m asl. The effective scintillometer beam height above the vegetation was calculated using detailed transect elevation and vegetation height data according to the approach described by Savage et al. (2004). The effective scintillometer beam height above the ground was 2.5 m. The beam height was therefore significantly greater than the height of the roughness elements thus ensuring that free convection scaling requirements were met.
Outside the ET measurement campaign period, hourly weather data for RNR was collected from the nearest weather station at Langgewens, approximately 15 km away. This station was operated by the Agricultural Research Council (ARC) of South Africa and the data were available for the period June 2009 to June 2010. Soil water content data were collected for the same period (2009-2010) at hourly intervals at RNR using 2 sets of ECHO Sensors (Decagon Devices, Inc., USA) installed at 50, 400 and 800 mm depths. One set was located in a densely vegetated area and the second set was installed in a relatively open area.
At Kogelberg Nature Reserve (KNR), data were collected on 2 transects with Sandstone Fynbos. Data similar to that at RNR were collected along a mountain slope dominated by a dryland Sandstone Fynbos from 8 April to 8 June 2011 (Table 2). Unlike at RNR, soil water content was measured at 50 and 300 mm depths only. Greater depths could not be sampled because of the impermeable rock material which dominated the soils at the site. The coordinates of the scintillometer transmitter at the montane site were S 34.32931°, E 18.96073°, and elevation 117 m asl. while the receiver was at S 33.32931°, E 18.945333° and elevation 82 m asl. Transect length was about 530 m and the effective scintillometer beam height was 8.7 m above the ground. An additional experiment was conducted at KNR from 3 September to 19 October 2011 to collect data along a riparian transect, following the Oudebosch stream, dominated by a dense cover of taller woody Sandstone Fynbos species. The scintillometer transmitter coordinates were S 34.32870°, E 18.96030°, elevation 109 m asl and the receiver was at S 34.32266°, E 18.96620° and elevation 73 m asl. Beam length was 950 m and the effective height of the beam above the ground was 7.75 m. Soil water content data was not collected in the riparian area. We assumed this stayed close to field capacity (0.26 cm3-cm-3) throughout the study period because there was a perennial stream to recharge the soil water so that it was not a limiting factor for transpiration. Outside the ET measurement period, hourly climate data for the KNR sites were obtained from an automatic weather station about 500 m from the site operated by KNR for the period September 2010 to September 2011.
At Elandsberg Nature Reserve (ENR) similar data to RNR and KNR were collected from 26 October 2012 until 21 January 2013. The scintillometer transmitter coordinates were S 33.47404° and E 19.0629°, elevation 157 m asl while the receiver coordinates were S 33.47029, E 019.05796, elevation 151 m asl. The transect length was about 1 000 m while the effective beam height above the ground was about 4.8 m. However, we did not have a full year's soil water content dataset at this site and therefore scaling up the water use to an annual time scale was not possible.
Evapotranspiration modelling
Because measurements of actual ET were limited to short periods (Table 2) we used a simple dual-source model (Li et al., 2010) to predict the ET outside the measurement periods. According to this model stand ET is calculated as the algebraic sum of the outputs from transpiration and soil evaporation sub-models. Similar versions of the model were applied to mixed vegetation types in natural settings by Biftu and Gan (2000), Leuning et al. (2008) and Wigmosta et al. (1994). Transpiration (Ec, in kg m-2 s-1) was determined using a Penman-Monteith equation in which:
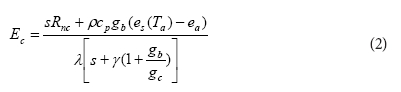
where:
Rnc is the component of the net radiation absorbed by the plant canopies
λ is the latent heat of vaporisation of water (J kg-1)
s is the slope of the saturation vapour pressure against temperature curve (Pa-°C-1)
p is the density of air (kg-m3)
cp is the specific heat of air at constant pressure (J-kg-1-°C1)
e(T)-e is the vapour pressure deficit (VPD) of the air (Pa)
y is the psychrometric constant (Pa °C-1)
gb and gc are the aerodynamic and canopy conductance (m-s-1), respectively
The total net radiation flux density (Rn) was modelled as:

where:
r is the surface reflectance
S is the solar irradiance (in W-m-2) measured by the weather stations
Ld is the downward long-wave radiation from the sky (in W-m-2)
Lu is the long-wave radiation emitted by the surface (in W-m-2).
The net long wave radiation (Ld - Lu, in W-m-2) was calculated combining the expressions by Ortega-Farias et al. (2000) and Brutsaert (1975) in which:
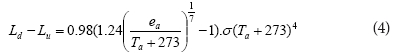
where:
ea is the actual vapour pressure of the air
Ta is the air temperature in °C
is the Stefan-Boltzmann constant (5.67 x 10⁻⁸ W·m-2·K-4)
According to Biftu and Gan (2000) and Li et al. (2010), the net radiation absorbed by the plant canopies (Rnc, in W-m-2) was then determined using Beer's law as:

and the net radiation absorbed by the soil surface (Rns, in W.m -2) was calculated as:

where:
LAI is the leaf area index which was measured at each site using an AccuPAR Ceptometer (Decagon, Inc, USA) k is the extinction coefficient which was taken as a constant with a value of 0.5 (Li et al., 2010)
The mean canopy conductance (gc in m.s-1) of the vegetation at each site was calculated as:

where:
g1 (in m.s1) is the average leaf stomatal conductance of the plant species at the study site and this variable was determined from environmental factors according to Jarvis (1976) and Oren et al. (2001) wherein:

where:
k1 is the maximum stomatal conductance of the dominant plant species determined by model optimisation
f(VPD), f(S), f(Ta), f(δM) are stress functions derived from the changes in atmospheric VPD, solar irradiance (S), air temperature, and soil water deficit δM
The values of the stress functions lie between 0 and 1 and they were expressed as:
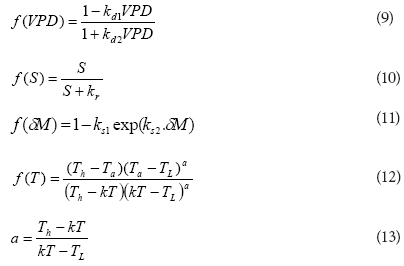
where:
kd1, kd2, kr, ks1 , ks2 and kT are parameters determined by model optimisation
TL and Th are the minimum and maximum temperatures at which the stomata of the vegetation closed and were assumed to be 0 and 45°C, respectively, for the study sites.
Soil evaporation (Es, in m.s-1) was determined using a modified version of the Priestley-Taylor equation wherein evaporation is driven primarily by the climatic factors and soil water conditions were assumed to be non-limiting (Li et al., 2010; Sauer et al., 2007). This assumption was reasonable for the Sand Plain Fynbos at Riverlands Nature Reserve where the water table was fairly shallow and at the riparian Sandstone Fynbos site at Kogelberg where a perennial stream maintained high soil moisture levels. The soil evaporation equation took the form:

where:
τ = Rns/Rn, αE is the coefficient of the Priestley-Taylor formula
τc and α had values of 0.55 and 1.3, respectively, according to Li et al. (2010).
Data from the first 5 days of measurement were used for calibrating the model at all of the sites while all of the remaining measured data were used for validating the model. The model parameters were determined using the Marquardt iterative procedure within the ModelMaker software package (Cherwell Scientific, UK) and parameter values that minimised the weighted sum of the squared differences between the measured and modelled evapotranspiration were identified.
RESULTS
Microclimate and soil water content
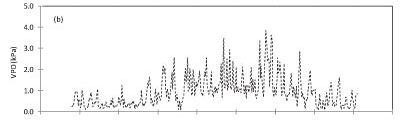
At Riverlands Nature Reserve in the period June 2009 to June 2010: daily total solar irradiance (Fig. 1a) varied from 1.9 MJ m-2-d-1 during winter in May 2010, to a peak of 34.9 MJ-m-2.d-1 in December 2009, while the daily average vapour pressure deficit ranged from less than 0.1 kPa in winter to about 3.9 kPa in late summer to early autumn (Fig. 1b). The warmest conditions, with a maximum temperature of 42.3 °C and relative humidity less than 10%, were reached in autumn (March 2010) while the minimum temperature was 3.61°C, reached in June 2010. The annual average temperature for the period June 2009 to June 2010 was 17.9 °C.


The annual reference evapotranspiration (ETo) for the period June 2009 to June 2010 was 1 059 mm compared to 516 mm of rainfall (Fig. 1c). The course of the soil water content at different depths (Fig. 1d) closely followed that of the rainfall, being high during the winter rainfall seasons and declining during the dry season. However, soil water content at 80 cm depth was saturated and stayed close to 0.50 cm3-cm-3 throughout the wet season, presumably because of the shallow water table. A significant decline in the water content at 80 cm occurred during the dry season, as shown in Fig. 1d, from about 0.50 cm3.cm-3 to about 0.10 cm3.cm-3.
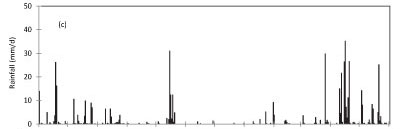
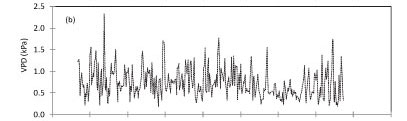
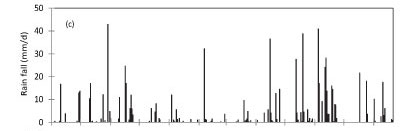
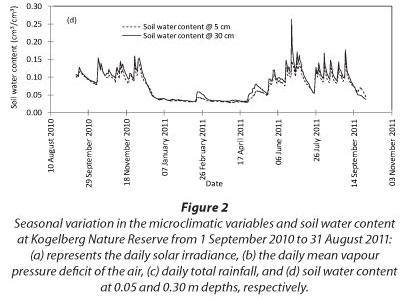
At Kogelberg Nature Reserve (KNR) during the period September 2010 to August 2011, maximum daily solar irradi-ance was 33.1 MJ-m-2.d-1 in early summer while the minimum value of 1.7 MJ-m-2.d-1 was reached during winter, in June 2011 (Fig. 2a). The maximum and minimum temperatures of 33.7 and 3.8°C occurred in March and August 2011, respectively, while the daily average VPD (Fig. 2b) peaked at 2.3 kPa. The annual reference ET was 1 346 mm while the rainfall (Fig. 2c) for the same period was 775 mm. The soil water content was measured at 50 and 300 mm depths (Fig. 2d) and there was no clear difference between the water content at these two depths, likely due to the high infiltration rates in the sandy soils. However, the seasonal effects of the rainfall were apparent.

Evapotranspiration measurements
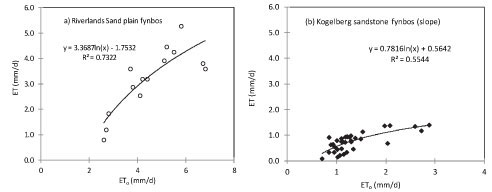
Fourteen days of ET measurements (14 to 27 October 2010) on the Sand Plain Fynbos were available at RNR (Fig. 3a). A non-linear relationship between the ET and ET0 provided the best fit at the RNR site and similar trends were also observed on the Sandstone Fynbos at Kogelberg. The measured ET at RNR ranged from 0.7 to 5.0 mm.d-1 while the ET0 ranged from 2.4 to 6.8 mm.d-1 during the same period. Up to 33 days of measured ET data during the period 8 April to 8 June 2011 were available at the dryland fynbos site on the north-facing mountain slope at KNR. Here the measured ET was less than ETo (Fig. 3b). The ET ranged from around 0.1 mm.d-1 on rainy days to about 1.1 mm.d-1 on clear sunny days although the lower ET values were within the error margins of the measurement method and so these very low values should be used with caution. Data were lost during the measurement period due to power losses (mainly at the scin-tillometer receiver which requires a lot of power) and also due to the CR23X data logger memory filling up due to the high frequency of data collection (5 min). The measured ET at the woody riparian site at Kogelberg was also related to the ETo by a logarithmic function (Fig. 3c) but here the measured ET exceeded the ETo on all the days. Water use by the riparian fynbos ranged from 1.0 mm.d-1 to about 4.5 mm.d-1 during spring, from 3 September to 19 October 2011. Contrary to the trends shown by the Sand Plain and Sandstone Fynbos, ET at the Swartland Fynbos site appeared to be linearly related to the ETo (Fig. 3d). The measured ET on Swartland Fynbos ranged from 1.2 mm.d-1 to about 5.0 mm-d-1 during the period 26 October 2012 to 21 January 2013.
Model predictions of water use
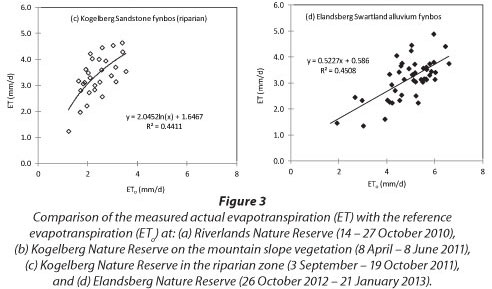
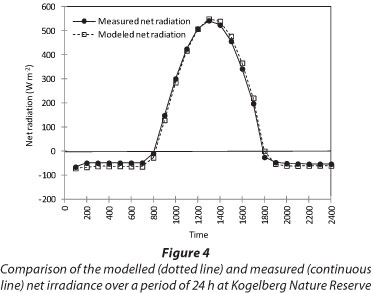
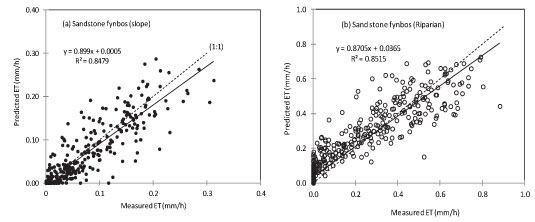
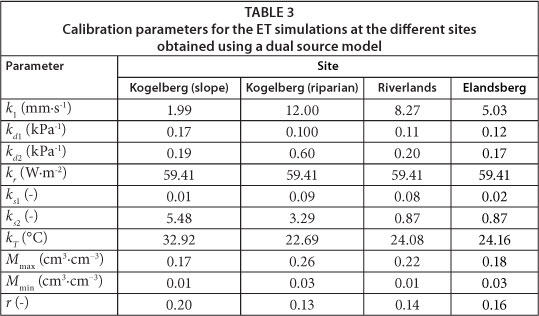
Model parameter values varied widely between sites (Table 3) with the maximum surface conductance (k1) ranging from 12 mm.s-1 at the riparian KNR site to 1.99 mm.s-1 at the dryland site, also at KNR. The surface albedo (r) was highest at the dryland Sandstone Fynbos site (0.20) and lowest at the riparian Sandstone Fynbos site (0.13), where there was a dense cover of vegetation. The model predicted the net radiation flux (the primary driving force behind ET) very well and Fig. 4 shows the results for a typical clear day at RNR. Similar results were observed for the other days for all the sites with the model values being within 10% of the measured ones. Model calibration was done using data from the first 5 days at each site while ET data for the remaining days were used for model validation. Using this criterion, ET data for 28 days at the dryland Sandstone Fynbos site at KNR (Fig. 5a), 23 days at the riparian Sandstone Fynbos site at KNR (Fig. 5b), 45 days at ENR (Fig. 5c), and 9 days at RNR (Fig. 5d) were used for validating the model. The predicted evapotranspiration was within 11% of the measured ET for the dryland fynbos at KNR (Fig. 5a), 13% of the measured ET at the riparian site at KNR (Fig. 5b), 16% of the measured ET at ENR (Fig. 5c) and 12% of the measured ET at RNR (Fig. 5d), with the coefficient of determination greater than 80% at all the sites.

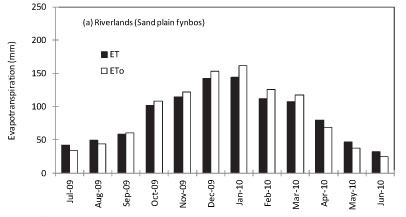
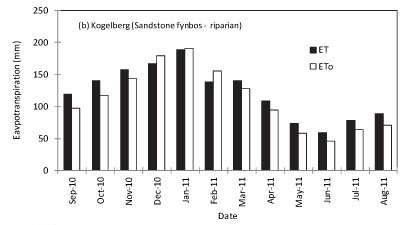
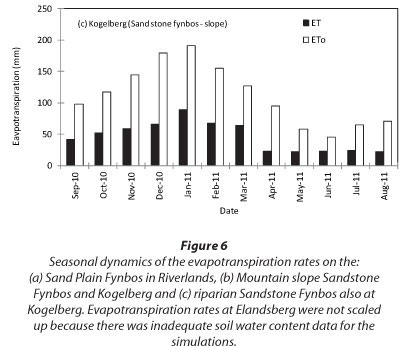
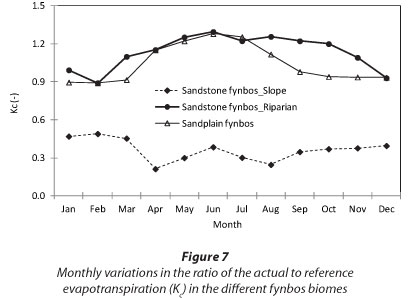
To scale up the ET data from a few days' measurements to annual values, model simulations were made for RNR, the riparian site at KNR and the mountain-slope site at KNR using the solar irradiance, air temperature, relative humidity, wind speed, soil water content and site LAI as inputs. The ET at RNR exceeded ETo during the rainy season although the trend was reversed during the dry months (Fig. 6a). At the Kogelberg riparian site (Fig. 6b), the stand ET consistently exceeded the ETo throughout the year, while the measured ET was much lower than ET0 at the dryland mountain-slope site (Fig. 6c). Annual simulations of ET at ENR could not be done because we did not have adequate data. Based on the model simulations, annual ET from the Sand Plain Fynbos at RNR was 1 031 mm compared with the ETo of 1 059 mm. Annual cumulative total ET at the riparian Sandstone Fynbos site was 1 460 mm while the ETo was 1 346 mm over the same period. Annual water-use was much lower at the dryland Sandstone Fynbos site with an ET of 552 mm compared with the annual ETo of 1 346 mm. The seasonal trends in the ratio of the monthly simulated actual evapotranspiration to the monthly reference evapotranspira-tion (Kc) are shown in Fig. 7. The Kc values of fynbos from the wet vegetation types i.e. at RNR and the riparian KNR varied between 0.9 and 1.2 while that of the dryland fynbos site ranged from 0.3 to around 0.5 (Fig. 7).
DISCUSSION
This study provides the first assessment of the dynamics of water use by 3 types of fynbos vegetation in the Western Cape Province of South Africa at daily and annual time scales. The vegetation types include; Sand Plain, Sandstone, and Swartland Fynbos. There has been one other study which directly measured ET at these time scales from a riparian fynbos wetland using the Bowen ratio measurement technique at Jonkershoek, which found that the annual ET was quite high, being 1 332 mm (Dye et al., 2001). We calibrated and validated a dual-source ET model and used it to scale up the measured water use data from selected periods to annual time scales. Numerous studies have been conducted to evaluate the performance of various ET models in indigenous forest ecosystems elsewhere in the world (Biftu and Gan, 2000; Fisher et al., 2005; Iritz et al., 1999; Wigmosta et al., 1994). The best predictions in non-homogenous ecosystems were observed using dual-source models that partition the evapotranspiration flux into the respective transpiration and evaporation components (Shuttleworth and Wallace, 1985). In recent years, these dual-source ET models have been extended to remote sensing based platforms (Leuning et al., 2008; Mu et al., 2007; Mu et al., 2011 and Nishida et al., 2003) and some of these products are being actively validated under various land use types in South Africa.
The measured ET in the Sand Plain and Sandstone Fynbos biomes was non-linearly related to the changes in the atmospheric evaporative demand depicted by the reference evapotranspiration (ETo) but not for the Swartland Fynbos vegetation. The non-linear response could be attributed to the isohydric behaviour of some fynbos species which close their stomata to limit transpiration rates when water supply does not meet demand (Richards et al., 1995; West et al., 2012). Water supply to the Sand Plain Fynbos appears to have been sustained by the shallow water table although short-term water stress (e.g. under hot and dry conditions) was possible, leading to the curvilinear response.
The two-source model predicted the stand ET reasonably well for all the biomes, with the modelled values being at most 11-14% lower than the measured values (Fig. 5). In addition, there was no universal set of model parameters that could be used at all the sites. This observation is consistent with those by Leuning et al. (2008), who used a similar type of model but with data from 15 eddy covariance flux towers in Australia and the USA. Based on the model simulations, annual water use by the Sandstone Fynbos stands (1 460 mm) situated in a riparian zone exceeded the annual reference evapotranspiration by about 8%. While the riparian Sandstone Fynbos clearly used large amounts of water, the ET values exceeding the measured ETo could also be a result of the departure of conditions at the weather station from ideal reference conditions as defined by Allen et al. (1998). In this study, the weather station was situated on uniform grass cover which was kept at a height shorter than 0.12 m by constant mowing, thus likely raising the surface resistance above the standard value of 70 s.m-1. However, similarly high values of annual water use (1 332 mm) by riparian fynbos were obtained by Dye et al. (2001). On the other hand, the annual ET by the dryland Sandstone Fynbos growing adjacent to the woody riparian Sandstone Fynbos was much lower (551 mm), at about 41% of the annual ETo. Because of their deep root systems which allow them access to multiple water sources, evergreen shrubs and trees generally use more water than seasonally dormant grasses (Dye et al., 2008; Calder and Dye, 2000). It is therefore not surprising that the dense riparian Sandstone Fynbos, which was dominated by shrub species, mainly ericoids and proteoids, with occasional forest trees such as Rapanea melanophloeos, exceeded the ETo, which is defined with reference to a short grass surface (Allen et al., 1998). The patchy nature of the dryland Sandstone Fynbos (Jovanovic et al., 2012), which had a low average LAI (Table 2) due to the shallow, rocky and coarse-sand characteristics of the soils at the montane site at Kogelberg Nature Reserve, is the major reason for the low ET values obtained in this vegetation type. Annual water use by the Sand Plain Fynbos was high, being of a similar order of magnitude as the annual ETo. Seasonal water use by the Swartland Fynbos could not be estimated due to a lack of suitable soil moisture data for the simulations. However, Jovanovic et al. (2011), using the remote sensing based Surface Energy Balance Algorithm for Land (SEBAL) model on renosterveld close to Elandsberg Nature Reserve, obtained an annual evapotranspiration of about 655 mm. However, this estimate has not been validated by suitable ground-truthed data of a sufficiently long duration.
CONCLUSIONS
This study suggests that indigenous fynbos ecosystems have a wide range of water uses depending on vegetation type and access to water. However, annual water use in dryland vegetation types may be much lower than in riparian vegetation, as was found in catchment-scale studies where only a small percentage of the catchment is riparian (Van Wyk, 1987). So while fynbos is generally well adapted to drought, it can also use a lot of water in situations where water is readily available. Accurate data on the water use by fynbos is crucial, e.g., to minimise errors in studies such as those aimed at the determination of environmental flows, groundwater recharge estimates, water footprint assessments, estimates of incremental water gains from clearing alien invasive plants, among other applications where water use by indigenous vegetation is traditionally assumed to be low. Annual water use data presented in this study are based on modelling of the evapotranspiration flux using limited measured data. This study therefore highlights the need for more accurate long-term measurements of ET in various fynbos ecosystems to better understand, the implications of climate change on the availability of water resources in fynbos catchments.
ACKNOWLEDGEMENTS
We thank Dr Caren Jarmain and Dr Colin Everson for collecting the evapotranspiration data at Riverlands Nature Reserve and Cape Nature and Elandsberg Nature Reserve for providing the study sites. We also gratefully acknowledge funding from the Council for Scientific and Industrial Research Parliamentary Grant (Elandsberg component of the study) and the Water Research Commission of South Africa (Project No. K5/1909/1/12) (Kogelberg and Riverlands components of the study).
REFERENCES
ALLEN RG, PEREIRA LS, RAES D and SMITH M (1998) Crop evaporation: Guidelines for computing crop water requirements. FAO Irrigation and Drainage Paper No. 56, Food and Agricultural Organization of the United Nations, Rome. 300 pp. [ Links ]
BIFTU GF and GAN TY (2000) Assessment of evapotranspiration models applied to a watershed of Canadian Prairies with mixed land uses. Hydrol. Proc. 14 1305-1325. [ Links ]
BOSCH JM, VAN WILGEN BW and BANDS DP (1986) A model for comparing water yield from fynbos catchments burnt at different intervals. Water SA 12 191-196. [ Links ]
BRUTSAERT WH (1975) On a derivable formula for long-wave radiation from clear skies. Water Resour. Res. 11 742-744. [ Links ]
CALDER IR and DYE PJ (2000) Hydrological impacts of invasive alien plants. In: Proc. Best Management Practices for Preventing and Controlling Invasive Alien Species, 22-24 February 2000, Kirstenbosch Botanical Gardens, Cape Town. [ Links ]
DOODY TM, NAGLER PL, GLENN EP, MOORE GW, MORINO K, HUITINE KR and BENYON RG (2011) Potential for water salvage by removal of non-native woody vegetation from dryland river systems. Hydrol. Proc. 25 4117-4131. [ Links ]
DYE PJ, JARMAIN C, LE MAITRE DC, EVERSON CS, GUSH MB and CLULOW A (2008) Modelling vegetation water use for general application in different categories of vegetation. WRC Report No. 1319/1/08. Water Research Commission, Pretoria. [ Links ]
DYE P, MOSES G, VILAKAZI P, NDLELA R and ROYAPPEN M (2001) Comparative water use of wattle thickets and indigenous plant communities at riparian sites in the Western Cape and KwaZulu-Natal. Water SA 27 529-538. [ Links ]
DZIKITI S, SCHACHTSCHNEIDER K, NAIKEN V, GUSH M, MOSES G and LE MAITRE DC (2013a) Water relations and the effects of clearing invasive Prosopis trees on groundwater in an arid environment in the Northern Cape, South Africa. J. Arid. Environ. 90 103-113. [ Links ]
DZIKITI S, SCHACHTSCHNEIDER K, NAIKEN V, GUSH M and LE MAITRE DC (2013b) Comparison of water use by alien invasive pines growing in riparian and non-riparian zones in the Western Cape, South Africa. For. Ecol. Manage. 293 92-102. [ Links ]
EVERSON CS, DYE PJ, GUSH MB, and EVERSON TM (2011) Water use of grasslands, agroforestry systems and indigenous forests. Water SA 37 781-788. [ Links ]
FAO (1998) World Reference Base for Soil Resources. United Nations Food and Agricultural Organisation, Rome. [ Links ]
FISHER JB, DEBIASE TA, QI Y, XU M and GOLDSTEIN AH (2005) Evapotranspiration models compared on a Sierra Nevada forest ecosystem. Environ. Model. Soft. 20 783-796. [ Links ]
HASTINGS E and PEGRAM G (2012) Literature review for the applicability of water footprints in South Africa. WRC Report No. 2099/P/11. Water Research Commission, Pretoria. [ Links ]
HELLMANN JJ, BYERS JE, BIERWAGEN BG and DUKES JS (2008) Five potential consequences of climate change for invasive species. Cons. Biol. 22 534-543. [ Links ]
HOPE A, BURVALL A, GERMISHUYSE T and NEWBY T (2008) River flow response to changes in vegetation cover in a South African fynbos catchment. Water SA 35 55-59. [ Links ]
IRITZ Z, LINDROTH A, HEIKINHEIMO M, GRELLE A and KELLNER E (1999) Test of a modified Shuttleworth-Wallace estimate of boreal forest evaporation. Agric. For. Meteorol. 98 605-619. [ Links ]
JACOBSEN AL, ESLER KJ, PRATT BR and EWERS FW (2009) Water stress tolerance of shrubs in Mediterranean type climate regions: convergence of fynbos and succulent karoo communities with California shrub communities. Amer. J. Bot. 96 1445-1453. [ Links ]
JARVIS PG (1976) The interpretation of the variations in leaf water potential and stomatal conductance found in canopies in the field. Phil. R. Trans. Soc. Lond. B 273 593-610. [ Links ]
JOVANOVIC NZ, ISRAEL S, TREDOUX G, SOLTAU L, LE MAITRE D, RUSINGA F, ROZANOV A and VAN DER MERWE N (2009) Nitrogen dynamics in land cleared of alien vegetation (Acacia saligna) and impacts on groundwater at Riverlands Nature Reserve (Western Cape, South Africa). Water SA 35 37-44. [ Links ]
JOVANOVIC NZ, JARMAIN C, DE CLERCQ WP, VERMEULEN T and FEY MV (2011) Total evaporation estimates from a Renosterveld and dryland wheat/fallow surface at the Voëlvlei Nature Reserve (South Africa). Water SA 37 471-482. [ Links ]
JOVANOVIC NZ, BUGAN RDH, ISRAEL S, DZIKITI S, KAPANGA-ZIWIRI E, LE MAITRE D, ROZANOV A, STANDER M, MIKES D, MAY F, JARMAIN C and EVERSON C (2012) Reducing uncertainties of evapotranspiration and preferential flow in the estimation of groundwater recharge. WRC Report No. 1909/1/12. Water Research Commission, Pretoria. [ Links ]
LE MAITRE DC, VAN WILGEN BW, CHAPMAN RA and McKELLY DH (1996) Invasive plants in the Western Cape, South Africa: modelling the consequences of a lack of management. J. Appl. Ecol. 33 161-172. [ Links ]
LEUNING R, ZHANG YQ, RAJAUD A, CLEUGH H and TU K (2008) A simple surface conductance model to estimate regional evaporation using MODIS leaf area index and the Penman-Monteith equation. Water Resour. Res. 44 1-17. [ Links ]
LI X, YANG P, REN S, LI Y, LIU H, DU J, LI P, WANG C and REN L (2010) Modelling cherry orchard evapotranspiration based on an improved dual-source model. Agric. Water Manage. 98 12-18. [ Links ]
MIDGLEY GF, HANNAH L, MILLAR D, RUTHERFORD MC and POWRIE LW (2002) Assessing the vulnerability of species richness to anthropogenic climate change in a biodiversity hotspot. Global Ecol. Biogeogr. 11 445-451. [ Links ]
MIDGELY GF, HANNAH L, MILLAR D, THUILLER W and BOOTH A (2003) Developing regional and species level assessments of climate change impacts on biodiversity in the Cape Floristic Region. Biol. Conserv. 112 97-97. [ Links ]
MILLER PC, MILLER JM and MILLER PM (1983) Seasonal progression of plant water relations in fynbos in the Western Cape Province, South Africa. Oecologia 56 392-396. [ Links ]
MONTEITH JL and UNSWORTH M (1990) Principles of Environmental Physics (2nd edn.) Butterworth Heinemann, Oxford. [ Links ]
MU Q, ZHAO M and RUNNING SW (2011) Improvements to a MODIS global terrestrial evapotranspiration algorithm. Remote Sens. Environ. 115 1781-1800. [ Links ]
MU Q, HEINSCH FA, ZHAO M and RUNNING SW (2007) Development of a global evapotranspiration algorithm based on MODIS and global meteorological data. Remote Sens. Environ. 111 519-536. [ Links ]
MUCINA L and RUTHERFORD MC (2006) The Vegetation of South Africa, Lesotho and Swaziland. Strelitzia 19. South African National Biodiversity Institute, Pretoria. [ Links ]
NISHIDA K, NEMANI R, GLASSY JM and RUNNING SW (2003) Development of an evapotranspiration index from Aqua/MODIS for monitoring surface moisture status. IEEE Transactions on Geosci. Remote Sens. 41 493-501 . [ Links ]
OREN R, SPERRY JS, EWERS BE, PATAKI DE, PHILIPS N and MEGONIGAL JP (2001) Sensitivity of mean canopy stomatal conductance to vapour pressure deficit in a flooded Taxodium distichum L. Forest: hydraulic and non-hydraulic effects. Oecologia 126 21-29. [ Links ]
ORTEGA-FARIAS S, ANTONIOLETTI R and OLIOSO A (2000) Net radiation model evaluation at an hourly time step for Mediterranean conditions. Agronomie 20 157-164. [ Links ]
PRINSLOO FW and SCOTT DF (1999) Stream flow responses to the clearing of alien invasive trees from riparian zones at three sites in the Western Cape Province. S. Afr. For. J. 185 1-7. [ Links ]
REBELO AG, BOUCHER C, HELME N, MUCINA L and RUTHERFORD MC (2006) Fynbos biome. In: Mucina L and Rutherford MC (eds.) The Vegetation of South Africa, Lesotho and Swaziland. Strelitzia 19. South African National Biodiversity Institute, Pretoria. 53-219. [ Links ]
RICHARDS MB, STOCK WD and COWLING RM (1995) Water relations of seedlings and adults of two fynbos Protea species in relation to their distribution patterns. Funct. Ecol. 9 575-583. [ Links ]
RICHARDSON and KRUGER (1990) Water relations and photo-synthetic characteristics of selected trees and shrubs of riparian and hillslope habitats in the south-western Cape Province, South Africa. S. Afr. J. Bot. 56 214-226. [ Links ]
SAUER TJ, SINGER JW and PRUEGER JH (2007) Radiation balance and evaporation partitioning in narrow row soybean canopy. Agric. For. Meteorol. 145 206-214. [ Links ]
SAVAGE MJ, EVERSON CS, ODHIAMBO GO, MENGISTU MG and JARMAIN C (2004) Theory and practice of evapotranspiration measurement, with special focus on surface layer scintillometer (SLS) as an operational tool for the estimation of spatially-averaged evaporation. WRC Report No. 1335/1/04, Water Research Commission, Pretoria. [ Links ]
SHUTTLEWORTH WJ and WALLACE JS (1985) Evaporation from sparse crops-an energy combination theory. Q. J. R. Meteorol. Soc. 111 839-855. [ Links ]
SOIL CLASSIFICATION WORKING GROUP (1991) Soil Classification - a Taxonomic System for South Africa. Memoirs on The Agricultural Natural Resources of South Africa no. 15. Department of Agricultural Development, Pretoria, South Africa. [ Links ]
VAN WYK DB (1987) Some effects of afforestation on streamflow in the western Cape Province, South Africa. Water SA 13 31-36. [ Links ]
VON WILLERT DJ, HEPPICH M and MILLER JM (1989) Photo-synthetic characteristics and leaf water relations of mountain fynbos vegetation in the Cedarberg area (South Africa). S. Afr. J. Bot. 55 288-298. [ Links ]
WEST AG, DAWSON TE, FEBRUARY EC, MIDGLEY GF, BOND WJ and ASTON TL (2012) Diverse functional responses to drought in a Mediterranean-type shrubland in South Africa. New Phytol. DOI: 10.1111/j.1469-8137.2012.04170x. [ Links ]
WIGNOSTA MS, VAIL LW, LETTENMAIER DP (1994) A distributed hydrology - vegetation model for complex terrain. Water Resour. Res. 30 1665-1679. [ Links ]
 Correspondence:
S Dzikiti
+27 21 888-2593; Fax: +27 21 888-2682
e-mail: sdzikiti@csir.co.za / sdzikiti@gmail.com
Received 17 April 2013
Accepted in revised form 28 February 2014

