


Services on Demand
Article
 English (pdf)
 Article in xml format
 Article references
Indicators

Related links
-
 Cited by Google
 -
 Similars in Google
Share

 Permalink
Water SA
On-line version ISSN 1816-7950
Print version ISSN 0378-4738
Water SA vol.40 n.1 Pretoria Jan. 2014
ARTICLES
Satellite-based annual evaporation estimates of invasive alien plant species and native vegetation in South Africa
WML MeijningerI; C JarmainII
IeLEAF (formerly WaterWatch), Generaal Foulkesweg 28,6703 BS Wageningen, The Netherlands
IICSIR Division of Natural Resources and the Environment, PO Box 320, Stellenbosch, South Africa
ABSTRACT
In this study we assessed the impact that invasive alien plant species (IAPs), and the clearing thereof by the Working for Water (WFW) programme, have on total evaporation (ET) and the availability of water resources in two highly-invaded provinces of South Africa. The Surface Energy Balance Algorithm for Land (SEBAL) model, using MODIS satellite imagery, was used to estimate the annual total ET at 250 m pixel resolution. ET was estimated for 3 climatically different years for the Western Cape and KwaZulu-Natal. The average annual ET from areas under IAPs, native vegetation, exotic plantation forestry species and control (clearing) areas were compared. The ET of the 5 dominant IAPs (Acacia mearnsii, Acacia saligna, Eucalyptus spp., Hakea spp. and Pinus spp.) in the Western Cape province was 895 mm, which was significantly higher than the ET of most of the native vegetation (thicket 575 mm and fynbos 520 mm), but similar to the ET of dominant exotic plantation forestry species (805 mm). On average, the ET was reduced by 13% to 780 mm, following clearing. In KwaZulu-Natal Province, the ET of the 5 dominant IAPs (Acacia mearnsii, Chromoleana odorata, Eucalyptus spp., Lantana camara and Solanum mauritanium) was 875 mm, which was also higher than the ET of the native vegetation (thicket 755 mm, savanna 685 mm and grassland 640 mm). Following IAP control the ET was decreased by 6%, to 825 mm.
This study has demonstrated that spatial ET data with GIS-information on land use can be used to assess the impact of IAPs, and clearing thereof, on water resources. We confirmed results from previous studies, which showed that ET from invaded areas exceeded that from native vegetation. The ET data needs further validation as validation appeared to be impossible. Our results are likely conservative since the majority of invaded areas considered in this analysis represent non-riparian areas. The impact of WFW control of densely-invaded riparian areas is likely more pronounced. We concluded that the clearing of IAPs by the WFW programme has a positive effect on the availability of water resources through a reduction in ET.
Keywords: invasive alien plants; indigenous vegetation; remote sensing; water use; evapotranspiration; SEBAL; Western Cape; KwaZulu-Natal
INTRODUCTION
Internationally, invasive alien plant species (IAPs) are recognised as the 'most important direct drivers of change in ecosystems' (Millennium Ecosystem Assessment 2005 p. 14 in Cavaleri and Sack, 2010). Although researchers believe that IAPs often have a negative impact on water resources through their high water use (ET) compared to native vegetation (Calder and Dye, 2001), little is actually known about the impact of IAPs on ecological processes (Calder and Dye, 2001; Cavaleri and Sack, 2010).
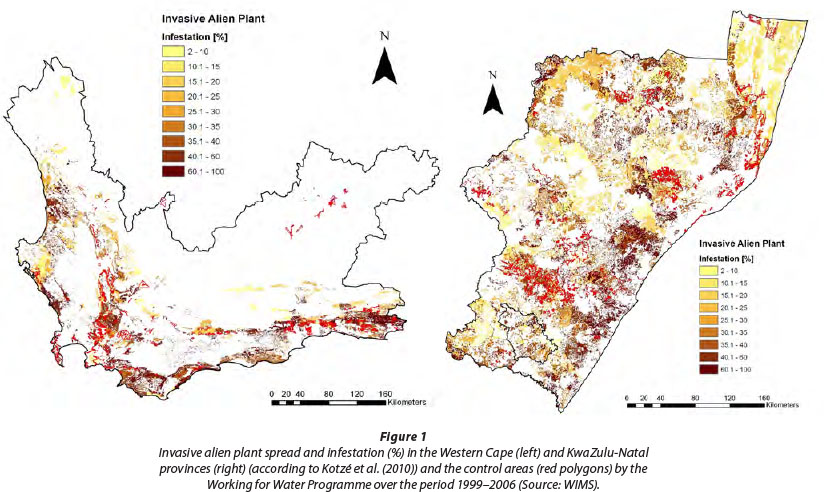
In South Africa (SA), IAPs not only impact on the water resources, but also on land productivity and biodiversity. IAPs occur across the SA landscape and it is estimated that about 10 million ha (8.28%) of SA has been invaded to some extent, at an average species density of 17% (Le Maitre et al., 2000). IAP spread and density across the Western Cape and KwaZulu-Natal provinces of SA is shown in Fig. 1 (Kotzé et al., 2010). Dense invasions are generally confined to small areas often associated with riparian zones. IAPs are controlled through legislation, with a total of 198 IAPs being declared as weeds and an additional 36 species potentially invasive (Henderson, 2001). The top ten invaders of SA are listed in Table 1 (Le Maitre et al., 2000).

Concerns about the impact of exotic plantation species on streamflow arose as early as 1932 (Dye and Bosch, 1999), which led to the establishment over time (1935-1980) of paired catchment experiments across SA, where the impact of land use changes (replacing grasslands or shrublands with exotic tree species) on streamflow were studied. It was only in the mid 1990s that the potential impact of IAPs on SA's available water resources was recognised by the government (Le Maitre et al., 1996). At the time, predictions of the impact of IAPs on water resources were based on the results from the paired catchment studies (Bosch et al., 1986), considering information on IAP spread (Versfeld et al., 1998; Görgens and Van Wilgen, 2004). Bosch et al. (1986) stated that a post-fire reduction in biomass (of fynbos, a native vegetation type) would lead to increased streamflow (Dye and Bosch, 1999). It was therefore predicted that woody IAPs would likely use significant amounts of water and reduce streamflow. These concerns and predictions led to the launch of the acclaimed Working for Water (WFW) programme in SA in 1995. The aim of this programme is to control (mainly by removing) IAPs, and in so doing protect the biodiversity and water resources of SA, whilst providing social-economic benefits to communities through job creation.
Following the launch of the WFW programme, studies continued to investigate the impact of IAPs on streamflow and total evaporation at various scales. Streamflow-biomass-based models (Le Maitre et al., 1996; 2000) were developed to predict the impact of IAPs on streamflow, both on a regional and national scale. The impact is expressed as the additional water used by exotic plantation trees compared with the native vegetation it has replaced. At field scale, studies showed that clearing woody IAPs (e.g. Acacia, Eucalyptus and Pinus spp.) increased streamflow (Prinsloo and Scott, 1999; Dye and Poulter, 1995). Other studies showed that, e.g., a riparian thicket of Acacia mearnsii used significantly more water than native fynbos and grassland it often replaces (Dye et al., 2001; Dye and Jarmain, 2004). A few other short-term studies also measured the ET of Chromoleana spp. (scrambler) (Jarmain et al., 2008), Hakea spp. (Dye et al., 2008) and Pinus spp. (Dye et al., 2008).
All of these past studies have contributed to our understanding of the impact of IAPs on streamflow and ET in SA, but have shortcomings (Görgens and Van Wilgen, 2004) as follows:
• The original predictions of the impact of IAPs on streamflow reduction are based on afforestation experiments conducted in high rainfall regions (annual rainfall > 1 100 mm), which raises the question as to whether these data can be extrapolated to drier regions
• In the past, no known methods existed to upscale-site specific field measurements of ET in space and time.
• Knowledge of the impact of IAPs on water resources is limited to a few IAP species found in SA, mainly woody IAPs grown in commercial forestry plantations. The impact of shrub-like species remains poorly understood. Similarly, knowledge on the ET of native plants is also limited to few species and therefore direct comparison of ET (IAPs vs. native vegetation) is not always possible.
• Finally, the impact of IAPs on groundwater resources is also poorly understood. Current knowledge on IAPs and native vegetation ET is too limited to provide an adequate foundation for the countrywide estimation of ET in invaded regions.
Recent developments in the use of surface energy balance models that use satellite remote-sensing data (visible, near-infrared and thermal infrared imagery) now make it possible to quantify actual ET of various land uses (e.g. various IAPs, native vegetation, exotic plantation forestry species and areas where IAPs have been removed) simultaneously over space and time, thus addressing the information gaps. In this study, remote-sensing data and the Surface Energy Balance Algorithm for Land (SEBAL) model were used to assess actual ET across the Western Cape and KwaZulu-Natal provinces, both densely invaded (Fig. 1) (Le Maitre et al., 2000). The annual ET prior to and following IAP clearing was estimated, and contrasted against the ET of other land uses (forestry, biomes and biotopes). In contrast to previous studies (Le Maitre et al., 2000; Cullis et al., 2007) where the invasion data from Versfeld et al. (1998) were used, this study used data from the Working for Water Information Management System (WIMS). WIMS is a geographical information system (GIS) database from the WFW programme that contains information on IAP species and densities of the invaded areas that have been controlled (i.e. cleared) by WFW (Fig. 1) (Marais and Wannenburgh, 2009). To account for climatic variability, we compared the ET calculated using SEBAL from 3 climatically different years (wet, dry and average rainfall).The results are described in this paper.
Definitions
SEBAL provides estimates of actual total evaporation (ET) for each pixel within a satellite image. Total evaporation refers to the sum of water lost from a surface, whether through transpiration by vegetation (T), soil evaporation or evaporation of intercepted water (E).
ET estimates for IAPs refer to the water use of an area (i.e. a satellite pixel) invaded by a specific IAP species with a density exceeding 35% (see section on WIMS IAPs data). The ET of native vegetation was estimated for biomes and biotopes as classified by Low and Rebelo (1996). Cultivated areas (agriculture and forestry) were identified using the National Land Cover (NLC) classification of 2000 (Van den Berg et al., 2008). We will only discuss the ET estimates for exotic plantations from the NLC classification. Finally, the ET estimates of control (treated) areas refer to the water use of areas where the dominant IAPs have been cleared by WFW (according to WIMS). The ET estimates of these treated areas represent the water use of native vegetation, and eventually re-growing (and/or secondary) invaders, or a combination thereof.
METHODS
Satellite data
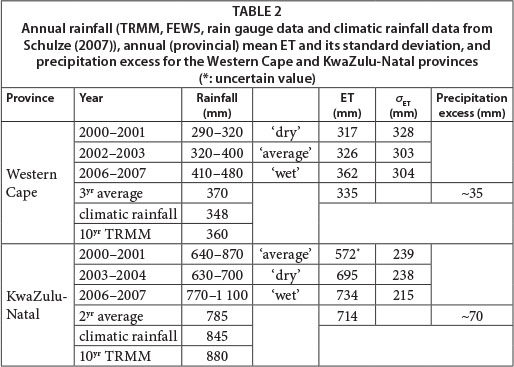
The size of the Western Cape and KwaZulu-Natal provinces compelled us to use Moderate Resolution Imaging Spectroradiometer (MODIS, http://modis.gsfc.nasa.gov/index. php) imagery in the SEBAL ET modelling. Total evaporation was estimated for 3 climatically different years (in this study a year extends from 1 July to 30 June), representing average, above-average and below-average rainfall conditions. The Tropical Rainfall Measurement Mission (TRMM) rainfall data (daily precipitation product 3B42, http://trmm.gsfc.nasa.gov) were used in the selection of the three years. For the Western Cape the following years were selected: 2000-2001 (dry), 20022003 (average) and 2006-2007 (wet). And for KwaZulu-Natal: 2000-2001 (average), 2003-2004 (dry) and 2006-2007 (wet).
A total of 70 MODIS images (Level 1B calibrated radiances - MODIS products) per province were used to estimate annual ET for each year. Generally, MODIS images are captured twice a day (by the Terra and Aqua sensors). To limit processing time and costs, one predominantly cloudfree image per 2-week period was selected and used. This approach might lead to biased ET results (in particular non-riparian areas) as ET changes from precipitation events are missed between consecutive images. However, this error should tend to decrease as more images are used per year. The following criteria were used for selecting good images: low to no cloud cover and low satellite viewing angles. Cloudy areas (as well as fog and fires) were masked out and filled at a later stage (gap filling was done at the stage at which the ET was derived, by interpolating ET using previous and following ET maps). Data from Aqua (mid-day satellite overpass) were preferred over Terra (early morning overpass) as the midday-based evaporative fraction (EF) is closer to the daily EF (Peng et al., 2013) (see next section). The spatial resolution of the 36 spectral bands of MODIS varies. Band 1 (red) and 2 (near-infrared) have a resolution of 250 m, while the other required MODIS bands have lower resolutions (500 m to 1 km). In order to estimate the ET at a 250 m resolution, all necessary spectral bands were downscaled to 250 m (i.e. the 500 m shortwave bands 3 to 7 were re-sampled to 250 m using cubic convolution). The 1 km thermal bands (band 31 and 32) were re-sampled to 250 m surface temperature maps using a broadband surface thermal emissivity relationship based on the 250 m NDVI (Normalised Difference Vegetation Index) (Van der Griend and Owe, 1992).
Surface Energy Balance Algorithm for Land (SEBAL) model
SEBAL is a surface energy balance model (based on physical and empirical parameterisation) that provides spatial estimates of actual ET at pixel scale (in this study at 250 m). Since the model has been discussed in detail by Bastiaanssen et al. (1998a, b; 2005) and Wang et al. (2009), only the basic steps are discussed here.
SEBAL combines the broadband surface albedo, NDVI and surface temperature with spatially gridded weather data (air temperature (T), relative humidity (RH), wind speed (u) and solar radiation (K)), a digital elevation map (DEM) and a land cover map to determine ET for each 250 m pixel. The weather data were provided by the South African Weather Service and the Agricultural Research Council. The spatial gridding of the weather data was done using Meteolook (a physically-based distribution model for T, RH and u (Voogt, 2006)). Solar radiation (K↓) was estimated using the DEM, the solar radiation model of Tasumi et al. (2006) in combination with atmospheric transmissivity (τ) data taken from either ground stations or the remote-sensing products of the Land Surface Analysis Satellite Applications Facility (http://landsaf.meteo.pt, available since 2005). The surface roughness (z0) and zero-displacement height (d) were derived from the land cover map and NDVI (which is related to the leaf area index, LAI) data to incorporate seasonal changes in zo and d (Raupach, 1994; Verhoef, et al., 1997) (as the LAI increases the canopy closes and the surface becomes aerodynamically smoother).
Each satellite image, which contains instantaneous information of the earth's surface, is processed in 3 steps. First, the instantaneous (i) energy balance (EBi) is solved at the time of the satellite overpass. Once the net radiation (Rni) and soil heat flux (Gi) are estimated, the sensible heat flux (Hi) is derived using special 'anchor' pixels within the thermal image. These carefully selected 'anchor' pixels consist of a 'wet' pixel (mostly a water pixel) and a 'dry' pixel representing areas where the ET is considered maximum and zero respectively. Once Hi is estimated, the latent heat flux (λEi, evaporation expressed as energy flux) is derived as the closure term of the EB, and the evaporative fraction (EFi), in turn. Secondly, the daily (24) energy balance is solved. Assuming the evaporative fraction remains reasonably stable during the day, the daily evaporative fraction (EF24) is derived from EFi.. Here, EF24 is allowed to change slightly due to advection processes, using an empirical advection model (which describes advection as the ratio of the instantaneous (EFi,ref-grass ) and daily evaporative fraction (EF24,ref-grass) for a standard grass reference crop, derived from standard hourly weather data; in case no advection occurs the ratio equals 1, i.e. EFi = EF24). Advection is defined here as the horizontal exchange of energy due to horizontal heterogeneity at the earth's surface which can alter the ET. Once the daily net radiation (Rn24) and soil heat flux (G24 ) are known, together with daily mean weather data, the daily ET can be derived (ET24) (Bastiaanssen, 2000). By applying the Penman-Monteith equation (Allen et al., 1998) 'in reverse', it is then possible to derive the daily average surface resistance or crop resistance (rs24). The latter term is used in the third step to estimate the ETper for a period of roughly 2 weeks using the Penman-Monteith equation and the corresponding period mean net radiation, soil heat flux and weather data. During this 2-week period it is assumed that rs24 remains fairly constant, i.e. rs24 is not adjusted after a rain event, except for advection processes similar to the advection correction in the second (daily) step. The ratio of the daily (EF24,ref-grass) and the period evaporative fraction (EFperiod,ref-grass), both derived from standard weather data, is used as a measure of advection. In each of the steps, spatially gridded meteorological data are used (e.g. T, RH, u and K↓ data). Finally, the biomass growth is estimated where the light use efficiency (assuming c3 - vegetation) is coupled to the stomata aperture, i.e. the surface resistance (rs24) (Zwart and Bastiaanssen, 2007).
WIMS IAPS DATA
Classification of invaded and treated areas
The clearing information (i.e. treatments) of the WFW programme is extracted from the WFW management database, WIMS. WIMS is a GIS database and contains information on each treatment, including the type of IAP species, IAP densities, costs of treatment, person days planned and worked on a specific area (polygon), and contract end dates (Marais and Wannenburgh, 2008), for the period 1999 to the end of 2006 (see Fig. 1, the red polygons). In general a contract lasts ~6 weeks (Wannenburgh, 2009). Using the contract end date, each polygon (and later on the SEBAL-ET pixels) was either classified as an invaded area or as treated area with respect to a SEBAL year. For example, a polygon (in KwaZulu-Natal) that was treated in August 2005 is classified as an invaded area for the SEBAL year 2003-2004 and as a control (treated) area for the SEBAL year 2006-2007. However, since the WIMS database (used in this study) extended until 2006, the SEBAL-ET data for 2006-2007 could not be used to investigate the ET of invaded areas, but only for the assessment of ET for the treated areas.
Selecting IAPs pixels for Inclusion In data analysis
The size of the Western Cape and KwaZulu-Natal provinces compelled us to use MODIS imagery (which has a large swath width), as a MODIS-satellite image covers an entire province and therefore all the invaded areas (Fig. 1) that have been treated by WFW. However, the spatial resolution is limited to 250 m, i.e., an area of 6.25 ha. Compared to the size of most polygons in the WIMS GIS-database, 6.25 ha is relatively coarse. Therefore, when superimposed, only certain MODIS pixels are fully contained in the WIMS polygons. Valid SEBAL-ET pixels were selected using the following criteria: (i) more than 70% of a 250 m MODIS-pixel must be in a polygon that represents a WFW treated area; (ii) the recorded species density must be more than 35% (according to WIMS). The ideal situation would be to use polygons (and pixels) with a species density of 100%. Unfortunately, most polygons with a 100% species density are small (mostly riparian areas along narrow streams) and do not cover a 250 m pixel sufficiently and were excluded from further analysis. Therefore, as a compromise between a sufficient amount of sampled pixels and a sufficient species density, a minimum invasion density of 35% was chosen. As a result the number of pixels that could be assessed in this study was: 2 400 sampled pixels for the Western Cape and 400 sampled pixels for KwaZulu-Natal. Most of these pixels represent non-riparian areas, and have a mean invasion density of 57%. This implies that the SEBAL-ET results for IAPs likely also contain information (43%) from other (native) vegetation. The amount of IAP pixels that could be sampled for KwaZulu-Natal was very limited and this fact should be taken into account when interpreting the results.
RESULTS
Annual ET at provincial scale
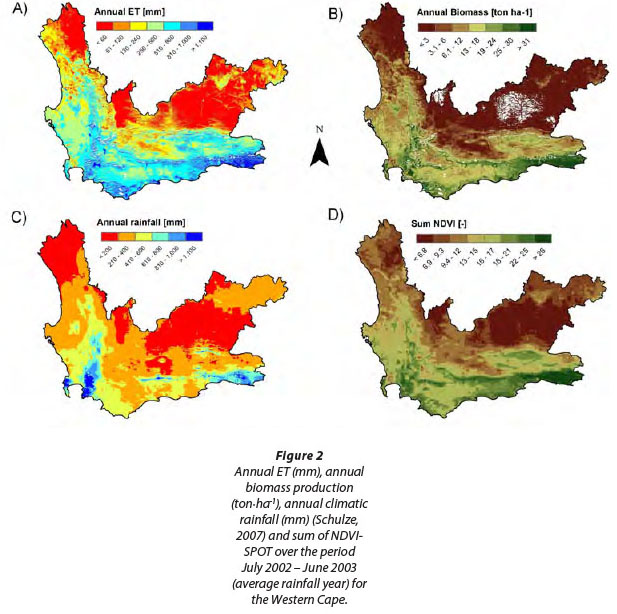
Annual ET, rainfall (Schulze, 2007), biomass production and NDVI vary spatially across the Western Cape and KwaZulu-Natal provinces (Figs. 2 and 3). The total NDVI (NDVI-sum) is derived from the NDVI-SPOT archive data (http://free. vgt.vito.be). The annual NDVI-sum shows high (low) annual cumulative NDVI values for areas that have abundant (little) active vegetation during the year, which are likely the result of high (low) rainfall amounts and/or unlimited water resources (Figs. 2 and 3). Missing data (white areas in the ET and biomass panels) are the result of frequent cloud cover in the images. The TRMM rainfall data, due to its limited spatial resolution (25 km), in combination with the mountainous terrain of the Western Cape and KwaZulu-Natal province, could not be used to assess the SEBAL-ET results. Instead, long-term average rainfall data from the South African Atlas of Agro-Hydrology and Climatology (Schulze, 2007) were used.
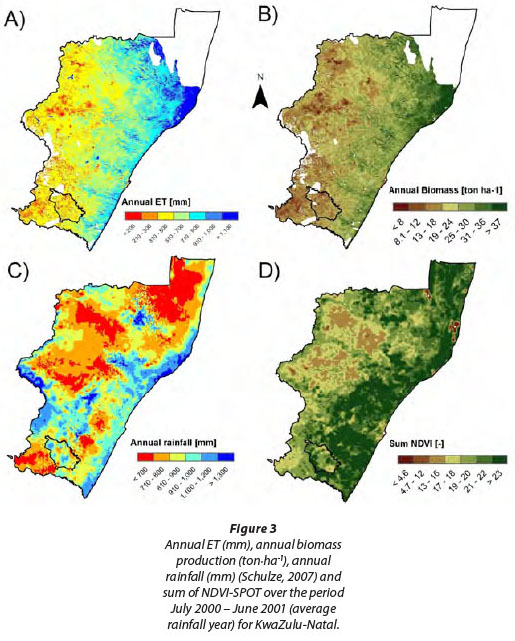
The provincial average ET for the Western Cape was estimated to be 325 mm for the average rainfall year (2002-2003). This is significantly lower than the average ET estimate of 570 mm (2000-2001) for KwaZulu-Natal. Note that the 2000-2001 results for KwaZulu-Natal are susceptible to errors (underestimation of ET) due to limited solar radiation data. The higher ET estimates for KwaZulu-Natal for all three years are consistent with the higher rainfall estimates for this province, with more than twice the rainfall of the Western Cape (Table 2). This is also reflected in the higher biomass production and NDVI values. The annual biomass production in KwaZulu-Natal varied between 22 and 25 ton-ha-1 and in the Western Cape was, on average, 9 ton-ha-1.
The spatial variation in SEBAL-ET and biomass reflected the spatial variation in rainfall (Schulze, 2007) and NDVI (SPOT) reasonably well for the Western Cape. Areas that received high rainfall amounts also showed high ET, biomass production and NDVI values. In low rainfall areas, lower ET, biomass and NDVI were estimated. In general the spatial variation in ET in the Western Cape (σET ranges from 303 to 328 mm for the three years, where σET represents the standard deviation in space of the annual ET for the entire province) is much higher than in KwaZulu-Natal (σET ranges from 215 to 239 mm). In KwaZulu-Natal (for 2000- 2001), the western part of the province received the lowest amount of rainfall and this is visible in the NDVI-SPOT observations, ET and biomass production estimates.
In the Western Cape, the lowest ET values were found in the central Karoo. The annual average ET for Karoo vegetation (succulent Karoo and Nama Karoo combined) was 115 mm, with the lowest ET estimates (50 mm) for the Upper, Great and Central Nama Karoo vegetation. These ET estimates are much lower than the long-term average rainfall estimates (according to the Climate Atlas (Schulze, 2007)) for these biomes, which were in the order of 190 mm (both Karoo classes combined). Although it was expected that (Nama) Karoo would reveal some of the lowest ET values in the Western Cape, the ET estimates seem very low (50 mm). Unfortunately, no field observations of ET are available for this area to confirm these low ET-values. Since the Karoo region of the Western Cape is not heavily invaded by IAPs (Fig. 1), it was decided to discard this region from further discussions.
On a provincial scale the annual rainfall exceeded the annual ET (Table 2). For the Western Cape the average precipitation excess (i.e. rainfall minus ET) was estimated to be 35 mm.yr-1 and for KwaZulu-Natal, 70 mm.yr-1. The annual rainfall for the Western Cape and KwaZulu-Natal provinces presented in Table 2 are taken from 3 data sources: (i) TRMM (3B42, 25 km resolution), (ii) Famine Early Warning Systems (FEWS) (8 km resolution), and (iii) spatially interpolated rain gauge data. The range of these data sources compares reasonably well with the long-term average annual rainfall estimates from the South African Atlas of Agro-hydrology and Climatology (Schulze, 2007) for both provinces. The 10-year (1998-2007) average rainfall estimates based on TRMM are also presented in Table 2.
Annual ET of invasive alien plants in the Western Cape
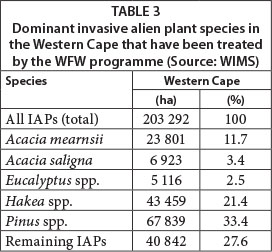
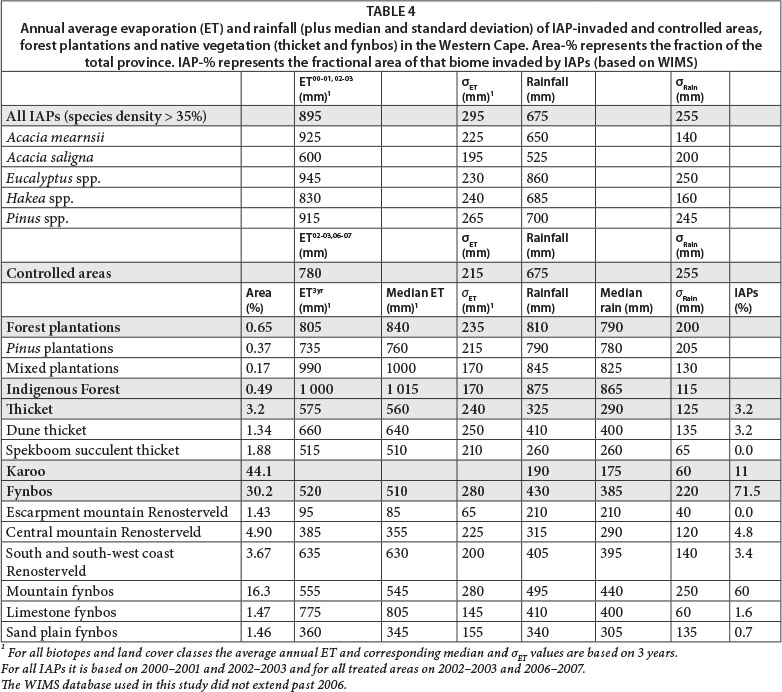
The five dominant IAPs (according to aerial cover) found in the Western Cape cover roughly 72% of the areas that are treated by WFW (Table 3; source: WIMS). These species are woody IAPs and include A. mearnsii, A. saligna, Eucalyptus spp., Hakea spp. and Pinus spp. Note that the total area treated in WIMS (203 292 ha) accounts for 5.5% of the total area estimated to be invaded in the Western Cape according to Le Maitre et al. (2000). The estimated annual average ET of these IAPs is listed in Table 4, together with annual rainfall estimates based on Schulze (2007).
The average annual ET of the IAPs for the three years ranges between 600 and 945 mm, with an average ET of 895 mm (σET = 295 mm.yr-1) (Table 4). The lowest ET estimates are for A. saligna and the highest values for A. mearnsii and Eucalyptus spp. The ET for areas invaded by Pinus and Hakea spp. are slightly lower and on average 915 and 830 mm, respectively. The variation in ET between the different IAPs corresponds well with the rainfall. The overall range of IAP ET agrees well with the ET of forest plantations (735 to 990 mm, Table 4), since many of the IAPs are plantation tree species.
The annual ET of the native vegetation (forest, thicket and fynbos biomes) ranged between 95 and 1 000 mm (Table 4). The highest ET estimates are for afromontane forest in the south-east of the Western Cape (Fig. 2, annual ET), which also receives the highest amount of rainfall.
The extent of invasion (assuming it can be related to the amount of treatments done by WFW, taken from WIMS) within the listed biomes is also shown in Table 4. The most invaded biome is fynbos (primarily mountain fynbos), where more than 70% of the WFW control activities take place. The annual ET for fynbos is estimated to range between 95 mm (escarpment mountain Renosterveld) and 775 mm (limestone fynbos), with an average ET of 520 mm. For thicket (combination of dune and spekboom thicket) the average ET is 575 mm. In general the ET estimates for all biomes were lower than the ET of the invaded areas. The ET of IAPs taken as one group exceeds the annual ET estimates of these biomes by between 36% (thicket) and 42% (fynbos).
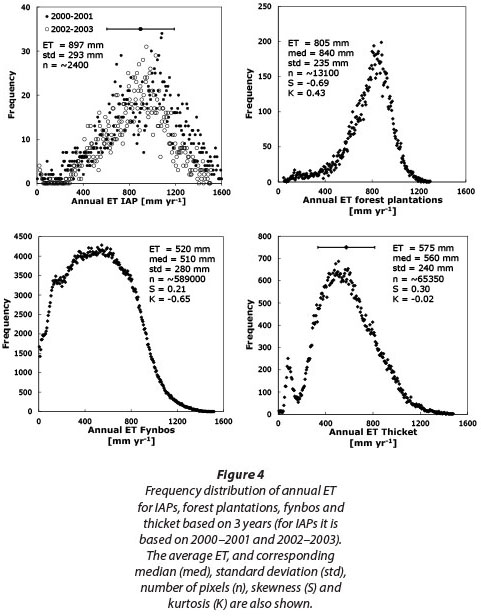
The annual ET of treated areas averages 780 mm (Table 4). This is roughly 13% lower than the ET of invaded areas, but generally higher than most biomes. Note that the variation in annual ET (σET) for the IAPs and the various biomes can be significant (Table 4). This is demonstrated in Fig. 4, which shows the frequency distributions of ET for IAPs, forest plantations, fynbos and thicket. It can be seen that the ET distribution in the histogram for IAPs and plantations is similar, but very different from fynbos. The large spread in ET, which is visible in all graphs, is expected to be the result of various factors: climatic conditions, soil characteristic and slope, water availability, density of species or native vegetation, species characteristics and physiology. The small peak in the histogram of thicket at 80 mm corresponds to an area of spekboom succulent thicket, an area located just east of Prince Albert.
Annual ET of invasive alien plants in KwaZulu-Natal
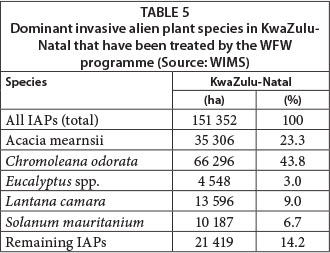
The five dominant IAPs found in KwaZulu-Natal include Chromoleana, Lantana camara, A. mearnsii, Solanum spp. and Eucalyptus spp. (Table 5). Together these species cover 86% of the invaded areas that have been treated by WFW (151 352 ha). Again it must be emphasised that this is a mere 16.4% of the total area presumed to be invaded in KwaZulu-Natal according to Le Maitre et al. (2000). The annual average ET of these IAP-species, of which three are (scrambly) shrub-like (Chromoleana, Lantana and Solanum) and two woody, are listed in Table 6. Again, the rainfall estimates present long-term means and are from the South African Atlas of Agro-hydrology and Climatology (Schulze, 2007).
The average annual ET (2003-2004) for the five IAPs ranges between 575 and 1 020 mm with an average ET of 875 mm (Table 6). The annual ET for Chromoleana was the highest and for Eucalyptus the lowest. Note, since ET for 2000-2001 are probably underestimated because of the limited availability of solar radiation data (in total 8 stations for the entire province were available, while for the other years more than 22 stations could be used), these data are excluded from the analysis, and the focus is on the two remaining years (2003-2004 and 2006-2007).
The annual ET estimates for the IAPs show that the ET of woody species (A. mearnsii and Eucalyptus) is lower than for the shrub-like species (Chromoleana, Lantana and Solanum) (Table 6). This corresponded with the higher annual NDVI values for the shrub-like vegetation (not shown here), compared with the woody types. Note that the IAP-ET results are based on a small amount of sampled pixels. This likely explains the difference in ET between the same IAP and forest plantation species (Table 6, A. mearnsii: 740 mm versus 615 mm, and Eucalyptus: 575 mm versus 690 mm). For shrub-like IAPs the obstruction by tall vegetation may affect the results, as the AIP-understory might be missed by the satellite.
In Table 6, the average annual ET of the biomes found in KwaZulu-Natal (forest, thicket, savanna and grassland) are also presented. The average ET for these biomes ranges between 640 and 755 mm. Compared to the Western Cape the spread in ET between the biomes is much smaller and consistent with the rainfall data.
Table 6 also shows the extent of invasion (IAPs %) within the biomes. Most of the WFW treatments of IAPs took place in the savanna (44%), grassland (14%) and, to a small extent, thicket biomes (6.4%). The IAP-ET (taken as one group) exceeds the annual ET estimates of all biomes by 14% (valley thicket) to 28% (grassland). The average ET of treated areas in KwaZulu-Natal was 825 mm, approximately 6% lower than for the invaded areas. The smaller difference in IAP-ET and the ET of treated areas (compared to the results of the Western Cape) is likely related to the fact that the difference between IAP-ET and the ET of native vegetation is also smaller.
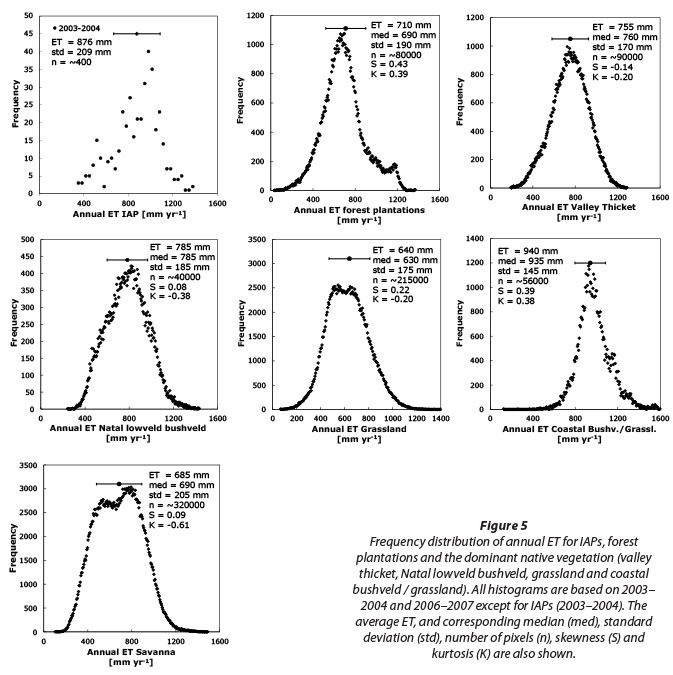
Finally, the frequency distributions of ET are shown in Fig. 5 for IAPs, a selection of biomes (grassland, thicket and savanna) and forest plantations. These histograms demonstrate that the variation in ET within one vegetation class can be large. Note that the histogram of IAP-ET is based on a limited amount of sampled pixels (Fig. 5). However, these histograms compare well in shape with those for the Western Cape (Fig. 4). Again it is expected that the large spread in ET (for most graphs) is likely the result of various factors linked to climatic conditions, soil characteristics and slope, water availability, density of species or vegetation, species characteristics and physiology. The small peak in the histogram of forest plantations at 1 160 mm corresponds with the plantations north of Richards Bay.
DISCUSSION
ET of IAPs and native vegetation using the SEBAL model
In this study, SEBAL using MODIS satellite images was used to estimate the ET of IAPs and native vegetation. Over the past decade, the SEBAL model has been applied extensively over various regions to compare ET of various land uses and land use change in space and time to address water resource and irrigation challenges (e.g. Goodrich et al., 2000; Bastiaanssen and Chandrapala, 2003; Bastiaanssen et al., 1998a,b, 2002, 2005; Immerzeel et al., 2008; Singh et al., 2008; Mohamed et al., 2011). However, to the authors' knowledge this study is the first example where remote sensing data was used to estimate the ET of IAPs in space and time. Using this approach, the limited database on water use of IAPs available in South Africa to the WFW programme was substantially expanded and represents some of the first sources of annual IAP estimates for many of the top invaders listed in Table 1 and also for native vegetation.
IAP-ET vs. ET native vegetation and treated areas
The impact of IAPs on available water resources in an area can be assessed in terms of ET increases when compared to treated (cleared) areas or areas under native vegetation. When comparing IAP-ET and ET of treated areas, small differences in ET are expected, in view of the fact that the study comprised areas with low invasion densities and under water-limiting conditions (non-riparian). We found that the IAP-ET exceeded the ET from treated areas by conservative amounts of 13% and 6% for the Western Cape and KwaZulu-Natal provinces, respectively. However, comparing IAP-ET to ET of specific native vegetation classes much larger differences and variation in ET were found. In the Western Cape, considering the native vegetation where most clearing is taking place, the IAP-ET exceeds the annual ET estimates of these native vegetation types by between 36% (thicket) and 42% (fynbos). Similarly, in KwaZulu-Natal, IAP-ET exceeds the annual ET estimates of native vegetation by 14% (valley thicket) to 28% (grassland).
Cavaleri and Sack (2010) reviewed results from over 40 studies worldwide where the water use of IAPs and native vegetation were compared across various scales (leaf, plant and ecosystem). Important to note is that they focussed on IAPs and native vegetation with the same growth form and not specifically on, e.g., woody or herbaceous invasions which are common in SA. At each scale, Cavaleri and Sack (2010) found numerous differences in water use between specific paired invasive and native species. At leaf scale, IAPs had a greater potential to have stomatal conductance (and water use) exceeding that of native plants (related to higher overall metabolic rates of IAPs). At plant scale, they found that native and IAPs had a similar probability of displayingthe higher sap flow rate in the comparison. They suggest that the disconnect between leaf and plant scale is related to the wide variation in leaf surface properties (which are missed by the leaf scale measurements), and that whole-plant water use can increase and/or decrease with plant size and age. Also, interestingly, they found that at ecosystem scale the sap flow rates of IAP-dominated ecosystems were likely to be higher than those of native-dominated ecosystems, but that this pattern was not found for ET (although they mentioned the few data available at this scale). They also highlighted the strong dependence of differences in ET (IAPs vs. native species) on climate, where hotter and wetter climates at the coarser scales favoured higher IAP-ET.
Calder and Dye (2001) investigated potential causes for IAP-ET to exceed ET of native vegetation, specifically where the water use (ET) of IAP-trees vs. short native crops are concerned. Using the 'limits concept' they developed a methodology to assess under what conditions high water use by IAPs may occur. They concluded that the greatest increase in IAP-ET (in dry climates) may occur in water-limited rather than riparian (water-unlimited) conditions (deep-rooting behaviour of alien tree species compared to short native vegetation, such as grass, which in addition is also winter dormant).
Comparison of SEBAL-ET estimates with ground measurements
A number of studies have assessed the accuracy of the SEBAL energy balance and ET estimates, with differences in ET estimates ranging between 1 and 11% (Bastiaanssen et al., 2002; Bastiaanssen and Bandara, 2001; Bastiaanssen and Chandrapala, 2003; Mohamed et al., 2004; Tasumi et al., 2005; Singh et al, 2008; Wang et al., 2009). Bastiaanssen et al. (1998b; 2005) reviewed the accuracy of SEBAL under several climatic conditions at both field and catchment scale by validating data against field observations. Allen et al. (2007) found that at field scale the accuracy of SEBAL typically ranges between 85% (1 day) and 95% (seasonal basis), as some random errors are reduced in the aggregation of daily ET to seasonal ET. At larger scales (e.g. catchment level) an average accuracy of 96% was found (Bastiaanssen et al., 2005).
Table 7 lists (field) studies where the annual ET of IAPs (A. mearnsii, Eucalyptus and Pinus) and native vegetation (fynbos, grassland and thicket) were measured in the Western Cape and KwaZulu-Natal provinces. Most field measurements listed in Table 7 were done outside the SEBAL study years, making it impossible to validate the SEBAL-ET data generated in this study. Nevertheless it provides comparative data.
The IAP-ET data in Table 7 are generally much higher than the average values found in this study. In most cases the measured ET is also higher than the rainfall, indicating that no water defictits occur in these riparian areas. Since these IAPs are evergreen they can transpire throughout the year, resulting in high ET-values. Isotope measurements suggested that at Seven-Oaks (Acacia, non-riparian site) during the dry months groundwater is the source of water (Clulow, 2013). As the field ET data mainly represent the wet range, they are difficult to compare with the SEBAL-ET results covering a wide range of conditions.
The annual ET of some native vegetation types is also listed in Table 7. For grassland (KwaZulu-Natal), the field (catchment) measurements range between 600 and 850 mm. This agrees well with the SEBAL results: 640 ± 175 mm (Table 6). Field measurements of fynbos show an ET between 600 and 900 mm (catchment-scale estimates) and up to 1 330 mm (Bowenratio technique) for a riparian zone. The high ET values of the latter site are likely the result of non-limiting water conditions and the evergreen nature of fynbos in this habitat. As for the IAP-ET measurements, the fynbos field measurements, representing relative wet circumstances (high rainfall), exceed the SEBAL-ET estimates of fynbos (520 ± 280 mm) (Table 4) covering a wide range of conditions.
Most SEBAL-ET validation studies are based on field measurements that were done in relatively homogeneous (agricultural) fields and areas. Validating the SEBAL-ET of landscapes populated by native vegetation and invaders is much more difficult. These areas are generally very complex due to spatial variations in species, species density, age, physiology, topography, micro-meteorological and -hydrological conditions, thereby limiting the representativeness of most in-situ measurement techniques. When the field data is representative of a larger area, such as for the catchment-scale studies listed in Table 7, the agreement with SEBAL-ET data appears to improve.
At a provincial scale the average precipitation excess for the Western Cape and KwaZulu-Natal provinces is roughly 35 and 70 mm yr-1, respectively (~ 9% of the mean annual rainfall) (Table 2). Le Maitre et al. (2000), using a biomass-streamflow-model, estimated the mean annual runoff as 50 and 130 mm.yr-1 for the Western Cape and KwaZulu-Natal, respectively (14 to 15% of the mean annual rainfall). Basson et al. (1997) reported precipitation excess values for catchments in the Western Cape ranging between 1 and 8%, and for KwaZulu-Natal between 5 and 11%. At a provincial scale, our findings for the mean annual runoff (precipitation excess) suggest that the SEBAL-ET results are comparable to previous studies.
IAP-ET differences between provinces
IAP-ET estimates for the same species in the Western Cape exceeded that in KwaZulu-Natal - by 185 mm for A. mearnsii and 370 mm for Eucalyptus (Tables 4 and 6). Although there is a substantial difference in the elevation at which A. mearnsii occurs (320 m for Western Cape versus 1 300 m for KwaZulu-Natal), the difference in ET is probably due to the limited amount of sampled pixels (associated with limited representation of species density, soil water availability, etc.) analysed for KwaZulu-Natal. Furthermore, the ET results for KwaZulu-Natal are based on 1 year, which limits the climatic representativeness of the dataset. Despite the limited data, it must be noted that the different spread of IAPs in the two provinces might explain the large difference in ET. In the Western Cape, Acacia and Eucalyptus tend to invade only relatively wet areas such as riparian zones, while in KwaZulu-Natal these species can be found across a wider range of conditions due to the generally wetter climate (see Fig. 1).
Validity of SEBAL-ET of KwaZulu-Natal for 2000-2001
One of the input requirements for the SEBAL model is surface solar (shortwave) radiation data. Sufficient (ground stations) and accurate radiation data are unfortunately not always available. This was particularly the case for KwaZulu-Natal for the year 2000-2001. A good alternative is the remote-sensing products provided by the Land Surface Analysis Satellite Applications Facility, which have also been used in this study. These products are however available only from 2005. As a result the first SEBAL year (2000-2001, average rainfall year) for KwaZulu-Natal had to be processed using limited radiation data and stations (8 instead of 22 stations). Since the ET results for this year were significantly lower than the other two years (Table 2), it was decided to discard this year from the analysis.
CONCLUSIONS
Methodology: In this study we showed that the SEBAL model using remote-sensing data can be used to determine ET over time and space. The results presented in this study represent the first estimates of large-scale annual evaporation from IAPs and native vegetation in the Western Cape and KwaZulu-Natal provinces of South Africa. Combining the ET data with information on land use we showed differences in ET between IAPs, native vegetation, commercial forestry species and IAP control areas. This spatial approach holds great potential for assessing the impact that WFW has on the water resources of South Africa. Although course resolution (at 250 m) remote-sensing data can be used to assess the impact of IAPs on ET, it respresents data largely from areas with lower invasion densities, often occurring in non-riparian, water-limited regions. We believe that higher resolution data is likely more suitable to assess the impact of IAPs on ET across a wider range of invasion densities and water regimes, including riparian zones.
Validation: Validation of the SEBAL-ET estimates for IAPs and native vegetation against ground measurements was not possible, but comparisons against measured data were done. In most cases the (limited available) ground measurements of ET were inconsistent with SEBAL-ET. In general, the complexity of landscapes populated by natural vegetation and invaders limits the area-representativeness of local field measurements and comparison with moderate resolution satellite pixels. Increasing the resolution of satellite imagery (e.g. Landsat-8 with 100 m resolution) and the using scintillometers, which can provide path-average surface fluxes on kilometre scales, might lead to a better validation of satellite-based ET data.
Impact of IAPs on ET and water availability: We confirmed what was found in previous studies - that invaded areas showed a higher ET than most native vegetation, with the differences in ET (IAPs vs. native vegetation) varying greatly. We found that treated areas had a lower ET than invaded areas. In both provinces we found that the clearing of IAPs by the WFW programme has a positive effect on the availability of water resources through a reduction in ET. Since the majority of invaded areas considered in this analysis represent non-riparian areas with moderate species densities (~57%), the impact of control of IAPs on ET is likely conservative but still important. The impact of WFW control of densely-invaded riparian areas is therefore likely more pronounced.
ACKNOWLEDGEMENTS
The authors wish to thank Working for Water for funding this research and specifically Mr. Andrew Wannenburgh for providing invasive alien spread and clearing data (WIMS). The steering committee (Prof. Rick Allen, University of Idaho (USA); Prof. Wim Bastiaanssen, eLEAF (The Netherlands); Prof. Colin Everson, University of KwaZulu-Natal (South Africa) and Dr David Le Maitre from CSIR (South Africa) are also thanked for valuable contributions to this study and paper. Finally, the authors wish to thank eLEAF, CSIR and the University of KwaZulu-Natal for making resources available to complete this project, and the external reviewers for their valuable comments.
REFERENCES
ALLEN RG, PEREIRA LS, RAES D and SMITH M (1998) Crop Evapotranspiration: Guidelines for Computing Crop Water Requirements. FAO Irrigation and Drainage Paper 56, FAO, Rome. 300 pp. [ Links ]
ALLEN RG, TASUMI M, MORSE A, TREZZA R, WRIGHT JL, BASTIAANSSEN W, KRAMBER W, LORITE I and ROBINSON CW (2007) Satellite-Based Energy Balance for Mapping Evapotranspiration with Internalized Calibration (METRIC) Applications. J. Irrig. Drain. Eng. 133 (4) 395-406. [ Links ]
BASSON MS, VAN NIEKERK PH and VAN ROOYEN JA (1997) O verview of Water Resources Availability and Utilization in South Africa. Department of Water Affairs and Forestry, Pretoria. 72 pp. [ Links ]
BASTIAANSSEN WGM, MENENTI M, FEDDES RA and HOLTSLAG AAM (1998a) A remote sensing surface energy balance algorithm for land (SEBAL): Part 1. Formulation. J. Hydrol. 212/213 198-212. [ Links ]
BASTIAANSSEN WGM, PELGRUM H, WANG J, MA Y, MORENO JF, ROERINK GJ and VAN DER WAL T (1998b) A surface energy balance algorithm for land (SEBAL): Part 2. Validation. J. Hydrol. 212/213 213-229. [ Links ]
BASTIAANSSEN WGM (2000) SEBAL-based sensible and latent heat fluxes in the irrigated Gediz Basin, Turkey. J. Hydrol. 229 87-100. [ Links ]
BASTIAANSSEN WGM and BANDARA KMPS (2001) Evaporative depletion assessments for irrigated watersheds in Sri Lanka. Irrig. Sci. 21 (1) 1-15. [ Links ]
BASTIAANSSEN WGM, UD-DIN-AHMED M and CHEMIN Y (2002) Satellite surveillance of water use across the Indus Basin. Water Resour. Res. 38 (12) 1273-1282. [ Links ]
BASTIAANSSEN WGM and CHANDRAPALA L (2003) Water balance variability across Sri Lanka for assessing agricultural and environmental water use. Agric. Water Manage. 58 (2) 171-192. [ Links ]
BASTIAANSSEN WGM, NOORDMAN EJM, PELGRUM H, DAVIDS G, THORESON BP and ALLEN RG (2005) SEBAL model with remotely sensed data to improve water-resources management under actual field conditions. J. Irrig. Drain. Eng. 131 (1) 85-93. [ Links ]
BOSCH JM, VAN WILGEN BW and BANDS DP (1986) A model for comparing water yield from fynbos catchments burnt at different intervals. Water SA 12 191-196. [ Links ]
CAVALERI MA and SACK L (2010) Comparative water use of native and invasive plants at multiple scales: a global meta-analysis. Ecology 91 (9) 2705-2715. [ Links ]
CALDER IR and Dye P (2001) Hydrological impacts of invasive alien plants. Land Use Water Resour. Res. 1 1-12. [ Links ]
CLULOW AD (2008) The long-term measurement of total evaporation over Acacia mearnsii using large aperture scintillometry. MSc thesis, University of KwaZulu-Natal. 91 pp. [ Links ]
CLULOW AD (2013) Personal communication, 23 April 2013. AD Clulow, hydrologist, Centre for Water Resources Research, University of KwaZulu-Natal, Private Bag x01, Scottsville, 3209, South Africa. [ Links ]
CLULOW AD, EVERSON CS and GUSH MB (2011) The long-term impact of Acacia Mearnsii trees on evaporation, stream flow, and ground water resources. WRC Report No. TT 505/11. Water Research Commission, Pretoria. [ Links ]
CULLIS JDS, GÖRGENS AHM and MARAIS C (2007) A strategic study of the impact of invasive alien plants in the high rainfall catchments and riparian zones of South Africa on total surface water yield. Water SA 33 (1) 35-42. [ Links ]
DYE PJ and POULTER AG (1995) A field demonstration of the effect on streamflow of clearing invasive pine and wattle trees from a riparian zone. S. Afr. For. J. 173 27-30. [ Links ]
DYE PJ, POULTER AG, SOKO S and MAPHANGA D (1997) The determination of the relationship between transpiration rate and declining available water for Eucalyptus grandis, WRC Report No. 441/1/97. Water Research Commission, Pretoria. [ Links ]
DYE PJ and BOSCH JM (1999) Sustained water yield in afforested catchments: the South African experience. In: Von Gadow K, Pukkala T, Tome M (eds.) Sustainable Forest Management. Kluwer, Dordrecht. 99-120. [ Links ]
DYE PJ, MOSES G, VILAKAZI P, NDLEA R and ROYAPPEN M (2001) Comparative water use of wattle thickets and indigenous plant communities at riparian sites in the Western Cape and KwaZulu-Natal. Water SA 27 529-538. [ Links ]
DYE PJ and JARMAIN C (2004) Water use by black wattle (Acacia mearnsii): Implications for the links between removal of invading trees and catchment stream flow response. S. Afr. J. Sci. 100 40-44. [ Links ]
DYE PJ, JARMAIN C, LE MAITRE DC, EVERSON CS, GUSH MB and CLULOW A (2008) Modeling vegetation water use for general application in different categories of vegetation. WRC Report No. 1319/1/08. Water Research Commission, Pretoria. [ Links ]
EVERSON CS, MOLEFE GL and EVERSON TM (1998) Monitoring and modeling components of the water balance in a grassland catchment in the summer rainfall area of South Africa. WRC Report No. 493/1/98. Water Research Commission, Pretoria. [ Links ]
GOODRICH DC, SCOTT R, QI J, GOFF B, INKRICH CL, MORAN MS, WILLIAMS D, SCHAEFFER S, SNYDER K, MACNISH R, MADDOCK T, POOL D, CHEBOUNI A, COOPER DI, EICHINGER WE, SHUTTLEWORTH WJ, KERR Y, MARSETT R and NI W (2000) Seasonal estimates of riparian evapotranspiration using remote and in situ measurements. Agric. For. Meteorol. 105 281-309. [ Links ]
GÖRGENS A and VAN WILGEN BW (2004) Invasive alien plants and water resources in South Africa: current understanding, predictive ability and research challenges. S. Afr. J. Sci. 100 27-33. [ Links ]
HENDERSON L (2001) Alien Weeds and Invasive Plants - A Complete Guide to Declared Weeds and Invaders in South Africa. Plant Protection Research Institute. Handbook no. 12. Agricultural Research Council, Pretoria. [ Links ]
IMMERZEEL WW, GAUR A and ZWART SJ (2008) Integrating remote sensing and a process-based hydrological model to evaluate water use and productivity in a south Indian catchment. Agric. Water Manage. 95 (1) 11-24 [ Links ]
JARMAIN C and EVERSON CS (2002) Comparative evaporation measurements above commercial forestry and sugarcane canopies in the KwaZulu-Natal Midlands. CSIR Report No. ENV-C-S 2002005. CSIR, Pretoria. [ Links ]
JARMAIN C, EVERSON CS, SAVAGE MJ, MENGISTU M and CLULOW AD (2008) Refining Tools For Evaporation Monitoring In Support Of Water Resources Management. WRC Report No. 1567/1/08. Water Research Commission, Pretoria. [ Links ]
KOTZÉ I, BEUKES H, VAN DEN BERG E and NEWBY T (2010) National Invasive Alien Plant Survey, Report No GW/A/2010/21. Agricultural Research Council, Pretoria. [ Links ]
LE MAITRE DC, VAN WILGEN BW, CHAPMAN RA and McKELLEY DH (1996) Invasive plants in the Western Cape, South Africa: Modeling the consequences of a lack of management. J. Appl. Ecol. 33 161-172. [ Links ]
LE MAITRE DC, VERSFELD DB and CHAPMAN RA (2000) The impact of invading alien plants on surface water resources in South Africa: A preliminary assessment. Water SA 26 397-408. [ Links ]
LOW AB and REBELO AG (1996) Vegetation of South Africa, Lesotho and Swaziland, Department of Environmental Affairs and Tourism, Pretoria. 85 pp. [ Links ]
MARAIS C and WANNENBURGH AM (2008) Restoration of water resources (natural capital) through the clearing of invasive alien plants from riparian areas in South Africa - Costs and water benefits. S. Afr. J. Bot. 74 526-537. [ Links ]
MILLENIUM ECOSYSTEMS ASSESSMENT (2005) Ecosystems and Human Well-Being: Synthesis. Island Press, Washington, D.C., USA. [ Links ]
MOHAMED YA, BASTIAANSSEN WGM and SAVENIJE HHG (2004) Spatial variability of evaporation and moisture storage in the swamps of the upper Nile studied by remote sensing techniques. J. Hydrol. 277 116-124. [ Links ]
MOHAMED YA, BASTIAANSSEN WGM, SAVENIJE HHG, VAN DEN HURK BJJM and FINLAYSON CM (2011) Wetland versus open water evaporation: an analysis and literature review. J. Phys. Chem. Earth 47-48 114-121. [ Links ]
PENG J, BORSCHE M, LIU Y and LOEW A (2013) How representative are instantaneous evaporative fraction measurements for daytime fluxes? Hydrol. Earth Syst. Sci. Discuss. 10 2015-2028. [ Links ]
PRINSLOO FW and SCOTT DF (1999) Streamflow response to the clearing of alien invasive trees from riparian zones from three sites in the Western Cape Province. S. Afr. For. J. 185 1-7. [ Links ]
RAUPACH MR (1994) Simplified expressions for vegetation roughness length and zero-plane displacement as functions of canopy height and area index. Boundary-Layer Meteorol. 71 211-216. [ Links ]
SAVAGE MJ, EVERSON CS, ODHIAMBO GO, MENGISTU MJ and JARMAIN C (2004) Theory and practice of evaporation measurement, with special focus on SLS as an operational tool for the estimation of spatially-averaged evaporation. WRC Report No. 1335/1/04. Water Research Commission, Pretoria. [ Links ]
SCHULZE RE (1979) Hydrology and Water Resources of the Drakensberg. Natal Town and Regional Planning Commission, Pietermaritzburg. [ Links ]
SCHULZE RE (2007) South African Atlas of Climatology and Agrohydrology. WRC Report No. 1489/1/06. Water Research Commission, Pretoria. [ Links ]
SCOTT DF, PRINSLOO FW, MOSES G, MEHLOMAKULA M and SIMMERS ADA (2000) A re-analysis of the South African catchment afforestation experimental data. WRC Report No. 810/1/00. Water Research Commission, Pretoria. [ Links ]
SINGH RK, IRMAK A, IRMAK S and MARTIN DL (2008) Application of SEBAL Model for Mapping Evapotranspiration and Estimating Surface Energy Fluxes in South-Central Nebraska. J. Irrig. Drain. Eng. 134 (3) 273-285. [ Links ]
TASUMI M, TREZZA R, ALLEN RG and WRIGHT JL (2005) Operational aspects of satellite-based energy balance models for irrigated crops in the semi-arid U.S. Irrig. Drain. Syst. 19 355-376. [ Links ]
TASUMI M, ALLEN RG and TREZZA R (2006) DEM based solar radiation estimation model for hydrological studies. Hydrol. Sci. Technol. 22 (1-4) 197-208. [ Links ]
VAN DEN BERG EC, PLARRE C, VAN DEN BERG HM and THOMPSON MW (2008) The South African National Land Cover 2000. Report No GW/A/2008/86. Agricultural Research Council (ARC) and Council for Scientific and Industrial Research (CSIR), Pretoria. [ Links ]
VAN DE GRIEND AA and OWE M (1992) On the relationship between thermal emissivity and the normalized difference vegetation index for natural surfaces. Int. J. Remote Sens. 14 (6) 1119-1131. [ Links ]
VERHOEF A, McNAUGHTON KG and JACOBS AFG (1997) A paramerization of momentum roughness length and displacement height for a wide range of canopy densities. Hydrol. Earth Syst. Sci. 1 81-91. [ Links ]
VERSFELD DB, LE MAITRE DC and CHAPMAN RA (1998) Alien Invading Plants and Water Resources in South Africa: A Preliminary Assessment. WRC Report No. TT 99/98. Water Research Commission, Pretoria. [ Links ]
VOOGT M (2006) METEOLOOK, a physically based regional distribution model for measured meteorological variables. MSc thesis, Delft University of Technology. [ Links ]
WANG J, SAMMIS TW, GUTSCHICK VP, GEBREMICHAEL M and MILLER DR (2009) Sensitivity Analysis Of The Surface Energy Balance Algorithm For Land (SEBAL). ASABE Trans. 52 (3) 801-811. [ Links ]
WANNENBURGH A (2009) Personal communication, 3 June 2009. A Wannenburgh, Department of Water and Environmental Affairs, Working for Water Programme, Private Bag X4390, Cape Town 8000. [ Links ]
ZWART S and BASTIAANSSEN WGM (2007) SEBAL for detecting spatial variation of water productivity and scope for improvement in eight irrigated wheat systems. Agric. Water Manage. 89 287-296. [ Links ]
 Correspondence:
WML Meijninger
+31 (0) 317 427 801
e-mail: wouter.meijninger@eleaf.com
Received 18 July 2012
Accepted in revised form 17 December 2013

