


Services on Demand
Article
 English (pdf)
 Article in xml format
 Article references
Indicators

Related links
-
 Cited by Google
 -
 Similars in Google
Share

 Permalink
Water SA
On-line version ISSN 1816-7950
Print version ISSN 0378-4738
Water SA vol.40 n.1 Pretoria Jan. 2014
ARTICLES
A choice experiment application to estimate willingness to pay for controlling excessive recreational fishing demand at the Sundays River Estuary, South Africa
DE Lee; SG Hosking; M du Preez
Department of Economics, Nelson Mandela Metropolitan University, Port Elizabeth, 6001, South Africa
ABSTRACT
The Sundays River Estuary, situated in the Eastern Cape, South Africa, has excessive recreational demand for estuarine services, specifically recreational fishing. The estuary has been over-fished, putting its sustainability at risk. Various management interventions may be required in order to save it, but how is this to be done without reducing welfare? The main aim of this paper is twofold: first, to assess and comprehend the economic value of the estuarine resources at stake; and, second, to propose policy measures to redress the situation (excessive demand, specifically recreational fishing). An application of a choice experiment reveals that the physical size of fish stocks is a very important predictor of recreational choice at the Sundays River Estuary, and it is recommended that demand be curtailed through an increase in the boat license fee for using the estuary of ZAR174 per annum.
Keywords: Estuary, demand management, recreational attributes, recreational fishery, choice experiment
INTRODUCTION
The Sundays River Estuary, situated on the east coast of South Africa, is a dynamic ecosystem that provides a host of services, particularly recreational, but excessive demand for some of these services has disturbed the balance within the system (Day, 1980). Nowhere is this more apparent than with respect to the fish stocks (Wooldridge, 2010). Three main species are targeted in the Sundays River estuary: the spotted grunter (Pomadasys commersonnii), the dusky kob (Argyrosomus japonicas), and the white steenbras (Lithognathus lithognathus). The stock status of the dusky kob and white steenbras is believed to be collapsed, while the stock status of the spotted grunter is considered over-exploited (Cowley et al. 2009). The most recent research available on the adult dusky kob population suggests that it is between 1 and 4.5% of the non-impacted (original) population, a level that could be below the recovery threshold for this species (Griffiths, 1997). The populations of these species have declined radically during the last decade due to the popularity of the Sundays River Estuary for recreational fishing. The drop in the fish stock population numbers makes these three species particularly vulnerable, jeopardising their sustainability in the long-run.
In order to restore the targeted fish species to a level where harvesting is equal to maximum sustainable yield, management has to be aware of the choices that recreational users make when visiting this estuary (Hay et al. 2008). The Sundays River fishery faces a trade-off between the short-run (current) human recreational predation demands for targeted fish in the estuary, and the need for sustainability of the fishery into the long-run. Management intervention, through the use of an appropriate mechanism, is required in order to control recreational demand, and allow the fishery to replenish.
The aim of this paper is to contribute to this management intervention by assessing the economic value of the recreational resources at stake at the Sundays River Estuary and recommending policy measures to redress the situation (specifically, excessive recreational fishing). The aim is achieved through the application of a choice experiment (CE).
The biophysical and socio-economic characteristics of the Sundays River Estuary
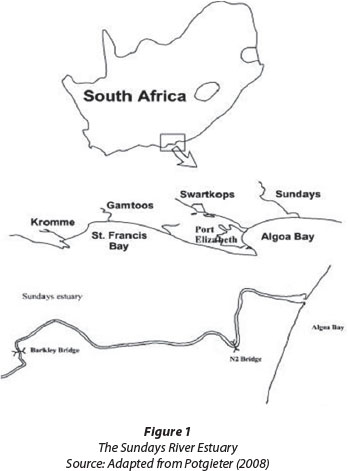
The Sundays River Estuary (33°43' S, 25°25' E) is situated in the Eastern Cape, South Africa, approximately 40 km northeast of Port Elizabeth (see Fig. 1). The estuary is approximately 20 km long, and permanently opens and discharges at Algoa Bay, into the Indian Ocean (MacKay and Schumann, 1990).
The Sundays River Estuary contains 2 types of microalgae, namely phytoplankton and benthic microalgae. Phytoplankton forms the base of the food chain in the estuary (Unit for Integrated Environmental and Coastal Management: IECM, 2010). The most dominant vegetation types found in this estuary are reeds and sedges, which cover an area of 29 ha (IECM, 2010). Extensive salt marshes are precluded because of the narrow channel-like morphology of this estuary. The salt marsh covers an area of 21.7 ha (IECM, 2010). Submerged macro-phytes include pondweed in the upper reaches and eelgrass in the lower reaches of the estuary. Twenty Zooplankton species can be found in the Sundays River Estuary. Ichthyoplankton (fish larvae) also forms part of the Zooplankton and 17 species from 11 families can be found in this estuary (IECM, 2010). Despite the limited area of mudflat available in the estuary, mud prawn (an example of invertebrate macrofauna) can attain high densities in localised areas (IECM, 2010). The Sundays River Estuary has a high fish species richness - 51 species representing 27 families of fish have been recorded (Cowley et al., 2009). Marine migrants make up 53% of the total number of species, whereas 25% are estuarine residents and 18% are marine stragglers. An abundance of bird species makes the Sundays River Estuary a popular location for bird watching -between 27 and 166 species have been recorded (IECM, 2010). Up to 59 aquatic species have been sited (IECM, 2010).
As far as the socio-economic characteristics of the recreational users of the Sundays River Estuary are concerned, the most recent and comprehensive data available is that of Cowley et al. (2009). This study reported that 19% of recreational users of the estuary were local residents while approximately 73% were from areas less than 50 km away. Of the recreational users, more than 60% were between the ages of 20 and 50 years. Males accounted for 92% of all recreational users. In terms of educational achievement, 28% had a matriculation certificate, while a further 30% had some form of tertiary qualification.
Theory of choice (random utility)
In his seminal paper, Lancaster (1966) argued that it was the attributes of a good that determined the utility derived from the good, and that utility could therefore best be explained in terms of these attributes. It was also recognised that choice was not a fixed determined action but that there were random elements to it (Luce, 1959). The people making the choices did not have complete information and were faced with uncertainty in making their utility calculations. Following this line of thinking, the utility function has come to be thought of as the sum of two parts: an observed or measurable component, and an unobserved or random component. This model currently serves as the foundation for modelling the choices that individuals make (Howard and Sheth, 1969; Abelson and Levy, 1985; Engel et al., 1995; Bateman et al., 2002; Hensher et al., 2005).
The random utility model allows for random (error) influences in addition to identified fixed ones (McFadden, 1974; 1984):

where:
Uiq represents utility derived for consumer q from option i
Viq is an attribute vector representing the observable component of utility from option i for consumer q
εiq is the unobservable component of latent utility derived for consumer q from option i (Nam Do and Bennett, 2007)
Assuming a linear additive form for the multidimensional deterministic attribute vector (Viq):

where:
ßki are utility parameters for option i, and
siq represents 1 to k different attributes with differing levels,
Eq. (1) can be expanded to:

This random utility model is converted into a choice model by recognising that an individual (q) will select alternative if and only if (iff) Uiq is greater than the utility derived from any other alternative in the choice set. Alternative is preferred to j iff P[(Viq. + εiq) > (Vjq. + εjq)], and choice can be predicted by estimating the probability of individual (q) ranking alternative i higher than any other alternative j in the set of choices available (Louviere et al., 2000; Nam Do and Bennett, 2007).
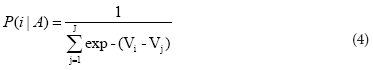
The probability of consumer q choosing option i from a choice set may be estimated by means of the maximum likelihood estimation (MLE) approach, whereby estimates are obtained through the maximisation of a probabilistic function with respect to the parameters (Louviere et al., 2000; Hensher et al., 2005; Nam Do and Bennett, 2007). This estimation approach requires the random components (e ) to be independently and identically distributed (IID) as well as independent of irrelevant alternatives (IIA). This type of statistical distribution is referred to as the extreme value type 1 distribution (EV1). Using the EV1 distribution, the unobserved random components associated with each alternative must be converted into a workable component of the probability expression. Once this is done, the model can be simplified by integrating the random component out of the model. The resultant choice model only has unknowns relating to the utility parameters of each attribute within the observed component of the random utility expression, and is called the multinomial logit (MNL) or (more correctly) the conditional logit (CL) choice model (Hanley et al., 2001; Hanley et al., 2004). The CL model takes the following form (Louviere et al., 2000):
where:
Pi. is the probability of an individual choosing the ith alternative over the jth in the set of choices A
Vi. is the representative utility from the ith alternative
Vj. is the representative utility from the jth alternative
The underlying assumptions of the model are that (Louviere et al., 2000):
• Scale parameters have constant variance (typically equal to 1 (Ben-Akiva and Lerman, 1985))
• Random components do not exhibit serial correlation (IIA assumption)
• Utility parameters are set
• There is no heterogeneity between individual preferences
If the first of these assumptions is relaxed, the scale parameter (λ) will not have constant variance, and will become an additional multiple of each of the alternatives in the model and influence choice. The CL model can then be adapted to allow for variance of a scale parameter (λ) by dividing the respective representative utilities defining the probability of choice by it (scale parameter):

However, a problem of bias occurs if the IIA assumption is violated, because then the observed (Vi/λi) and unobserved (εj./λi) components of utility are dependent on one another and the error terms exhibit serial correlation (Nam Do and Bennett, 2007). A more flexible model that relaxes the IIA assumption is the heteroskedastic extreme value (HEV) model. This model, initially developed and applied by Bhat (1995), allows the variance of the error term to differ across alternatives within a choice set. It models the probability that an individual (q) will choose the ith alternative in a choice set (A), but relaxes the assumption of independence among the random components. Substituting z in place of (εi/λi) in the choice model, the HEV specification is:

A problem with both the CL and HEV models is that they assume that the coefficients of variables that enter the model are the same for all consumers, i.e. that there is homogeneity in preferences across respondents, which implies that consumers have the same socioeconomic characteristics; for instance, it assumes that people with the same level of income will equally value the good in question (MacDonald et al., 2005). A model that relaxes the assumption of homogeneity of preference (allowing for heterogeneity) is the random parameter logit (RPL) model.
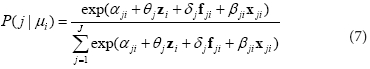
The RPL model is a generalisation of the standard MNL logit model. Increases in estimation capabilities through advancements in computational power have led to the RPL method becoming the most popular method of choice during the previous two decades. The advantages of this model are that (1) the alternatives are not independent because the model does not rely on the IIA assumption, and (2) the existence of unobserved heterogeneity can be investigated (Ben-Akiva et al., 1999; Hensher and Greene, 2002; Carlsson et al., 2003). As a result, the RPL model has been found to have advantages over the CL model in terms of fit and overall welfare estimation (Gopinath, 1995; Bhat, 1997; Revelt and Train, 1998; McFadden and Train, 2000; Carlsson et al., 2003; MacDonald et al., 2005; Kragt and Bennett, 2008). A generalised version of the RPL choice model is (Louviere et al., 2000):
where:
αji., is a fixed or random alternative specific constant (ASC) with j = 1,...., J alternatives and i = 1,...., I individuals; αj. = 0
δj. is a vector of non-random parameters
θi. is a vector of individual-specific parameters
βji.. is a parameter vector that is randomly distributed across individuals
µi. is the individual-specific random disturbance of unobserved heterogeneity and is a component of the βji.. parameter vector
zi is a vector of individual-specific characteristics, for example, income
fji is a vector of individual-specific and alternative-specific non-randomised attributes
xji.. is a vector of individual-specific and alternative-specific randomised attributes
The RPL can take on a number of different functional forms and incorporate a number of underlying distribution assumptions. The most popular assumptions are normal, triangular, uniform and log-normal distributions (Bhat, 2000; 2001). The log-normal distribution is applied if the response parameter needs to be a specific sign (Louviere et al., 2000; Carlsson et al., 2003). Where dummy variables are used, a uniform distribution with a (0, 1) bound is appropriate. It can be difficult to determine which variables to distribute and which distributions to choose. Some applications only randomise the cost variable, others choose to randomise all non-price variables and leave cost as non-random (Layton, 2000; Anderson, 2003). The latter choice is favoured for two reasons: firstly, the distribution of the marginal willingness to pay (WTP) for an attribute is simply the distribution of that attribute's parameter estimate, and, secondly, it allows the cost variable to be restricted to be non-positive for all individuals (Carlsson et al., 2003).
Choice experiments
When applying a choice experiment, a number of steps must be followed. Initially, the research question must be refined through consultation with the relevant parties (Louviere et al., 2000). Focus groups are a convenient and commonly used method for gathering qualitative information on what the key public interest issues are (Morrison et al., 1997). These discussions should provide inputs to the study in respect of the most important attributes and their levels, personal characteristics that affect choice behaviour, possible reasons for differences in utility, the number of alternatives in a choice set, and also whether different decision rules are used (Louviere et al., 2000; Birol et al., 2006; Nam Do and Bennett, 2007).
The sample design strategy entails 4 distinct steps: selecting the target (sample) population, determining who to sample (the sample frame), determining the appropriate sample size, and choosing the method of respondent selection and elicitation of response technique. The target population comprises those individuals who receive benefits from, and who are subject to costs of, the effect being studied (Bateman et al., 2002). The user population for a well-defined geographical area is often easy to identify (Bateman et al., 2002), but for an estuary, for example, this identification is complicated by visitors for recreational purposes. Drawing a representative sample from the target population should ideally be preceded by a process of clarification, which entails the compilation of a sampling frame. It is defined as a complete, but finite, list of the decision makers (Louviere et al., 2000). There is a trade-off involved between the representativeness of the sampling frame and the cost involved. Frequently, there are no readily available representative lists that can be used as a sampling frame. In some cases, it is not even possible to find a sample frame that lists the entire target population (Bateman et al., 2002). If no lists exist, a sample frame cannot be specified and sampling necessarily has to be carried out directly from the sample population. An example where this would be relevant could be the population of visitors to a specific beach. In this case, people would have to be sampled on site. This type of survey is known as an intercept survey (Bateman et al., 2002). The randomness of intercept surveys is questionable as the rate and nature of visitation is likely to differ during the different times of the year, and there might be numerous entrance and exit points to the beach in question. In order to improve the randomness and representativeness of this technique, sampling may be undertaken only during certain hours of the day, and during that time the nth user is approached, as they arrive or leave (Bateman et al., 2002).
There are both probabilistic and non-probabilistic ways to determine sample size. With a probabilistic design, each unit of the population has a fixed probability of being chosen for the sample. With a non-probabilistic design, the discretion of the researcher is relied upon (Bateman et al., 2002). In the context of choice modelling (CM), probabilistic sample size approaches are very often abandoned in favour of 'rule of thumb' approaches due to practical considerations - budget and time constraints often supersede theoretical preference (Hensher et al., 2005). These approaches identify the minimum sample size that is required in order to estimate the model of choice (Hensher et al., 2005). Researchers commonly determine the minimum sample size as the number of observations needed to estimate 'robust models' (Hensher et al., 2005). If the standard CL model is applied, which uses only the attributes and their levels (as contained in the experimental design) and not the socio-economic characteristics of decision makers (non-design attributes), the variability of the data is less of an issue (Hensher et al., 2005). The variability of the collected data is even less important if the alternatives contained in the choice sets are unlabelled, since all parameters are generic across all alternatives (Hensher et al., 2005). A 'rule of thumb' that can be employed in the case where only design attributes are included in the analysis and only unlabelled alternatives are used, is that a sample size be selected of at least 50 respondents and each respondent be presented with 16 choice sets (Hensher et al., 2005).
In most cases the design of a stated preference survey instrument follows the steps laid out by Hasler et al. (2005). Firstly, provide introductory information for the study, as well as an explanation of the environmental issue being analysed. The institutional bodies charged with managing the environmental issue in question can also be identified. Secondly, set out the CE. This is done by providing detailed descriptions of the payment vehicle as well as the attributes of interest and their levels. Thirdly, provide follow-up questions, which will allow for reliability and validity testing. Lastly, collect socio-demographic information about the respondent.
In the CE survey, each alternative presented to the respondent corresponds to a different policy proposal concerning the future management of the resource in question. Each of these alternatives is characterised by differing levels of attributes (Boccara, 1989). In selecting the attributes and levels to include, the findings of other similar studies, policy relevance (Alpizar et al., 2001), as well as focus group discussions are useful (Louviere et al., 2000; Bateman et al., 2002; Birol et al., 2006; Nam Do and Bennett, 2007). Minimum and maximum levels for each attribute should be established through focus group discussions. All attributes must pass the 'independence test', i.e. they must be able to be estimated independently from each other (Eggert and Olsson, 2004). The inclusion of a monetary or cost attribute is usually relevant and has the added advantage of making it feasible to calculate monetary value trade-offs against non-money attributes.
One of the most important parts of carrying out a CE study is to identify an appropriate experimental design. Experimental design creates choice sets in the most efficient way possible. It combines attribute levels into alternatives, and alternatives into choice sets (Alpizar et al., 2001).
Once the data have been collected via the questionnaire survey, they can be captured, cleaned and analysed using appropriate statistical software.
A review of applications of the CE
The CE technique was selected as the most appropriate method to analyse choice due to its extensive use to value environmental goods and services (Adamowicz, 1995; Bennett and Adamowicz, 2001; Hanley et al., 2001; Hensher et al., 2005). It has already been extensively applied to analyse choice and inform management in wetland settings, for instance in Vietnam (Nam Do and Bennett, 2007), Sweden (Eggert and Olsson, 2004), Greece (Birol et al., 2006), England and Wales (Luisetti et al., 2008), Australia and Tasmania (Kragt and Bennett, 2009) and the USA and Canada (Smyth et al., 2009).
Nam Do and Bennett (2007) estimated wetland biodiversity values by applying a choice model to the Mekong River Delta in Vietnam. WTP values were estimated for Tram Chim National Park, one of the many wetlands found in the Delta. The survey was conducted by means of personal interviews. In total, a sample of 917 respondents was interviewed from 3 main cities in the study area. The CE utilised the multinomial logit (MNL) model and RPL model to estimate implicit prices for the proposed wetland biodiversity plan. Total benefits were estimated at US$ 3.9million. Nam Do and Bennett (2007) found that the benefits outweighed the costs of implementation, implying that social welfare would improve if more resources were allocated to the conservation of wetlands in Tram Chim.
Eggert and Olsson (2004) studied the economic benefits of improving coastal water quality in the coastal waters of the Swedish west coast. This improvement was investigated from a fishing, bathing water quality and biodiversity perspective. The sampling frame for the study was the Swedish Register of Inhabitants, and only respondents from the permanent population in the counties representing the southwest part of Sweden were randomly sampled. Questionnaires were sent out to 800 respondents via mail, of which 343 were returned, and 324 were deemed usable. The data were analysed using mixed MNL models. The calculated marginal WTP values revealed that respondents prioritised improvements in fishing stocks, and wanted increased efforts at developing a strategic management plan aimed at preventing biodiversity loss.
In Greece, a CE was applied by Birol et al. (2006) to estimate the value of changes in different social, ecological and economic functions that the Cheimaditida wetland provides to the citizens. Study results revealed that the public derived positive and significant WTP values of enjoyment from the conservation and sustainable management of this wetland.
Luisetti et al. (2004) utilised an ecosystem approach to assess managed realignment coastal policies on the east coast of England. These coastal management strategies include managed realignment projects whereby sea defences are breached and the land flooded in order to restore salt marshes in the area. The CE was used in this case as the value of salt marshes created by different managed realignments could be estimated in a single application. The project site was the Blackwater Estuary in Essex in the east of England. The key finding of the study was that site-specific value estimates derived through the use of the CE yielded results in line with other previous managed realignment cost-benefit analyses, lending support to the use of this approach for assessing future coastal management strategies.
In north-eastern Tasmania, Kragt and Bennett (2009) applied the CE method in order to address catchment management issues in the George catchment. This report attempted to assess community preferences for different proposed management scenarios aimed at improving the quality of the catchment environment. This status quo scenario implied a slow degradation in catchment conditions, whilst the other two options represented management scenarios for improved catchment conditions. It was found that Tasmanians were willing to pay for increased protection of native riverside vegetation and rare native animal and plant species in the George catchment.
Smyth et al. (2009) investigated public preferences for alternative management scenarios for Lake Champlain, situated in Vermont and New York, but also bordering on Quebec, Canada. They found that although water quality and beach closures were important management issues, the public wanted policy measures aimed at improving the safety of fish consumption.
In South Africa, a few attribute valuation studies have also been reported. Three of the four studies discussed here focused attention on the provision of water services (Hope, 2006; Kanyoka et al., 2008; Snowball et al., 2008), whereas the fourth focused on the WTP for freshwater inflows into estuaries (Olivier, 2010). Near Thohoyandou in South Africa, Hope (2006) evaluated the preferences of households in the Ha-Matiska and Lukalo rural communities with respect to various water policy interventions. The attributes chosen include (i) domestic water source, (ii) domestic water quantity, (iii) domestic water quality, (iv) failure in dry seasons, and (v) irrigation of a kitchen garden within a home compound. Results revealed that people placed a higher value on the quantity of water as opposed to the quality of water. More specifically, improving water accessibility was the most important policy intervention for improving social welfare gains. This was most notable in the case of female water collectors.
In the Limpopo Province of South Africa, Kanyoka et al. (2008) carried out a CM exercise to assess household demand for multiple use water services within the Olifants River basin. The attributes of interest included water quality, water quantity, water sources, water availability and productive uses. Personal interviews were conducted with 169 households in the Sekororo-Letsoalo area resulting in 811 observations. The study utilised the CL model to estimate implicit prices for improvements in the selected attributes. Households without private taps (Stratum 1) understandably indicated access to water to the most important determinant of choice. For those households with private taps (Stratum 2), their preference was for an improvement in productive uses.
Another study by Snowball et al. (2008) investigated household WTP for improvements in water attributes in Grahamstown, Eastern Cape, South Africa. The attributes of interest were sourced from a database of water complaints made to the Makana Municipality over the period 2004 to 2005. The most important issues (attributes) were found to be (i) bacterial count, (ii) discolouration, (iii) low water pressure, (iv) interrupted supply, (v) water meter problems, and (vi) price. Questionnaires were distributed to 100 households in the Grahamstown West area. Of these questionnaires, 71 were returned. The study found that bacteria count was the most important determinant of choice indicating the high value placed by respondents on safe, clean water.
In 2008, the WRC commissioned a study (Project K5/1413/2) to generate information on guiding the allocation of river water to South African estuaries and to investigate the factors that explain WTP for river inflows into South African estuaries (Oliver, 2010). This study applied a CE to the Bushmans River Estuary in the Eastern Cape, and compared the results with those of an application of a contingent valuation (CVM) done by Van der Westhuizen (2007). Welfare measures derived from the CE study were found to be 30% less than those derived from the CVM study (Oliver, 2010).
The conclusion drawn is that the CE method is appropriate for analysing choice to exploit the Sundays River Estuary fishery and generate values on this basis. The method has already been successfully applied in many different wetland settings and has the advantage of being able to generate multiple value estimates from a single application.
CHOICE EXPERIMENT DESIGN
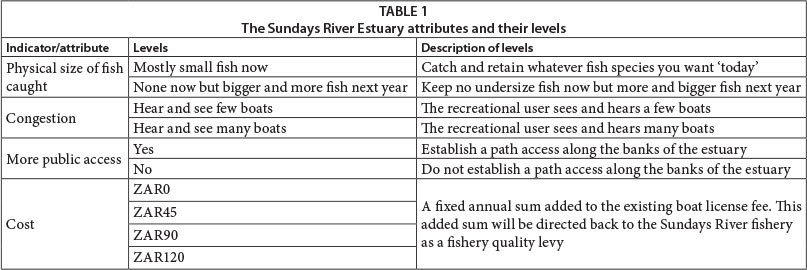
The literature advocates that the choice of attributes and their respective levels be guided through the use of focus group discussions, expert interviews and telephonic communications (Ryan et al., 2001; Hensher et al., 2005; Yacob and Shuib, 2009). As such, the design of the choice experiment in this study began with a meeting with two scientists from the Zoology department in the Faculty of Science at NMMU. These interviews helped clarify the research area, and the concerns facing the various interest groups making use of the estuary for recreational purposes. A telephonic interview was then conducted with Prof P Cowley from the Zoology Department in the Faculty of Science, Rhodes University, Grahamstown, who provided detailed information on the population of users of the Sundays River Estuary and also information regarding recreational fishing activities. Interviews followed with the Chairman of the Sundays River Joint River Forum, as well as members of the Sundays River Ratepayers Association. They were asked to list their concerns regarding the recreational use of the estuary, and to rank them in order of importance. The final attributes selected were (i) population size of fish stocks, (ii) the level of boat congestion, (iii) the level of public access to the estuary, and (iv) cost. The levels identified as relevant to these attributes are shown in Table 1.
The cost variable (price) was expressed by 4 different Rand values and was based on the added expense of an additional conservation officer (per annum remuneration). This additional conservation officer would allow more policing on the estuary to make sure that legal requirements are adhered to. The written description of the monetary attribute, or cost variable, was:
'It is assumed that the cost of providing these recreational use alternatives is partly covered by the Sundays River Estuary's fishing and boat license holders. SANParks will cover the rest of the costs. We ask you to imagine that all fishing and boat license holders will contribute equally by means of a fixed annual sum added to the existing license structure. This annual sum will then be directed back to the Sundays River Estuary. This annual sum can take four different values, namely ZAR0 (current situation), ZAR45, ZAR90 and ZAR120.'
A large number of valuation studies advocate the inclusion of a status quo or 'opt-out' alternative. Literature suggests that if one is not included, the respondent is forced to pick a scenario that is not necessarily favoured. The inclusion of a status quo or 'opt-out' option, however, is not always recommended (Qin, 2008). It can create new biases (Scarpa et al., 2004). It also provides an 'easy way out' for respondents if they want to avoid the choice task (Dhar and Simonson, 2001; Kontoleon and Yabe, 2003). It might also be impossible to include a status quo alternative if the current or base scenario is not a relevant or feasible option (Adamowicz and Boxall, 2001).
For the purposes of this study, a status quo alternative was not included. Firstly, it was difficult to define a status quo option as some of the current recreational uses pertaining to the estuary can be defined as illegal activities, for example, bag and size limits are not adhered to. Secondly, it was not necessary to include a status quo alternative as the study was aimed at guiding policy (Hasler et al., 2005).
In order to try to reduce respondent fatigue and cognitive burden, 2 alternatives per choice set were provided. A full factorial design (2 x 2 x 2 x 4 = 32) was generated using SPSS, yielding 32 different alternatives. These alternatives were randomly allocated to 32 different questionnaires. Each questionnaire contained 4 choice sets, and within each choice set the respondent had to make a choice (trade-off) between 2 alternatives. An example of a choice set is provided in Table 2.
Once the choice sets had been randomly allocated between questionnaires, the other sections of the questionnaire were developed. This design process followed the steps recommended by Hasler et al. (2005). A pilot study was conducted in order to 'fine-tune' the questionnaire.
Sample design
The target population for the data collection process was defined as all the recreational users of the Sundays River Estuary. Drawing a representative sample from the target population should ideally be preceded by a process of clarification that entails the compilation of a sampling frame, defined as a complete but finite list of all units of analysis. The importance of a properly specified sampling frame lies in its usefulness in judging the representativeness of the sample - the sample selected should be representative of the sampling frame and of sufficient size to enable significant estimates of parameters.
Devising such a sample frame proved to be an unrealis-able goal in this instance. The Sundays River Estuary sample frame should be a list of all the users and potential users of the recreational services provided by the estuary. The only list that existed, however, was one for the holders of boat licences. The use of this list was rejected for two reasons: firstly, boat license holders constitute a fraction of all the current users of the Sundays River Estuary; and secondly, a boat license is issued for several estuaries located in close proximity to each other. For example, a boat license issued for the Sundays River Estuary may also be used for the Swartkops Estuary and vice versa. Fishing and bait collecting permits cannot be used as a source of information as they are anonymously issued by the Post Office, and allow fishers and bait collectors to carry out their activities within a large coastal area. There is no official list of recreational fishers and bait collectors for the Sundays River Estuary. Other recreational activities also provided by the estuary, for example, picnicking and bird watching, are not subject to government regulation, and therefore not organised through club structures. Given the lack of an adequate sample frame for the Sundays River Estuary, the research team was forced to sample using 'knowledge' of the target population. This form of non-list sampling is the only one feasible under the circumstances. On-site sampling was required as the users of the estuary needed to be sampled whilst they were carrying out the recreational activity (Bateman et al., 2002). An intercept survey selection strategy was adopted where every nth recreational user to the estuary was approached for participation, and the overall number guided by the proportions thought to make up the true underlying population of users.
The Sundays River Estuary questionnaire was administered on-site by 4 trained interviewers during August 2010. A sample of 200 respondents is acceptable if they are offered 4 choice sets each (Bennett and Adamowicz, 2001).
Socio-economic characteristics of the sample
This study only administered 175 questionnaires; below the recommended sample size but still adequate for estimating 'robust' models (Hensher et al., 2005). Socio-economic characteristics of respondents are presented in Table 3. These were found to be broadly similar to those reported as part of the Cowley et al. (2009) study.
Most of the visitors surveyed came from areas less than 50 km away from the estuary. Most of these visitors were from Port Elizabeth (59%). Permanent residents of the estuary, living in Colchester and Cannonville, accounted for approximately 21% of the sample. The majority of recreational users surveyed were male (84%) and over the age of 35 (55%). The average annual income was ZAR184 000. Of the respondents sampled, 35% had a matriculation qualification with university exemption.
RESULTS
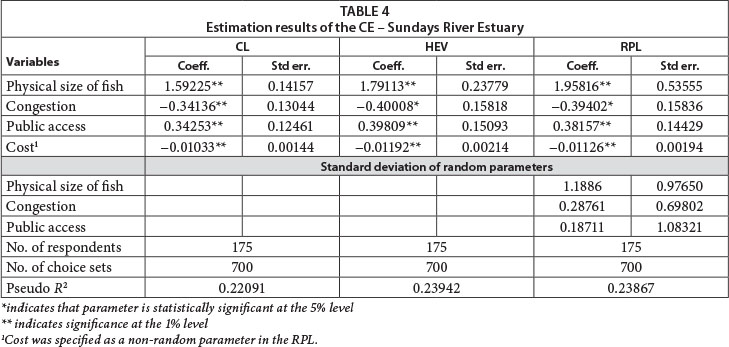
Three different choice model specifications were estimated as part of the Sundays River Estuary CE: a CL model, an HEV model and an RPL model. The LIMDEP NLOGIT Version 4.0 programme was used in all the estimations. All models estimated showed the importance of choice set attributes in explaining respondents' choices across the two different options: Option A and Option B. Two utility functions (V1-2) were derived from the models. Each function represented the utility generated by one of the two options. For the two option choice sets with four attributes, the utility functions can be expressed as follows:
Option A: VA = β1 physsizeoffish + β2Congestion + β3Publicaccess + β4CCost
Option B: VB = β1physsizeoffish + β2Congestion + β3Publicaccess + β4Cost
For these two utility functions, utility is determined by the levels of the four attributes in the choice sets. ASCs were not included in the models for two reasons: the alternatives were unlabelled and a status quo alternative was not included in the choice sets.
All the coefficients in the CL model had expected signs, a priori, and are significantly different from zero at the 99% confidence level. A variable coefficient estimated by a discrete choice model reveals the relationship between the decision makers' choice and the variable of interest. A positive (negative) coefficient shows that decision makers prefer a quantitative increase (decrease) or a qualitative improvement (deterioration) of the attribute. The probability that an alternative would be chosen was reduced the lower the physical size of the fish stock, the higher the amount of boat congestion, the lower the amount of public access available, and the higher the licence fee cost.
The fishery coefficient of the CL model can be interpreted by estimating its odds ratio, i.e., by calculating the antilog of the coefficient. Finding the antilog entails calculating the value of 10 to the power of the coefficient's value. Odds interpretation indicates how an increase (decrease) in an attribute's level would result in a change in the probability of choosing an option which includes this increase (decrease). The 'Physical size of the fish' coefficient can be interpreted as follows - an increase in the physical size of the fish stock will result in a 39.12% increase in the probability of a respondent choosing this option.
The HEV model relaxes the assumption of identically distributed random components, and allows for variance across all alternatives (Louviere et al., 2000). Like the CL model, the results of this HEV model estimation indicated that all the coefficients had the expected signs a priori. However, only 3 of the 4 coefficients are significantly different from zero at the 99% confidence level, namely the 'Physical size of the fish stock', 'Public access' and 'Cost'. The congestion coefficient is significantly different from zero at the 95% confidence level. The odds ratio calculation for the fishery coefficient in the HEV model indicated that an increase in the physical size of the fish stock would result in a 62% increase in the probability of a respondent choosing this option.
The RPL model
The RPL model goes one step further than the HEV model and relaxes the assumption of homogenous preferences across respondents. In the RPL model, recreational attribute parameters were treated as random variables, but not the cost variable. In this case, a normal distribution was selected for all the random parameters. The cost variable was specified as fixed, and non-randomly distributed, because the distribution of the marginal WTP for an attribute is simply the distribution of that attribute's coefficient. The RPL model estimates revealed little unexplained heterogeneity in respondent preferences. All of the standard deviation coefficients were statistically insignificant, indicating statistically similar preferences for these attributes across respondents. It was deduced that the recreational users of the Sundays River Estuary were a fairly homogenous group in terms of their preferences. Most of the recreational users surveyed at the Sundays River Estuary were fishers and preferred to fish from boats.
Estimation of WTP values
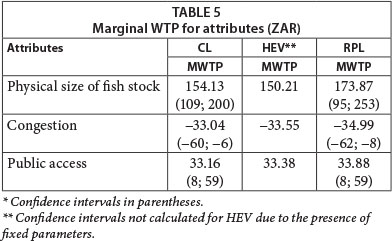
The coefficients from the three models were also used to calculate implicit prices. Implicit prices are calculated by determining the marginal rates of substitution between the attributes, using the coefficient for cost as the 'numeraire' (Hanemann, 1984). The ratios of the attribute in question to the cost coefficient can be interpreted as the marginal WTP for a change in each of the attribute values (Hanemann, 1984). The marginal WTP value represents a change from one attribute level to another. In the case of the Sundays River Estuary, these marginal WTP values represent: a change from catching small fish now to catching bigger and more fish next year, a change from seeing and hearing few boats to seeing and hearing many boats, and a change from limited recreational appeal to an improvement in the recreational appeal of estuary banks. Table 5 reports the implicit prices, or marginal WTP, for each of the Sundays River Estuary's recreational attributes estimated using the Delta method (Wald procedure) in LIMDEP NLOGIT Version 4.0 (Greene, 2007). The Wald procedure automates the process of estimating standard errors for non-linear functions, such as marginal rates of substitution (Suh, 2001). For comparisons, estimates were calculated using all three models.
The differences in WTP among the three models are small, with the exception of the RPL estimate for 'Physical size of fish stock'. The respective marginal WTP value for the RPL model is ZAR173.87. This estimate is higher than those calculated for the CL and HEV models (ZAR154.13 and ZAR150.21, respectively).
CONCLUSIONS
The stocks of the fish targeted by recreational users in the Sundays River Estuary are over-exploited and face potential collapse. Most fishery management initiatives aim at controlling fishing effort levels through restricting access, implementing catch limits, and using transferable catch quotas. These initiatives relate to the management of a commercial fishery and not a recreational one. Management options are limited in the case of a recreational fishery. Licence fees are an obvious and arguably attractive choice for managing and limiting excessive demand. The application of the CE method has revealed that recreational boat fishers are willing to pay an additional ZAR174 per annum in order to reduce fishing effort levels, using an RPL model as the basis to estimate the trade-off - the new boat license fee (a required management intervention) would now equal ZAR268 per annum (i.e. the existing fee (ZAR94) plus the increase (ZAR174)). It is believed that this increase would serve as a disincentive to some fishers but not to all, which would hopefully reduce fishing effort to some extent. An anonymous reviewer pointed out that this may not be the only solution to this problem and that a more coordinated, holistic approach is required. An increase in licence fee would, however, constitute a suitable benchmark from which to start this campaign. To this end, it would seem worthwhile to:
• Increase effort to enforce existing catch and bag limits.
• Put more effort into improving public awareness of the serious sustainability challenges facing the Sundays River Estuary fishery.
ACKNOWLEDGEMENTS
We gratefully acknowledge the Water Research Commission's financial support. We would also like to thank the members of the reference group for valuable comments, insights and suggestions. This study formed part of a bigger research initiative under the auspices of the Water Research Commission of South Africa. The research initiative is entitled 'The application of choice modelling techniques to guide the management of estuaries in South Africa - case studies of the Kromme, Nahoon, Sundays and Gonubie Estuaries' (WRC Project No. K5/1924).
We would also like to thank an anonymous reviewer from Economic Research South Africa (ERSA) for valuable feedback, which resulted in a financial contribution from the publication of an ERSA working paper.
REFERENCES
ABELSON RP and LEVY A (1985) Decision making and decision theory. In: Lindzey G and Aronsom E (eds.) Handbook of Social Psychology 1. Random House, New York. [ Links ]
ADAMOWICZ W (1995) Alternative valuation techniques: A comparison and movement to a synthesis. In: Willis KG and Corkindale JT (eds.) Environmental Valuation: New Perspectives. Cab International, New York. 144-159. [ Links ]
ADAMOWICZ W and BOXALL P (2001) Future directions of stated choice methods for environment valuation. Paper presented at: Choice Experiments: A New Approach to Environmental Valuation, 10 April 2001, London, England. [ Links ]
ALPIZAR F, CARLSSON F and MARTINSSON P (2001) Using choice experiments for non-market valuation. Department of Economics Working Papers in Economics Series, No. 52. Goteborg University, Goteborg. [ Links ]
ANDERSON CM (2003) Policy implication of alternative econometric approaches to population heterogeneity in stated preference surveys. Paper presented at: The Annual Meeting of the American Agricultural Economics Association, 28-31 July, Montreal, Quebec, Canada. [ Links ]
BATEMAN IJ, CARSON RT, DAY B, HANEMANN M, HANLEY N, HETT T, JONES-LEE M, LOOMES G, MAURATO S, OZDEMIROGLU E, PEARCE DW, SUGDEN R and SWANSON J (2002) Economic Valuation with Stated Preference Techniques. A Manual. Edward Elgar Publishing, Cheltenham, UK. [ Links ]
BEN-AKIVA M, McFADDEN D, GARLING T, GOPINATH D, WALKER J, BOLDUC DA, BORSCH-SUPAN A, DELQUIE P, LARICHEV O, MORIKAWA T, POLYDOROPOULOU A and RAO V (1999) Extended framework for modelling choice behaviour. Marketing Lett. 10 187-203. [ Links ]
BEN-AKIVA M and LERMAN S (1985) Discrete Choice Analysis: Theory and Application to Travel Demand. MIT Press, Cambridge, US. [ Links ]
BENNETT J and ADAMOWICZ W (2001) Some fundamentals of environmental choice modelling. In: Bennett J and Blamey RK (eds.) The Choice Modelling Approach to Environmental Valuation. Edward Elgar Publishing, Cheltenham. 37-69. [ Links ]
BHAT CR (1995) A heteroskedastic extreme value model of intercity travel mode choice. Transport. Res. B 29 471-483. [ Links ]
BHAT CR (1997) Accommodating flexible substitution patterns in multi-dimensional choice modeling: formulation and application to travel mode and departure time choice. Transport. Res. B 32 455-466. [ Links ]
BHAT CR (2000) Flexible model structures for discrete choice analysis. In: Hensher DA and Button KJ (eds.) Handbook of Transport Modelling, Vol. 1: Handbooks in Transport. Pergamon Press, Oxford. 71-90. [ Links ]
BHAT CR (2001) Quasi-random maximum simulated likelihood estimation of the mixed multinomial logit model. Transport. Res. B 35 677-695. [ Links ]
BIROL E, KAROUSAKIS K and KOUNDOURI P (2006) Using a choice experiment to account for preference heterogeneity in wetland attributes: the case of Cheimaditida wetland in Greece. Ecol. Econ. 60 145-156. [ Links ]
BOCCARA B (1989) Modeling choice set formation in discrete choice models. Doctoral thesis, Massachusetts Institute of Technology, Cambridge, US. [ Links ]
CARLSSON F, FRYKBLOM P and LILJENSTOLPE C-J (2003) Valuing wetland attributes: an application of choice experiments. Ecol. Econ. 47 95-103. [ Links ]
COWLEY PD, CHILDS A-R and BENNETT RH (2009) A survey of fishery resource utilisation and recreational activities on the Sundays Estuary, with implications for management. World Wildlife Fund - South Africa Report. South African Institute for Aquatic Biodiversity, Grahamstown, South Africa. [ Links ]
DAY JH (1980) What is an estuary? S. Afr. J. Sci. 76 198. [ Links ]
DHAR R and SIMONSON I (2001) The effect of forced choice on choice. Working Paper in Economics. Yale University, US. [ Links ]
ENGEL JF, BLACKWELL RD and MINIARD PW (1995) Consumer Behaviour (8th edn.). The Dryden Press, New York. [ Links ]
EGGERT H and OLSSON B (2004) Heterogenous preferences for marine amenities: A choice experiment applied to water quality. Department of Economics Working Papers in Economics Series, No.126. Goteborg University, Goteborg, Germany. [ Links ]
GOPINATH DA (1995) Modelling heterogeneity in discrete choice processes: application to travel demand. Doctoral thesis, Massachusetts Institute of Technology, Cambridge, US. [ Links ]
GREENE WH (2007) NLOGIT: Version 4.0, User Manual. Econometric Software, Inc, New York. [ Links ]
GRIFFITHS MH (1997) Management of the South African dusky kob Argyrosomus .aponicas (Sciaenidae) based on per-recruit models. S. Afr. J. Mar. Sci. 18 213-228. [ Links ]
HANEMANN WM (1984) Discrete/continuous models of consumer demand. Econometrica 52 541-561. [ Links ]
HANLEY ND, MOURATO S and WRIGHT RE (2001) Choice modelling approaches: A superior alternative for environmental valuation? J. Econ. Surv. 15 435-462. [ Links ]
HANLEY N, BERGMANN A and WRIGHT R (2004) Valuing the attributes of renewable energy investments in Scotland. University of Stirling, Stirling, UK. [ Links ]
HASLER B, LUNDHEDE T, MARTINSEN L, NEVE S and SCHOU SJ (2005) Valuation of groundwater protection versus water treatment in Denmark by choice experiments and contingent valuation. URL: http://technical-reports.dmu.dk (Accessed February 2010). [ Links ]
HAY D, HOSKING SG and MCKENZIE M (2008) Estuaries, economics and freshwater: An introduction. WRC Report No. TT 470/10. Water Research Commission, Pretoria, South Africa. [ Links ]
HENSHER D and GREENE WH (2002) The mixed logit model: The state of practice and warnings for the unwary. Institute of Transportation Studies Working Paper, No. 01-02. University of Sydney, Sydney, Australia. [ Links ]
HENSHER D, ROSE JM and GREENE WH (2005) Applied Choice Analysis: A Primer. Cambridge University Press, Cambridge, UK. [ Links ]
HOPE RA (2006) Evaluating water policy scenarios against the priorities of the rural poor. World Dev. 34 (1) 167-179. [ Links ]
IECM (UNIT FOR INTEGRATED ENVIRONMENTAL AND COASTAL MANAGEMENT) (2010) Regional Estuarine Management Programme: Sundays River management plan. Nelson Mandela Metropolitan University, Port Elizabeth, South Africa. [ Links ]
HOWARD JA and SHETH JN (1969) The Theory of Buyer Behaviour. Wiley and Sons Publishing, New York. [ Links ]
KANYOKA P, FAROLFI S and MORARDET S (2008) Households' preferences and willingness to pay for multiple use water services in rural areas of South Africa: an analysis based on choice modelling. Water SA 34 (6) 715-723. [ Links ]
KRAGT ME and BENNETT JW (2008) Developing a questionnaire for valuing changes in natural resource management in the George catchment, Tasmania. Environmental Economics Research Hub Research Report No. 8. Australian National University, Canberra, Australia. [ Links ]
KRAGT ME and BENNETT JW (2009) Using choice experiments to value river and estuary health in Tasmania with individual preference heterogeneity. Environmental Economics Research Hub Research Report No. 0916. Australian National University, Canberra, Australia. [ Links ]
KONTOLEON A and YABE M (2003) Assessing the impacts of alternative 'opt-out' formats in choice experiment studies: Consumer preferences for genetically modified content and production information in food. J. Agric. Polic. Res. 5 1-43. [ Links ]
LANCASTER K (1966) A new approach to consumer theory. J. Politic. Econ. 74 132-157. [ Links ]
LAYTON D (2000) Random coefficient models for stated preference surveys. J. Environ. Econ. Manage. 40 21-36. [ Links ]
LOUVIERRE JJ, HENSHER DA and SWAIT JD (2000) Stated Choice Methods: Analysis and Application. Cambridge University Press, Cambridge, US. [ Links ]
LUCE D (1959) Individual Choice Behaviour. Wiley and Sons Publishing, New York. [ Links ]
LUISETTI T, TURNER K and BATEMAN I (2008) An ecosystem services approach to assess managed realignment coastal policy in England. Working Paper ECM - 0804. CSERGE, London, UK. [ Links ]
MACKAY HM and SCHUMANN EH (1990) Mixing and circulation in the Sundays River Estuary, South Africa. Estuar. Coast. Shelf Sci. 31 203 -216. [ Links ]
MACDONALD DH, BARNES M, BENNETT J, MORRISON M and YOUNG MD (2005) Using a choice modelling approach for customer services standards in urban water. J. Am. Water Resour. Assoc. 41 719-728. [ Links ]
McFADDEN D (1974) Conditional logit analysis of qualitative choice behaviour. In: Zarembka P (ed.) Frontiers in Econometrics. Academic Press, New York. 105-142. [ Links ]
McFADDEN D (1984) Econometric analysis of qualitative response models. In: Griliches Z and Intriligator MD (eds.) Handbook of Econometrics II. Elsevier Science Publishers, New York. 1395-1457. [ Links ]
McFADDEN D and TRAIN K (2000) Mixed MNL models for discrete response. J. Appl. Econom. 15 447-470. [ Links ]
MORRISON MD, BENNETT JW and BLAMEY RK (1997) Designing choice modelling questionnaire using focus groups: results from the Macquarie marshes and Gwydir wetlands case studies. Choice Modelling Research Report No. 5. The University of New South Wales, Sydney, Australia. [ Links ]
NAM DO NT and BENNETT J (2007) Estimating wetland biodiversity values: A choice modelling application in Vietnam's Mekong River Delta. Economics and Environmental Network Working Paper No. EEN0704. The Australian National University, Canberra, Australia. [ Links ]
OLIVER C (2010) Comparing a contingent valuation of the river inflows into the Bushmans estuary with a choice experiment valuation. MSc dissertation, Nelson Mandela Metropolitan University, Port Elizabeth, South Africa. [ Links ]
POTGIETER MJ (2008) Water, salt and nutrient budgets of the Swartkops and Sundays River estuaries using the loicz biogeochemical budgeting protocol. MSc dissertation, Nelson Mandela Metropolitan University, Port Elizabeth, South Africa. [ Links ]
QIN P (2008) Forestland reform in China: what do the farmers want? A choice experiment on farmers' property rights preferences. Environment for Development Discussion Paper No. 08-35. Beijing, China. [ Links ]
REVELT D and TRAIN K (1998) Mixed logit with repeated choices: Households' choice of appliance efficiency level. Rev. Econ. Stat. 80 647-657. [ Links ]
RYAN M, BATE A, EASTMOND CJ and LUDBROOK A (2001) Use of discrete choice experiments to elicit preferences. Qual. Health Care 10 i55-i60. [ Links ]
SCARPA R, WILLIS KG, ACUTT M and FERRINI S (2004) Monte Carlo simulation evidence on the effect of the status-quo in choice experiment models for water supply. Paper presented at: The 13th Annual European Association of Environmental and Resource Economists, June 2004, Budapest, Hungary. [ Links ]
SMYTH RL, WATZIN MC and MANNING RE (2009) Investigating stakeholder preferences for managing Lake Champlain using a choice experiment. J. Environ. Manage. 90 615-623. [ Links ]
SNOWBALL JD, WILLIS KG and JEURISSEN C (2008) Willingness to pay for water service improvements in middle-income urban households in South Africa: a stated choice analysis. S. Afr. J. Econ. 76 (4) 705-720. [ Links ]
SUH J (2001) An economic evaluation of environmental recovery of the skier-dominated area in the Mount Togyu National Park in South Korea. PhD thesis, University of Queensland, Brisbane, Australia. [ Links ]
VAN DER WESTHUIZEN H (2007) Valuing preferences for freshwater inflows into the Bira, Bushmans, Kasouga, Keiskamma, Kleinemond East, Nahoon and Tyolomqa estuaries. MCom Dissertation, Nelson Mandela Metropolitan University, Port Elizabeth, South Africa. [ Links ]
WOOLDRIDGE TH (2010) Personal communication, 14 May 2010. Prof Tris Wooldridge, Nelson Mandela Metropolitan University, Port Elizabeth, South Africa. [ Links ]
YACOB MR and SHUIB A (2009) Assessing the preference heterogeneity in marine ecotourism attributes by using choice experiments. Int. J. Econ. Manage. 3 367-384. [ Links ]
 Correspondence:
DE Lee
+27 41 504 2206
e-mail: deborah.lee@nmmu.ac.za
Received 7 January 2013
accepted in revised form 2 December 2013

