


Services on Demand
Article
 English (pdf)
 Article in xml format
 Article references
Indicators

Related links
-
 Cited by Google
 -
 Similars in Google
Share

 Permalink
Water SA
On-line version ISSN 1816-7950
Print version ISSN 0378-4738
Water SA vol.40 n.1 Pretoria Jan. 2014
The impact of smallholder irrigation on household welfare: The case of Tugela Ferry irrigation scheme in KwaZulu-Natal, South Africa
Sikhulumile Sinyolo; Maxwell Mudhara; Edilegnaw Wale
Discipline of Agricultural Economics, University of KwaZulu-Natal, Private Bag X01, Pietermaritzburg, 3209, South Africa
ABSTRACT
The potential of smallholder irrigated agriculture to enhance food security and alleviate rural poverty has led the South African Government to prioritise and invest significantly in irrigation establishment, rehabilitation and revitalisation. The question addressed in this study pertains to the extent to which smallholder irrigation has been able to reduce poverty in the rural communities to justify this investment. Using a sample of 251 farmers, this study found that factors such as land size, perceived soil fertility, household size, and access to support services were significant predictors of irrigation participation. The results from the treatment effect model indicated that access to irrigation plays a positive role in the welfare of rural households, with irrigators spending about ZAR2 000 per adult equivalent on consumption more than the non-irrigators. The study, therefore, concluded that government investments in smallholder irrigation for poverty reduction are justified. The other factors that influenced household consumption were off-farm income, land size, livestock size, education level, family size and access to support services and infrastructure. The study recommends that investments in smallholder irrigation continue for poverty reduction, and that priority should also be on finding other feasible rural micro-projects and development initiatives to complement smallholder irrigation and significantly reduce rural poverty.
Keywords: smallholder irrigation, poverty, food security, treatment effect model, Foster Greer Thorbecke (FGT) poverty measures
INTRODUCTION
Poverty reduction and ensuring household food security are important policy goals in developing countries, particularly in sub-Saharan Africa. Several authors agree that reaching the Millennium Development Goal (MDG) of halving poverty and hunger by 2015 in this region requires giving high priority to smallholder agriculture (Smith, 2004; Matshe, 2009; Tshuma, 2012). A general consensus is that smallholder irrigation remains a feasible and key strategy for achieving improved agricultural production, household food security and rural poverty reduction in the developing world (Kumar, 2003; Lipton et al., 2003; Hussain and Hanjra, 2004; Gebregziabher et al., 2009; Bacha et al., 2011). Although irrigation development comes at a cost, and may have negative environmental and health consequences such as increased water logging, saliniza-tion and water-borne diseases, it is one of the most important factors in increasing crop productivity and improving overall agricultural performance (Hussain and Wijerathna, 2004).
Access to irrigation increases the area under cultivation and crop intensity, and decreases crop losses (Namara et al., 2010). Moreover, it leads to poverty reduction by expanding opportunities for higher and more stable incomes, and by increasing prospects for multiple cropping and crop diversification (Hussain and Wijerathna, 2004). The potential of irrigated agriculture in enhancing food security and alleviating poverty has led the South African Government to prioritise irrigation development (Denison and Manona, 2007; Van Averbeke et al., 2011). The establishment, rehabilitation and revitalisation of smallholder irrigation schemes were made possible through the investment of large amounts of public resources (Denison and Manona, 2007). Shah et al. (2002) estimated the public investments in smallholder irrigation at ZAR2 billion (ZAR40 000/ ha). In fact, smallholder irrigation schemes continue to be a major budget item on many developmental and district municipality financial plans (Denison and Manona, 2007).
Irrigation farming is imperative in South Africa as rain-fed crop production is inherently risky due to unreliable rainfall and frequent droughts (Cousins, 2012). South Africa is generally dry, with over 60% of the country receiving less than 500 mm of rain per annum on average, and with only 10% receiving more than 750 mm (World Bank 1994 cited in Cousins, 2012). The importance of irrigation farming in South Africa is underscored by the fact that the irrigated 8% of land under crop production contributes almost 30% of total agricultural production (Backeberg, 2006; NDA, 2007; Hope et al., 2008). Smallholder irrigation accounts for about 0.1 million hectares (about 8%) of total irrigated land in South Africa (Tlou et al., 2006; NDA, 2007; Van Averbeke et al., 2011).
Although smallholder irrigation accounts for a small proportion of irrigated area in South Africa, it is important and has generated national public interest in recent years (Denison and Manona, 2007). The importance arises primarily from its location in the rural areas, where poverty and food insecurity are concentrated (Perret, 2002; Sishuta, 2005; Vink and Van Rooyen, 2009). Poverty alleviation and ensuring household food security in rural areas are major objectives for the establishment of smallholder irrigation in South Africa (Denison and Manona, 2007). Furthermore, smallholder irrigation has the potential to create employment in these underdeveloped rural areas, both directly and indirectly through forward and backward linkages (Van Averbeke et al., 2011).
However, many researchers have reported that, despite its potential, smallholder irrigation has failed to meet the rural development and poverty reduction objectives in South Africa (Bembridge, 2000; Perret, 2002; Hope et al., 2008; Speelman, 2009; Yokwe, 2009; Fanadzo, 2012; Van Averbeke, 2012). According to Bembridge (2000), the performance and welfare impact of smallholder irrigation schemes has been poor, and falls far short of the expectations of many stakeholders. Infrastructure deficiencies and poor institutional support have been cited as the major reasons for the failure of smallholder irrigation in South Africa (Machethe et al., 2004; Tlou et al., 2006; Van Averbeke et al., 2011; Fanadzo, 2012). However, this claim of failure has not been based on in-depth and systematic impact evaluations.
Most of the previous studies on the impact of smallholder irrigation schemes in South Africa (Hope et al., 2008; Fanadzo et al., 2010; Van Averbeke, 2012) have been descriptive in nature and have not included any systematic quantitative evaluations. For example, Van Averbeke (2012) used observations of cropping intensity as a performance and/or impact indicator, while Hope et al. (2008) relied on gross margin analysis. Although these evaluations are relevant and make up an important part of the measurements of poverty impacts of smallholder irrigation, they are not complete, as they do not evaluate direct irrigation impact on household welfare. This study aimed, therefore, to provide empirical evidence and systematic quantitative analysis of the impact of smallholder irrigation on household welfare using the Tugela Ferry irrigation scheme as an empirical example. The study was undertaken as part of a project (K5/2176) initiated, managed and funded by the Water Research Commission (WRC) entitled, 'Empowerment of women in rural areas through water use security and agricultural skills training for gender equity and poverty reduction in KwaZulu-Natal Province'.
METHODS
Study area description
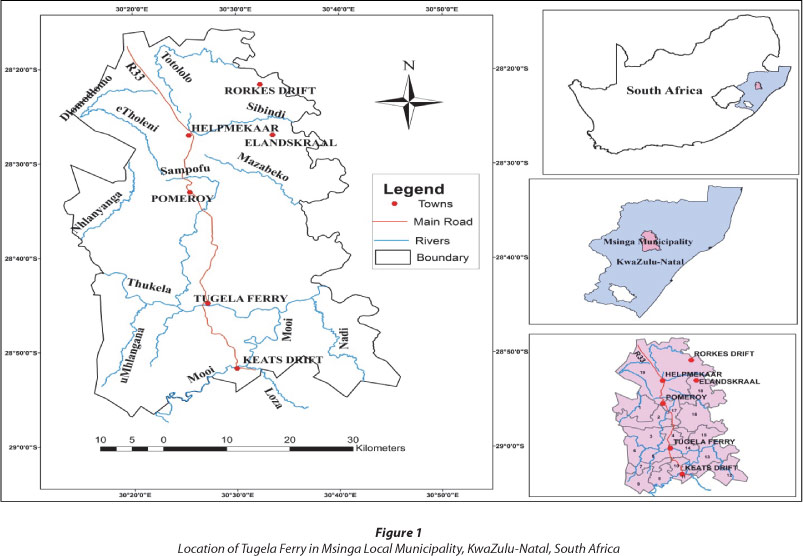
The Tugela Ferry irrigation scheme is located in Msinga Local Municipality in the Mzinyathi District in the KwaZulu-Natal Province of South Africa. It is situated 120 km north of Pietermaritzburg, the provincial capital. Figure 1 shows the location of the Tugela Ferry area in the Msinga local municipality. The location of the Msinga Local Municipality in South Africa and in the KwaZulu-Natal Province is also shown on the maps.
Msinga is characterised by high poverty levels as it has few economic resources and little economic activity (Dearlove, 2007). Moreover, the area is characterised by high unemployment rates leading many of its inhabitants to be involved in subsistence and informal activities. Almost half of the households earn less than ZAR800 per month (Dearlove, 2007). Subsistence agriculture plays a significant role in the welfare of the poor in the area, and it is mainly practised in areas adjacent to the Tugela and Mooi rivers.
Rain-fed crop production is challenging in Msinga because the area is both hot and dry. Msinga is situated in a dry to semi-arid zone with mean rainfall of 600-700 mm/a and very high summer temperatures of up to 44°C (Cousins, 2012). The area is characterised by frequent droughts, making irrigation the main mode of household food production (Cousins, 2012). Irrigation farming, therefore, offers many of the rural people an opportunity to increase their incomes and participate in the local economy. The Tugela Ferry and Mooi irrigation schemes play an important role in the local economy of Msinga as sources of food, employment and market for agricultural inputs.
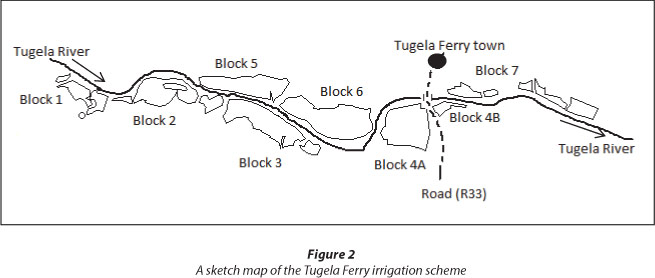
The Tugela Ferry irrigation scheme is located on both banks of the Tugela River. Figure 2 shows a sketch map of the Tugela Ferry irrigation scheme. The scheme was planned and constructed by the Natal Native Trust between 1898 and 1902 to improve household welfare, and has been operational ever since (Cousins, 2012). It consists of 7 blocks of irrigable land covering 837 ha, of which approximately 540 ha is flood-irrigated, and is one of the largest smallholder irrigation schemes in the province (Cousins, 2012; Fanadzo, 2012). Water is drawn from the Tugela River in several ways. A canal of 31 km is used to draw water under gravity for Blocks 1-3 and 5; while a diesel pump is used for Block 4B and electric pumps for Blocks 4A and 7. Initially, all the blocks got water from the main canal, but water shortages have meant that only 4 blocks benefit from the gravity-fed canal while other blocks use pumps. The initial canal infrastructure has deteriorated such that it is difficult to supply the four gravity-fed blocks. Irrigators take turns in diverting irrigation water to their plots at least once per week.
A total of about 1 500 irrigators participate in the irrigation scheme growing various crops such as maize, cabbage, potatoes, tomatoes, onions, beans, beetroot, spinach and butternut. The land in the scheme is owned by 3 tribal authorities (Mthembu: Block 1-5; Mabaso: 7A; and Bomvu: 7B). The ownership of Block 6 is uncertain, and it is currently not operating due to tribal conflicts regarding ownership. Farmers in the irrigation scheme were initially allocated 2 plots of 0.1 ha each. Over time, some farmers have managed to acquire more plots through leasing or borrowing from neighbours. The access to land is through the tribal authorities, who allocate land to households. Selling of land is not permissible and land is returned to the tribal authority for re-allocation if the owner is no longer using it.
Sampling techniques and data collection tools
Data were collected over a period of 3 weeks in November 2012 by trained enumerators who were Zulu speaking, the local language. A stratified random sampling technique was used to select the survey respondents. Households were categorised into 2 strata: irrigation participants and non-participants. A list of the irrigation farmers was obtained from extension officers, and farmers were further stratified according to their blocks on the scheme. From these sub-strata, a simple random sample was drawn to obtain 186 irrigating farmers such that every block was represented by at least 10% in the final sample of irrigators. A sample of 186 irrigating households was considered appropriate as it represents above 10% of the 1 500 irrigating farmers in the Tugela Ferry irrigation scheme. There was no list for non-irrigators, therefore, the non-irrigators that were interviewed were identified during the survey. A sample of 70 non-irrigators was selected and interviewed to serve as a proxy for the control or counterfactual group. Since the population is relatively homogenous, this sample size was considered large enough to provide a reliable counterfactual.
Primary data were collected using structured questionnaires and focus group discussions. Questionnaires were pre-tested and modified accordingly before being administered. Information on basic characteristics of household heads such as sex, age, marital status and education level was collected using the questionnaire. The questionnaire also included measures of household wealth such as household assets, livestock, and type of houses; agricultural production activities; and household expenditure, income amounts and sources. The same questionnaire was used for both irrigators and non-irrigators, but with extra sections to cover specific questions related to the irrigation activities. The approach adopted in the survey is in line with Jalan and Ravallion (2003), who suggested that in project impact evaluations it is important that the same questionnaire be administered to both groups, and that project participants and non-participants are from the same economic environment.
Analytical methods
The study employed both descriptive and econometric techniques. Descriptive analysis was performed using the t-test for continuous variables and χ2 test for categorical variables. The Foster Greer Thorbecke (FGT) poverty indices were also used to give a summary of the incidence, depth and severity of poverty in the study area. Econometric analysis employed the treatment procedure to identify the impact of smallholder irrigation on household welfare from among other possible factors influencing household welfare. Propensity score matching (PSM) was used as a robust check on the results of the treatment effect regression model.
The Foster, Greer and Thorbecke (FGT) poverty indices
The Foster, Greer and Thorbecke (FGT) poverty measures were calculated to examine the incidence, depth and severity of poverty among irrigators and non-irrigators as below:

where:
Pa is the FGT poverty index
n is the number of sample households
Yi. is consumption expenditure per adult equivalent of the ith household
z represents the cut-off poverty line
q is the number of households below the poverty line
α is the poverty aversion parameter which takes a value of 0, 1, or 2.
The poverty aversion parameter is a non-negative parameter indicating the degree of sensitivity of the poverty measure to inequality among the poor. The incidence of poverty (head-count index), estimated when α = 0, measures the share of the population below the poverty line. The poverty depth index (poverty gap), estimated when α = 1, captures information regarding how far off households are from the poverty line. The poverty severity index (poverty gap square), estimated when α = 2, takes into account not only the distance separating the poor from the poverty line (the poverty gap), but also the inequality among the poor.
A larger α value gives greater emphasis to the poorest of the poor, indicating greater sensitivity of the poverty measure to inequality among the poor (Foster et al., 1984; Namara et al., 2008). It is also important to highlight that z-Yi takes the value of zero when Yi>z in the above equation. The FGT poverty measures were calculated using Distributive Analysis Stata Package (DASP) version 2.2, an ado Stata file created by Araar and Duclos (2012). Based on the minimum per capita adult-equivalent caloric intake (at 2 261 kcal.day) (Frye, 2005; Stats SA, 2007), a figure of ZAR5 277 per adult equivalent per annum was used as the poverty line. This figure was taken from that reported by Stats SA (2007), and then adjusted using the consumer price index (CPI) so that it reflects the current purchasing power of the Rand (ZAR). The adult equivalents were calculated using the scales recommended by Smith and Subandoro (2007), which take age and gender into consideration to adjust household sizes to reflect their energy requirements.
The treatment effect model
The major econometric problem in evaluating project impacts is selection bias (Maddala, 1983). Smallholder irrigation usually purposively targets the poor, who are presumably more likely to be poor without access to irrigation (Baker, 2000). Therefore, it is expected that irrigation participants would have had far less consumption expenditure in the absence of the irrigation project (Baker, 2000), and sample selection bias arises due to this self-selection. Using OLS to estimate the impact of irrigation participation on household welfare when there is selection bias produces biased and inconsistent estimates (Heckman, 1979). The welfare difference between irrigators and non-irrigators, therefore, cannot be attributed to access to irrigation so long as selection bias exists (Bacha et al., 2011).
Heckman (1979)'s basic model of selectivity has been widely applied in evaluating programme benefits (or treatment effects) (Maddala, 1983; Greene, 2003). The model corrects for the selection bias that arises from unobservable factors by estimating 2 equations: the selection (participation) equation and the response (outcome) equation. The discussion of the treatment effect model below derives from mainly Heckman (1979), Maddala (1983) and Greene (2003). Interested readers may consult these texts for further details.
The irrigation participation equation, estimated using the probit model, assumes that irrigation participation is a linear function of the exogenous covariates (zi) and the residual error ui. Specifically, the irrigation participation model is specified as follows:

where:
P* is the latent endogenous variable such that Pi takes a value of 1 when P*i is greater than zero
zi is a vector of household characteristics that influence household's access to irrigation
γ are the coefficients to be estimated ui is the residual term
The participation equation is used to generate a selection variable (inverse Mills ratio) which, when included in the OLS model, makes the estimates unbiased and consistent. The second stage of the treatment effect regression procedure involves adding the inverse Mills ratio to the response equation and estimating the equation using OLS as follows:

where:
Yi is total household consumption expenditure per adult equivalent
xi is a vector of household characteristics Ri. indicates whether a household is an irrigation beneficiary or non-beneficiary λi. is the inverse Mills ratio εi. is the error term
β and δ are parameters that are to be estimated.
Yi was a continuous variable measuring total household food and non-food expenses incurred by households in a year. The food items produced and consumed by the household were converted to their market values using average local prices.
Although the impact coefficient δ in Eq. (3) is unbiased due to the inclusion of the selectivity term, it is inefficient as the disturbance term εi. is heteroscedastic (Greene, 2003). However, the Stata software package, which was used in this study, automatically corrects for that bias in standard errors. An assumption required to guarantee reliable estimates of the outcome equation is the existence of at least one additional regressor (with a non-zero coefficient) in the selection equation which has no direct effect on the outcome (Blundell and Costa-Dias, 2000; Heckman and Vytlacil, 2005). Including the same number of variables in the selection and outcome equations would lead to the multicollinearity problem in the outcome equation which results in very imprecise estimates (Sartori, 2003). Therefore, the consumption expenditure equation included one variable less than the irrigation participation equation for model identification purposes.
In terms of the estimation procedure, both the 2-step estimator (described above) and maximum likelihood have been used (Maddala, 1983). Compared to the maximum likelihood method, 2-step estimation procedure is less efficient (Puhani, 2000). The full information maximum likelihood estimation procedure, therefore, was reported in this study. The next section presents the empirical results and their discussions.
RESULTS AND DISCUSSION
The results of data analysis are presented in the following sections. The next section presents descriptive statistics from both t-tests and X2-square tests. The results from FGT poverty analysis are then presented, followed by the results from the econometric model.
Descriptive statistics
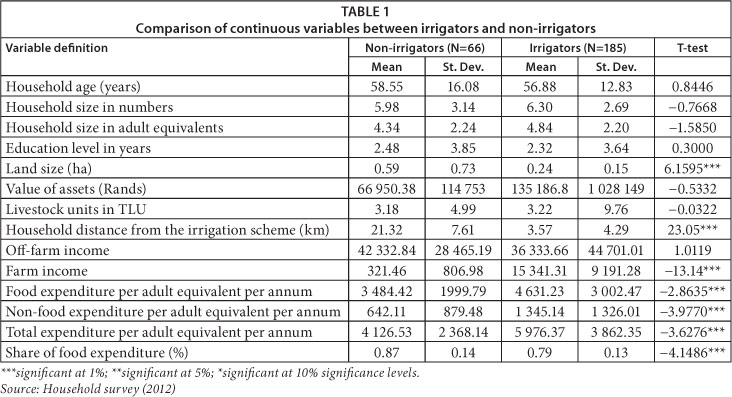
The total sample size was 256, comprising of 70 non-irrigators and 186 irrigators. However, 5 households were discarded in the final sample for analysis due to missing information. The results of descriptive analyses are presented in Tables 1 and 2. Table 1 presents the results for the continuous variables while Table 2 presents the results for the categorical variables.
The t-test results, presented in Table 1, suggest for both groups an ageing farmer population, with the much younger generation moving to more lucrative and higher paying ventures in the non-farm sectors. Discussions with the farmers indicated that the youths were shunning the agricultural sector because it pays less compared to other sectors. Although there was no significant difference between the educational level of irrigators and non-irrigators, discussions with the farmers indicated that more household members of irrigators were educated compared to non-irrigators. This result, consistent with Tesfaye et al. (2008), suggests that money from irrigation is also being invested in services such as education for children.
The results show small land holdings for irrigators compared to non-irrigators implying that the intensive nature of irrigation farming is such that irrigators have to operate less land, while the non-irrigators need to put more land under cultivation to cater for the extensive and risky nature of dry-land farming. Compared to non-irrigators, the irrigators can achieve a given welfare level from a smaller land area as irrigation access enhances land productivity, ceteris paribus. Irrigators had far higher farm income compared to non-irrigators. This significant difference indicates how the climatic conditions hinder rain-fed crop production in the study area, and the farm income of non-irrigators is mainly from livestock production. Farming contributes modestly to the total household incomes in the area, contributing only about 15%. This percentage is less but close to the 18% reported by Dearlove (2007) as contribution of farming to income in the Msinga area.
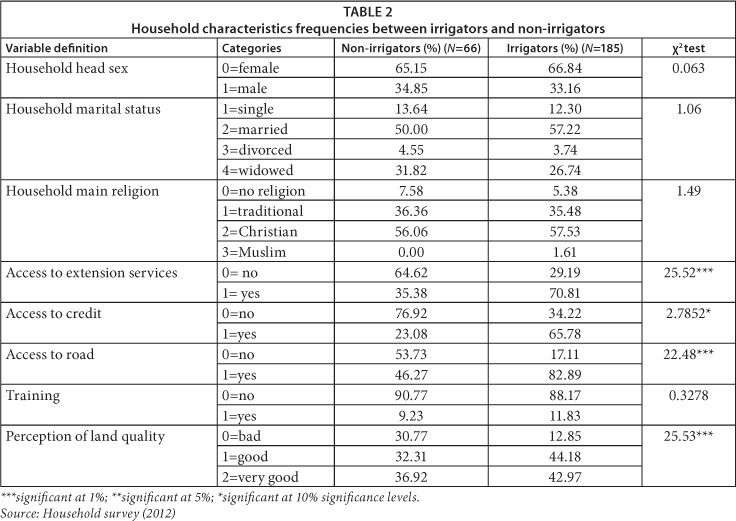
Table 1 also indicates that irrigators' welfare status is generally above that of non-irrigators, as shown by their significantly higher (by 45%) total expenditures per adult equivalent. There were significant differences between irrigators and non-irrigators in terms of both food and non-food consumption expenditure. Non-irrigators spend much of their income on food, with food expenses contributing an average of 87% of total consumption expenditure. This again shows that irrigators are better-off in terms of affluence. Women play a dominant role in both irrigation and non-irrigation farming, as shown by percentages presented in Table 2. The table below indicates that the majority (65.15%) of the households were female-headed, which supports other reports of this widely encountered phenomenon in South Africa (Denison and Manona, 2007; Mnkeni et al., 2010).
Table 2 also indicates that there was a significant difference between the support services that irrigators get compared to non-irrigators in the study area. The majority of the irrigators reported that they had access to extension, credit and good roads while the majority of the non-irrigators had none. The pressure on the government to ensure that projects do not fail results in that skewed distribution of support to irrigators. Also, irrigators perceived their soils to be of good quality, while the majority of the non-irrigators felt that their soils were infertile. Descriptive analysis presented above highlights the features of irrigators and non-irrigators. The FGT poverty analysis is presented in the next section to further characterise the irrigators and non-irrigators in terms of poverty.
Foster Greer Thorbecke (FGT) poverty indices
The Foster Greer Thorbecke (FGT) poverty indices indicated that the irrigators are better-off than non-irrigators. Using the poverty line of ZAR5 276.64, Table 3 indicates that poverty incidence was higher among non-irrigators compared to irrigators, with 75% of non-irrigators in the study classified as poor compared to 55% of irrigators.

Poverty incidence was generally high across the whole sample, i.e., even among irrigators. The study area experiences high levels of poverty as shown by high (61%) poverty incidence. The depth and severity of poverty was higher among the non-irrigators than among irrigators. The poverty gap index is 31% for non-irrigators and 16% for irrigators. This implies that the current consumption level of poor non-irrigators and irrigators would have to increase by an average of 31% and 16%, respectively, to lift them out of poverty. The squared poverty gap index indicates that inequality among the poor is higher for non-irrigators than it is for irrigators. The FGT poverty indices indicate that although poverty is prevalent for both groups it is more pronounced among non-irrigators. The next section provides econometric models that were used to examine the extent to which irrigation increases household consumption, holding other factors constant.
Econometric results
The treatment effect model was used in this study to evaluate the irrigation impact on household consumption expenditure. The first stage of the treatment effect model involved estimating the participation model and the results are presented in the next section. The results of the outcome model, the second stage of the treatment effect model, are presented in the subsequent section.
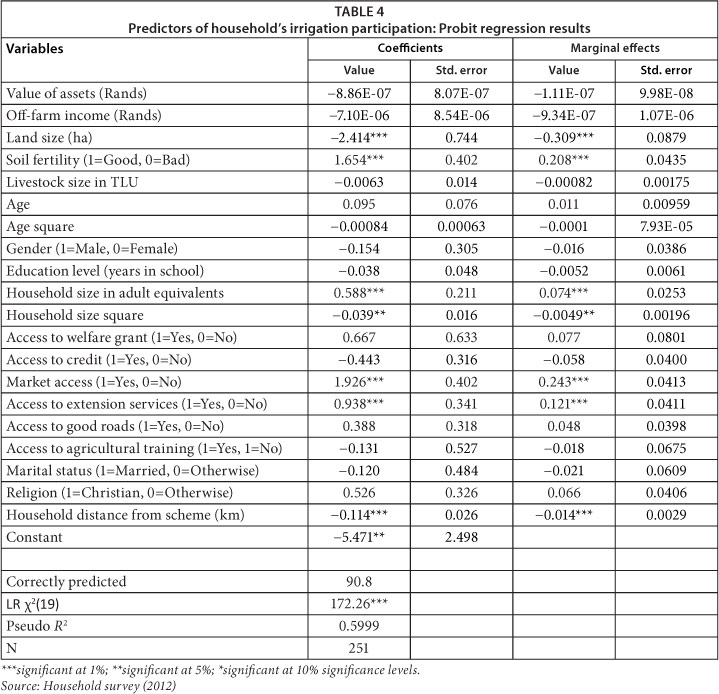
Factors predicting household's participation in irrigation farming: Probit model results
The binary probit model was estimated to determine the household characteristics and resource endowment that predict the household's participation in irrigation farming. Table 4 reports the results. The results in Table 4 indicate that, collectively, all estimated coefficients are statistically significant since the LR statistic has a p-value less than 1%. The pseudo R2 value is 60%, which is high for cross-sectional data. The model also correctly predicted about 91% of the cases, confirming that the model fits the data well.
The results show that factors such as land size, perceived soil fertility, household size, and access to support services (such as market and extension services) are significant predictors of irrigation participation. Accordingly, as the size of land operated by a household increases, the chances of being an irrigator decline by about 31%, other things held constant. This implies that irrigators tend to intensify their farming, while rain-fed farmers try to put more land under cultivation. This is in line with previous studies such as Tesfaye et al. (2008) and Dillon (2011).
The results also indicate those farmers who perceived their soil fertility to be good have a 21% greater chance of being irrigators than those who felt that their soils are infertile. This result is expected, as irrigation comes at a cost such that only those farmers with good land quality expecting better yield would engage in irrigation farming. This is consistent with the results from Bacha et al. (2011) and Tesfaye et al. (2008).
Increasing household size was found to increase the probability of practicing irrigation farming. A unit increase in household size in adult equivalents results in an increase in the probability of irrigation participation by 7%. Increasing household size implies availability of cheap labour, hence the higher probability that the household will participate in irrigation farming. However, the relationship between household size and irrigation participation is not linear but inverted U-shaped, as shown by the negative coefficient of household size square. This implies that although increasing family size increases the likelihood of irrigation participation, after a certain family size this likelihood is reduced. Irrigation farming can only absorb a certain amount of labour, and increasing family size beyond that level reduces labour returns; hence bigger families tend to look for other opportunities that have higher returns for their labour.
The results also show that perceived access to the market increases the likelihood of households participating in irrigation farming. The farmers who reported that the market is easily accessible have 24% increased chance of being irrigators than those who reported otherwise. As irrigation is meant to enhance productivity and marketable surplus, it is not surprising that those farmers with better market access are more likely to participate in irrigation schemes. Access to extension services also improves the likelihood of irrigation participation and extension officers are more visible in irrigation projects.
Farmers who reported contact with extension officers have a 12% greater chance of irrigating than those who reported otherwise. This result is consistent with findings by Gebregziabher et al. (2009).
The positive relationship between support services and irrigation can also be viewed as the tendency of government support to be concentrated on households engaged in projects, a common practice by the South African Government. Such an effort is rare in rain-fed smallholder agriculture. In Tugela Ferry, the Department of Agriculture is located right next to the irrigation scheme, making it more convenient to offer support services to the irrigators compared to the distant non-irrigators. This focus on farmers in projects has resulted in government support benefiting few people. As explained by Hall and Aliber (2010), the problem in South Africa has not been lack of support by the government, but the uneven distribution of that support to the farmers. However, it should also be highlighted that access to services by irrigators is also due to their entrepreneurship or initiatives. In reality, it is more likely that the irrigators are the enterprising farmers who take initiatives. These farmers would try to find new markets and make follow-ups to government institutions such as extension offices to get service, a practice not common among non-irrigators.
As expected, distance of farmer's homestead from the irrigation scheme had a negative influence on the farmer being an irrigator. Proximity to the scheme implies less time taken to reach the scheme, and ensures ease of management. Since the bulk of the farmers walk to the scheme, the closer the farmer is to the scheme, the higher his/her likelihood of being an irrigator.
The impact of access to irrigation access on household welfare: Treatment model results
Table 5 shows the results from the second stage of the treatment effect model and OLS. Although previous studies (Tesfaye et al., 2008; Bacha et al., 2011) have highlighted the likely endogeneity between irrigation participation and consumption expenditure, the Hausman test (F=0.74, p=0.39) indicated that there was no evidence of endogeneity between the two variables at the conventional 10% significance level in this study. Thus, OLS was used in the second stage of the treatment effect model. Household distance from the scheme, although included in the selection equation, was excluded in the second stage of the treatment effect model to satisfy the condition for model identification and precise estimation of the coefficients. Although it is often difficult to find a variable that affects selection and does not affect outcome (Sartori, 2003), distance of household from the scheme on its own does not influence welfare.
The insignificant λ in the treatment effect model indicates that there is no evidence of selection bias at the conventional 10% significance level. These findings demonstrate possible insignificant effect of unobservable factors on household consumption expenditure per adult equivalent. The insignificant λ implies that those farmers who select into the irrigation sample have no higher welfare relative to those with average characteristics drawn at random from the population. Therefore, the OLS results in Table 5 presented for comparison purposes are consistent and unbiased, and are close to those estimated using the treatment effect model. Henceforth, explanations concentrate on the treatment effect model results, although the same explanations do apply to the OLS results.
The treatment effect model fits the data very well, as indicated by the high χ2 and pseudo R2 values. The Stata software program automatically corrects the standard errors (for heteroskedasticity). The estimated coefficients are, therefore, unbiased and consistent, while the standard errors are efficient.
The results indicate that irrigation access significantly increases household consumption per adult equivalent as shown by a positive estimated coefficient of irrigation access with a p-value less than 1%. Access to irrigation enabled farmers in the study area to practice double cropping, and to grow crops such as cabbages and potatoes commercially. As a result, the irrigators were able to generate more money and achieve higher consumption expenditure compared to their non-irrigating counter parts. The consumption expenditure per adult equivalent per year of an irrigator is ZAR2 491 more than that of a non-irrigator, ceteris paribus.
This result is consistent with the findings of previous studies (Tesfaye et al., 2008; Gebregziabher et al., 2009; Bacha et al., 2011; Kuwornu and Owusu, 2012). The conclusion here is that even though smallholder irrigation has admittedly failed in South Africa as many schemes have collapsed after government pull-out, those irrigation schemes that remain operational are playing an important role in rural poverty reduction.
The other factors that influenced household consumption were off-farm income, land size, livestock size, education level, family size and access to support services (e.g., credit, extension services, agricultural training) and infrastructure (e.g., good roads). In line with expectations, access to more land increases household welfare in the rural areas. The households are dependent upon agricultural activity for their livelihood, and more land implies better opportunities to produce more. The positive sign on livestock size also implies that having more livestock gives the households an opportunity to sell during lean periods. Some farmers, particularly those operating on drylands, reported that livestock farming was a key livelihood activity in their households.
The results also support a widely held view that education is critical in the fight against poverty. Additional years of schooling of the household head were positively related with consumption expenditure. Education implies more opportunities of generating income, and implies better understanding of new and improved farming technologies. This result is consistent with findings from Tekana and Oladele (2011) and Namara et al. (2008). As expected, larger households consumed less per adult equivalent than those with fewer members. The relationship between household size and household total consumption expenditure was non-linear, indicating that as the family size increases, the welfare of a family decreases, but only up to a certain point. The U-shaped relationship between welfare and family size implies that beyond a certain point, welfare increases with increasing family size. This may be due to the labour-intensive nature of farming. Beyond a certain point, increasing labour within a household enables agricultural intensification. This result is consistent with findings from Bacha et al. (2011) and Kuwornu and Owusu (2012).
Access to support services and infrastructure (such as credit, extension, agricultural training and good road network) plays an important role in improving household welfare. Those households with better access to these services and infrastructure consumed more than those without. The farmers indicated that they use credit to buy agricultural inputs and sometimes for meeting family emergencies. Access to credit support also ensures that farmers can secure inputs in time. This leads to improved agricultural output, resulting in increased farm revenues. Extension services imply access to new technologies, which help improve agricultural production, while access to agricultural training improves farmers' skills. Most of the farmers in the scheme use only trial and error, and those who have received some form of training are better-off as they would put these skills to use.
As expected, access to a good road network has a positive impact on household food security. Those households connected by good road networks have better opportunities than those connected with poor roads. Good road network implies ease of accessing main market centres such as Tugela Ferry town. Due to the rugged topography of the Msinga municipal area, certain areas are relatively isolated from the main centres and the farmers struggle to access potential markets and other services.
For robustness checks of the estimated irrigation impact parameter, the propensity score matching method (PSM) was used. Since there is no evidence of selection bias due to unob-servables as indicated by the insignificant λ in the treatment effect model, the PSM method would result in unbiased and robust impact estimates. The balancing property was selected in estimating propensity scores. The use of the balancing property ensures that a comparison group is constructed with observable characteristics distributed equivalently across quintiles in both the treatment and comparison groups (Smith and Todd, 2005). In constructing the matching estimates, the common support was imposed. Heckman et al. (1997) encouraged dropping treatment observations with weak common support as inferences can be made about causality only in the area of common support. All standard errors were bootstrapped with 1 000 repetitions following Smith and Todd (2005) and Dillon (2011).
Two matching methods, the nearest neighbour and Kernel matching methods, were used to estimate the impact. Comparing results across different matching methods can reveal whether the estimated project effect is robust (Khandker et al., 2010). PSM results presented in Table 6 support the conclusion that irrigation access does improve household expenditure, indicating that irrigators spend between ZAR2 170 and ZAR2 301 more than the non-irrigators depending on the matching method used.

The preceding table indicates that both the nearest neighbour and Kernel matching methods point to the fact that irrigation access has a significant effect on household welfare. The nearest neighbour matching method identified 20 matching households as control, and concluded that irrigation access results in an increase of about ZAR2 301 in consumption expenditure per adult equivalent per year over that of non-irrigators. The Kernel matching method, on the other hand, identified 40 matching households as control, and was somewhat conservative compared to the nearest neighbour matching method in calculating the impact estimate. The Kernel matching method concluded that irrigation access results in a gain of ZARR2 170 in consumption expenditure of the irrigators. The PSM, although reporting slightly lower irrigation impact estimates, supports the conclusion made by the treatment effect model that irrigation access has a significantly positive influence on consumption expenditure. This implies that the statistical results are robust.
CONCLUSION AND RECOMMENDATIONS
The objective of this study was to provide empirical evidence of the impact of smallholder irrigation on household welfare. Although the irrigators and non-irrigators had the same demographic patterns, the welfare of the irrigators was found to be better than that of non-irrigators. The analysis of the FGT poverty indices indicated that poverty is prevalent for both groups, but is more pronounced among non-irrigators. Some 75% of non-irrigators in the study area were classified as poor compared to 55% of irrigators. This study has shown that smallholder irrigation plays an important role in rural poverty reduction. The treatment effect model and propensity score matching method indicated that smallholder irrigation access plays a significantly positive role in improving household welfare. The implication of this finding is that, when operational, smallholder irrigation schemes play a huge role in poverty reduction in the rural areas of South Africa. Therefore, government investments in smallholder irrigation should continue.
However, it must be highlighted that poverty incidence is also high among irrigators, as the majority were classified as poor. This is the reason why many researchers and policy makers doubt the poverty reduction role of smallholder irrigation in South Africa. What is clear from this conclusion is that even though smallholder irrigation access reduces poverty among farmers, it is not enough on its own to eradicate poverty. This should not be interpreted as failure of smallholder irrigation, but an indication of the need for a holistic package of complementary rural development strategies where smallholder irrigation plays a part. Smallholder irrigation cannot be considered as a 'magic bullet' that reduces poverty on its own. Other rural micro-projects and development initiatives should be considered to complement smallholder irrigation and reduce rural poverty significantly.
REFERENCES
ARAAR A and DUCLOS J-Y (2012) DASP: Distributive Analysis Stata Package. Université Laval PEP, CIRPÉE and World Bank. [ Links ]
BACHA D, NAMARA R, BOGALE A and TESFAYE A (2011) Impact of small-scale irrigation on household poverty: Empirical evidence from the Ambo District in Ethiopia. Irrig. Drain. 60 1-10. [ Links ]
BACKEBERG GR (2006) Reform of user charges, market pricing and management of water: Problem or opportunity for irrigated agriculture? Irrig. Drain. 551-12. [ Links ]
BAKER JL (2000) Evaluating the Impact of Development Projects on Poverty: A handbook for Practitioners. World Bank, Washington, D.C. [ Links ]
BEMBRIDGE T (2000) Guidelines for rehabilitation of small-scale farmer irrigation schemes in South Africa. WRC Report No. 891/1/00. Water Research Commission, Pretoria. [ Links ]
BLUNDELL R and COSTA-DIAS M (2000) Evaluation methods for non-experimental data. Fiscal Stud. 21(4) 447-468. [ Links ]
COUSINS B (2012) Smallholder irrigation schemes, agrarian reform and 'accumulation from below': Evidence from Tugela Ferry, KwaZulu-Natal. Conference on 'Strategies to overcome poverty and inequality: Towards Carnegie III', 3-7 September 2012, University of Cape Town, South Africa. [ Links ]
DEARLOVE PD (2007) Msinga Municipality Integrated Development Plan 2005/2006. KwaZulu-Natal Department of Local Governance and Traditional Affairs. URL: http://devplan.kzntl.gov.za/idp reviewed 2007 8/IDPS/KZ244/Adopted/Msinga%20IDP.pdf (Accessed 21 June 2012). [ Links ]
DENISON J and MANONA S (2007) Principles, approaches and guidelines for the participatory revitalization of smallholder irrigation schemes. Volume 1: A rough guide for irrigation development practitioners. WRC Report TT 309/07. Water Research Commission, Pretoria, South Africa. [ Links ]
DILLON A (2011) The effect of irrigation on poverty reduction, asset accumulation, and informal insurance: Evidence from Northern Mali. World Dev. 39 (12) 2165-2175. [ Links ]
FANADZO M (2012) Revitalisation of smallholder irrigation schemes for poverty alleviation and household food security in South Africa: A review. Afr. J. Agric. Res. 7 (13) 1956-1969. [ Links ]
FANADZO M, CHIDUZA C and MNKENI PNS (2010) Overview of smallholder irrigation schemes in South Africa: Relationship between farmer crop management practices and performance. Afr. J. Agric. Res. 5 (25) 3514-3523. [ Links ]
FOSTER J, GREER J and THORBECKE E (1984) A class of decomposable poverty measures. Econometrica 52(3) 761-766. [ Links ]
FRYE I (2005) Constructing and adopting an official poverty line for South Africa: Some issues for consideration. A discussion document. National Labour and Economic Development Institute, Sout h Africa. [ Links ]
GEBREGZIABHER G, NAMARA RE and HOLDEN S (2009) Poverty reduction with irrigation investment: An empirical case study from Tigray, Ethiopia. Agric. Water Manage. 961837-1843. [ Links ]
GREENE WH (2003) Econometric Analysis (5th edn.) Prentice-Hall, Inc, New Jersey. [ Links ]
HALL R and ALIBER M (2010) The case of re-strategizing spending priorities to support small-scale farmers in South Africa. Working Paper 17. Institute for Poverty, Land and Agrarian Studies (PLAAS), University of Western Cape, Cape Town. [ Links ]
HECKMAN JJ (1979) Sample selection bias as specification error. Econometrica 47 (1) 153-162. [ Links ]
HECKMAN JJ, ICHIMURA H and TODD P (1997) Matching as an econometric evaluation estimator: Evidence from evaluating a job training programme. Rev. Econ. Stud. 64(4) 605-654. [ Links ]
HECKMAN JJ and VYTLACIL E (2005) Structural equations, treatment effects, and econometric policy evaluation. Econometrica 73(3) 669-738. [ Links ]
HOPE RA, GOWING JW and JEWITT GPW (2008) The contested future of irrigation in African rural livelihoods: Analysis from a water scarce catchment in South Africa. Water Polic. 10173-192. [ Links ]
HUSSAIN I and HANJRA A (2004) Irrigation and poverty alleviation: Review of the empirical evidence. Irrig. Drain. 531-15. [ Links ]
HUSSAIN I and WIJERATHNA D (2004) Irrigation and income-poverty alleviation: A Comparative analysis of irrigation systems in developing Asia. International Water Management Institute, Colombo, Sri Lanka. [ Links ]
JALAN J and RAVALLION M (2003) Estimating the benefit incidence of an antipoverty program by propensity score matching. J. Bus. Econ. Stat. 21(1) 19-30. [ Links ]
KHANDKER SR, KOOLWAL GB and SAMAD HA (2010) Handbook on Impact Evaluation: Quantitative Methods and Practice. The World Bank, Washington, D.C. [ Links ]
KUMAR MD (2003) Food security and sustainable agriculture in India: The water management challenge. IWMI Working paper 60. International Water Management Institute, Colombo, Sri Lanka. [ Links ]
KUWORNU JKM and OWUSU ES (2012) Irrigation access and per capita consumption in farm households: Evidence from Ghana. J. Dev. Agric. Econ. 4(3) 78-92. [ Links ]
LIPTON M, LITCHFIELD J and FAURES J-M (2003) The effect of irrigation on poverty: A framework for analysis. Water Polic. 5 413-427. [ Links ]
MACHETHE CL, MOLLEL NM, AYISI K, MASHATOLA MB, ANIM
FDK and VANASCHE F (2004) Smallholder irrigation and agricultural development in the Olifants river basin of Limpopo Province: Management transfer, productivity, profitability and food security issues. WRC Report No. 1050/1/04. Water Research Commission, Pretoria.
MADDALA GS (1983) Limited-Dependent and Qualitative Variables in Economics. Cambridge University Press, New York. [ Links ]
MATSHE I (2009) Boosting smallholder production for food security: Some approaches and evidence from studies in sub-Saharan Africa. Agrekon 48 (4) 483-511. [ Links ]
MNKENI PNS, CHIDUZA C, MODI AT, STEVENS JB, MONDE N, VAN DER STOEP I and DLADLA RW (2010) Best management practices for smallholder farming on two irrigation schemes in the Eastern Cape and KwaZulu-Natal through participatory adaptive research. WRC Report No. TT 478/10. Water Research Commission, Pretoria. [ Links ]
NAMARA RE, HANJRA MA, CASTILLO GE, RAVNBORG HM, SMITH L and VAN KOPPEN B (2010) Agricultural water management and poverty linkages. Agric. Water Manage. 97 520-527. [ Links ]
NAMARA RE, MAKOMBE G, HAGOS F and AWULACHEW SB (2008) Rural poverty and inequality in Ethiopia: Does access to small-scale irrigation make a difference? In: Awlachew SB, Loulseged, M and Yilma AD (eds.) Impact of Irrigation on Poverty and Environment in Ethiopia. International Water Management Institute (IWMI), Colombo, Sri Lanka. [ Links ]
NDA (NATIONAL DEPARTMENT OF AGRICULTURE, SOUTH AFRICA) (2007) Sectoral overview and performance: Economic performance of the agricultural sector. National Department of Agriculture, Pretoria. URL: http://www.nda.agric.za/docs/StratPlan07/07sectoral.pdf (Accessed 18 August 2012). [ Links ]
PERRET S (2002) Water policies and smallholding irrigation schemes in South Africa: A history and new institutional challenges. Water Polic. 4 (3) 283-300. [ Links ]
PUHANI PA (2000) The Heckman correction for sample selection and its critique. J. Econ. Surv. 14 (1) 53-68. [ Links ]
SARTORI A (2003) An estimator for some binary-outcome selection models without exclusion restrictions. Polit. Anal. 11 111-138. [ Links ]
SHAH T, VAN KOPPEN B, MERREY D, DE LANGE M and SAMAD M (2002) Institutional alternatives in African smallholder irrigation: Lessons from international experience with irrigation management transfer. IWMI Research Report 60. International Irrigation Management Institute, Colombo, Sri Lanka. [ Links ]
SISHUTA B (2005) Small-scale irrigation development for sustainable rural development: A case study of the Tyhefu irrigation scheme. Afr. Sociol. Rev. 9 (2) 184-206. [ Links ]
SMITH J and TODD P (2005) Does matching overcome LaLonde's critique of nonexperimental estimators? J. Economet. 125 (1-2) 303-353. [ Links ]
SMITH LC and SUBANDORO A (2007) Measuring food security using household expenditure surveys. Food security in practice technical guide series. International Food Policy Research Institute, Washington, D.C. [ Links ]
SMITH LED (2004) Assessment of the contribution of irrigation to poverty reduction and sustainable livelihoods. Int. J. Water Resour. Dev. 20 (2) 243-257. [ Links ]
SPEELMAN S (2009) Water use efficiency and influence of management policies, analysis for the small-scale irrigation sector in South Africa. PhD Thesis, Ghent University. [ Links ]
STATS SA (2007) A national poverty line for South Africa. Statistics South Africa, Pretoria. URL: http://www.treasury.gov.za/publica-tions/other/povertyline/Treasury%20StatsSA%20poverty%20 line%20discussion%20paper.pdf (Accessed 23 August 2012). [ Links ]
TEKANA SS and OLADELE OI (2011) Impact analysis of Taung irrigation scheme on household welfare among farmers in North-West province, South Africa. J. Hum. Ecol. 36 (1) 69-77. [ Links ]
TESFAYE A, BOGALE A, NAMARA RE and BACHA D (2008) The impact of small-scale irrigation on household food security: The case of Filtino and Godino irrigation schemes in Ethiopia. Irrig. Drain. Syst. 22 (2) 145-158. [ Links ]
TLOU T, MOSAKA D, PERRET S, MULLINS D and WILLIAMS CJ (2006) Investigation of different farm tenure systems and support structure for establishing small-scale irrigation farmers in long term viable conditions. WRC Report No. 1353/1/06. Water Research Commission, Pretoria, South Africa. [ Links ]
TSHUMA MC (2012) A review of the poverty and food security issues in South Africa: Is agriculture the solution? Afr. J. Agric. Res. 7 (28) 4010-4020. [ Links ]
VAN AVERBEKE W (2012) Performance of smallholder irrigation schemes in the Vhembe District of South Africa. In: Kumar MD (ed.) Problems, Perspectives and Challenges of Agricultural Water Management. InTech, Rijeka, Croatia. [ Links ]
VAN AVERBEKE W, DENISON J and MNKENI PNS (2011) Smallholder irrigation schemes in South Africa: A review of knowledge generated by the Water Research Commission. Water SA 37 (5) 797-808. [ Links ]
VINK N and VAN ROOYEN J (2009) The economic performance of agriculture in South Africa since 1994: Implications for food security. Working Paper Series No 17. Development Bank of Southern Africa (DBSA), Midrand, Pretoria. [ Links ]
YOKWE S (2009) Water productivity in smallholder irrigation schemes in South Africa. Agric. Water Manage. 96 1223-1228. [ Links ]
 Correspondence:
Sikhulumile Sinyolo
+27 83 465 8590
E-mail: sksinyolo@gmail.com
Received 18 March 2013
Accepted in revised form 10 January 2014

