


Serviços Personalizados
Artigo
 Inglês (pdf)
 Artigo em XML
 Referências do artigo
Indicadores

Links relacionados
-
 Citado por Google
 -
 Similares em Google
Compartilhar

 Permalink
Water SA
versão On-line ISSN 1816-7950
versão impressa ISSN 0378-4738
Water SA vol.40 no.1 Pretoria Jan. 2014
Modelling the change in the oxidation coefficient during the aerobic degradation of phenol by acclimated activated sludge
Cintia C LoboI; Nora C BertolaI; Edgardo M ContrerasII, III
ICentro de Investigation y Desarrollo en Criotecnología de Alimentos (CIDCA) - CONICET - Fac. de Cs. Exactas - UNLP. 47 y 116 (B1900AJJ) - La Plata, Argentina
IIFac. de Ingeniería - UNLP. 47y 1 (B1900AJJ) - La Plata, Argentina
IIIInstituto de Investigaciones en Ciencia y Tecnologia de Materiales (INTEMA) - CONICET - Av. Juan B. Justo 4302 (7600) Mar del Plata, Argentina
ABSTRACT
In this work the aerobic degradation of phenol by acclimated activated sludge was studied. Results demonstrate that while the phenol removal rate by acclimated activated sludge follows the Monod model, the oxygen uptake rate obeys a Haldane-type equation. The phenol oxidation coefficient obtained at different intial phenol concentrations ranged from 1.9 to 2.6 mol O2 · mol-1 phenol. A mathematical model based on a simplified version of the catalytic mechanism of the enzyme phenol 2-monooxygenase was developed to predict transient phenol concentrations and oxygen requirements by phenol-acclimated activated sludge in batch reactors under different initial phenol concentrations. The proposed model not only adequately represents the experimental results of the present paper, but also those reported by other authors. Particular cases of the proposed model are discussed.
Keywords: oxygen uptake rate; phenol; biodegradation; biokinetic model; respirometry
INTRODUCTION
Phenolic compounds are considered to be a major group of hazardous environmental pollutants. Several industries, such as petroleum processing plants, oil refineries, coke oven and pharmaceuticals, generate large amounts of phenolic wastewaters (Lepik and Tenno, 2011; Pramparo et al., 2012). Phenol is used as an intermediate in the production of phenolic resins, which are used in the plywood, adhesive, construction, automotive and appliance industries, in the production of synthetic fibres and for epoxy resin precursors. Besides, phenolic compounds are naturally present in some foodstuffs, in human and animal wastes, and in decomposing organic material, and are produced from the metabolism of proteins (Lin and Juang, 2009).
Phenols can be removed from industrial effluents by several physicochemical methods. Separation technologies include distillation, liquid-liquid extraction, adsorption over activated carbons and polymeric and inorganic adsorbents, membrane pervaporation and membrane-solvent extraction. Destruction technologies such as non-catalytic, supercritical and catalytic wet air oxidation, ozonation, non-catalytic, catalytic and enzymatic peroxide wet oxidation, electrochemical and photo-catalytic oxidation have also been studied. As a general rule, all these treatments are usually complex and very expensive; for these reasons, biological methods are preferred (Busca et al., 2008).
Many aerobic bacteria and mixed cultures are capable of degrading aromatic compounds as the sole carbon and energy source (El-Naas et al., 2009; Banerjee and Ghoshal, 2010). Batch and semi-continuous systems with suspended or immobilised biomass were used to study phenol degradation kinetics (Orupold et al., 2001; Nuhoglu and Yalcin, 2005; Tziotzios et al., 2005). The most used model to describe the dependence of biomass growth, phenol and oxygen consumption rates on a self-inhibitory substrate, such as phenol, is the Haldane equation with a constant yield (Christen et al., 2012; Pramparo et al., 2012). Although the Haldane model can be derived from an enzymatic mechanism, not all the enzymes involved in phenol metabolism can be represented by this mechanism. In particular, the first step in the aerobic biodegradation of phenol comprises the oxidation of phenol to catechol by the enzyme phenol 2-monooxygenase (PH2MO). The catalytic mechanism of PH2MO is complex, involving FAD and 3 substrates (molecular oxygen, phenol and NADPH) (Enroth et al., 1998).
Due to the lack of fit of the traditional approach (e.g., the Haldane equation with a constant yield), several authors (Feitkenhauer et al., 2001; Nuhoglu and Yalcin, 2005; Ben-Youssef and Vázquez-Rodríguez, 2011) have proposed different modifications to the traditional model. However, those models were developed on an empirical base, i.e. the study of phenol degradation and biomass growth kinetics and then the fitting of an appropriate mathematical model to the obtained results. Additionally, most studies concerning the aerobic degradation of phenol have been performed using pure cultures, low concentration ranges of phenol, or even a single initial concentration of phenol. In this sense, further investigation is necessary to understand phenol biodegradation under more realistic conditions, especially in biological wastewater treatment systems where the concentration of phenol can vary over a wide range (Alcocer et al., 2007; Banerjee and Ghoshal, 2010; El-Naas et al.,2010).
Knowledge of microbial substrate consumption kinetics is important for accurate prediction of the quality of the treatment process effluent. One key feature is the relationship between phenol concentration and the rates of substrate and oxygen consumption (Kumar et al., 2005; Nuhoglu and Yalcin. 2005). While the substrate consumption rate determines the size of bioreactors, knowledge of the oxygen uptake rate associated with phenol degradation is crucial to an appropriate design of aeration devices. Taking into account that, in a typical activated sludge wastewater treatment plant, aeration costs represent approximately 45% of the total operative cost (e.g. energy for aeration, pumping, and sludge treatment) (Vanrolleghem and Gillot, 2002), accurate kinetic models help engineers to optimise operational conditions in order to meet discharge requirements, minimising operational costs. For these reasons, in this work a mathematical model based on a simplified version of the catalytic mechanism of PH2MO was developed to predict transient phenol concentrations and oxygen requirements by phenol-acclimated activated sludge in batch reactors under different initial phenol concentrations.
EXPERIMENTAL
Chemicals and reagents
Phenol (loose crystals, > 99%) was obtained from Sigma (St. Lois, MO, USA). All inorganic salts were commercial products of reagent grade from Anedra (San Fernando, Argentina). Dehydrated cheese whey was from Food S.A. (Villa Maipú, Argentina).
Acclimation of activated sludge to phenol
Activated sludge used in this study was cultured in a laboratory-scale (2.5 ℓ) cylindrical semicontinuous fill and draw reactor. Aeration was provided at the bottom of the reactor through an air-stone using 2 air pumps at 2 ℓ-min-1; dissolved oxygen (DO) concentration was maintained above 4 mg-ℓ-1. Phenolacclimated activated sludge was obtained as follows: Initially, the reactor was fed with a model wastewater of the dairy industry (Lobo et al., 2013), dehydrated cheese whey 1 000 mg, (NH4)2SO4 940 mg, K2HPO4 500 mg and KH2PO4 250 mg. All components were diluted in 1 ℓ of tap water. The hydraulic retention time was 80 h and a solids retention time of 30 days was maintained by direct wastage. After 70 days of operation, the model wastewater was replaced by a culture medium with phenol as the sole carbon-limiting source (Nuhoglu and Yalcin, 2005): (NH4)2SO4 226 mg-ℓ-1, K2HPO4 500 mg-ℓ-1 KH2PO4 250 mg∙ℓ-1, MgSO4∙7H2O 25.2 mg∙ℓ-1, MnSO4∙H2O 2.52 mg∙ℓ-1, CaCl2 2 mg∙ℓ-1, FeCl3 1.2 mg∙ℓ-1, phenol 300 mg∙ℓ-1. pH was adjusted to 7.0 ± 0.05 by adding a few drops of concentrated solutions of NaOH or HCl. During this phase the solids retention time was increased to 45 days in order to prevent biomass washout. The reactor was monitored periodically by measurements of total suspended solids (TSS), soluble chemical oxygen demand (sCOD) and soluble COD consumption rate (RCOD). Biomass was considered acclimated to phenol when the specific sCOD consumption rate (qCOD = RCOD/TSS) was approx. constant for at least 2 weeks.
During several fill and draw cycles, total phenol (TPh) and DO were also measured as a function of the cycle time. In these cases, before the addition of phenol, the oxygen mass transfer coefficient (kLa) was obtained using a non-steady state procedure (Ros, 1993). The oxygen uptake rate associated with phenol consumption (RO2) was calculated from the DO mass balance in the reactor:
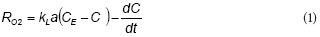
where:
CE is the DO concentration in equilibrium with respiration in the absence of substrate C is the instantaneous DO concentration
The amount of oxygen consumed (OC) during the phenol oxidation was calculated as follows:
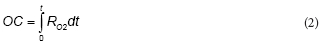
The overall oxidation coefficient (YO/S), which represents the amount of oxygen consumed per unit of substrate (phenol) oxidised, was calculated as the ratio OCm/S0, where OCm is the maximum amount of oxygen consumed and S0 is the initial phenol concentration (mg∙ℓ-1).
Effect of the initial phenol concentration on the biodegradation kinetics
The effect of initial phenol concentration on phenol degradation kinetics by phenol-acclimated activated sludge was assessed using an open (flowing gas/static liquid) respirometer. Before performing the assays, activated sludge samples were washed 3 times with phosphate buffer (15 mM, pH = 7) and re-suspended to a final volume of 500 mℓ using the above-mentioned buffer. Then, 0.5 mℓ micronutrient solutions were added (Contreras et al., 2011). Washed activated sludge samples were poured into the respirometer, which consists of a 500-mℓ working volume reactor with temperature control (25 ± 0.5oC). The sample was stirred with a magnetic stir-bar and was aerated continuously by an air pump. Air was set to a stable flow rate (1.0 ℓ-min-1) using a high precision rotameter (Bruno Schilling model MB 60V, Argentina), and DO concentration as a function of time was recorded. Oxygen mass transfer coefficient of the respirometer (kLa) and RO2 values were calculated as described in the previous section. In these experiments the biomass concentration was 0.7 g∙ℓ-1TSS and tested initial phenol concentration (SO) ranged from 0.53 to 5.3 mM.
Analytical procedures
Total suspended solids (TSS) were used as a measure for the biomass concentration (X, g∙ℓ-1 TSS). Duplicate biomass measurements were performed to reduce experimental errors; average and maximum relative errors for TSS were 4% and 13%, respectively. Dissolved oxygen (DO) concentration was measured using a polarographic DO probe YSI (model 5739). DO data were acquired by a personal computer interfaced to a DO monitor YSI (model 58). Soluble COD (sCOD) was determined as follows: 3 m£ of culture samples were centrifuged for 5 min at 13 000 r∙min-1 (Eppendorf 5415C); then, COD of the supernatant was determined using a commercial test (Hach). Sample digestion (2 h, 150oC) was performed in a Hach COD Reactor 45600; a Hach DR 2000 photometer was used for the absorbance determination step. Total phenol (TPh) concentration of the supernatant was measured using the 4-aminoantipyrine (4-AAP) method (Vazquez-Rodriguez et al., 2006). This method uses 2 reagents, 4-AAP (20.8 mM of 4-AAP in 0.25 M NaHCO3) and ferricyanide (83.4 mM of K3Fe(CN)6 in 0.25 M NaHCO3), as colour-generating substrates when combined with phenolic compounds. Coloured complexes were measured at 510 nm in a Hach DR 2000 spectrophotometer. Calibration curves were performed periodically using phenol as the reference compound.
Estimation of the model coefficients and dynamic simulations
Coefficients of the mathematical model proposed in this work and the dynamic simulations were performed using the software package Gepasi 3. The routine LSODA (Livermore Solver of Ordinary Differential Equations) was selected to integrate the system of differential equations of the proposed model. Multistart Optimisation algorithm (with Levenberg-Marquardt local optimisation) was selected to fit the proposed model to the experimental data. In order to reduce fitting errors of the adjustable coefficients, initial concentrations were adjusted within ±5% of their measured values. This procedure takes into account the degree of uncertainty in the initial conditions due to analytical errors. To describe the biological startup phenomenon, a first-order correction factor was included (Contreras et al., 2008).
RESULTS AND DISCUSSION
Phenol consumption and oxygen uptake by phenol-acclimated activated sludge
Figure 1a shows an example of total phenol (TPh) and soluble COD (sCOD) concentration profiles during a fill and draw cycle with phenol. Both TPh and sCOD exhibited a linear decrease up to phenol depletion at t = 2.2 h; within this interval, removal rates of TPh and sCOD were 1.26 mM-h1 and 274 mg-ℓ-1-h-1, respectively. Figure 1a shows that TPh removal is linear until its depletion, which corresponds to a constant removal rate of TPh. The oxygen uptake rate associated with phenol consumption (RO2) is shown in Fig.1b. After a short start-up period, RO2 increased from 2 to 3 mM-h-1 as a function of time; then, RO2 decreased to values close to zero due to phenol depletion. Taking into account that during this experiment the biomass concentration (X) increased about 17% with respect to the initial value (from 1.8 to 2.1 g-ℓ-1 TSS), the change of RO2 values could not be attributed to the increment of biomass but to an intrinsic feature of the phenol biodegradation kinetics, such as the inhibition of RO2 by phenol.
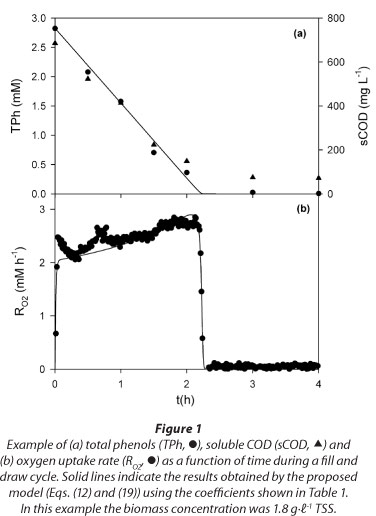
Figure 2 shows that the plot of sCOD as a function of TPh was a straight line with slope = 218 g COD - mol-1 TPh; because this slope value is close to the theoretical oxygen demand of phenol (e.g., 224 g COD - mol-1 phenol), it was concluded that no partial oxidation products of phenol were released during its degradation. When the phenol was depleted, the lowest sCOD concentration was about 71 mg-ℓ-1; this background sCOD value was attributed to the presence of microbial soluble products (Xie et al., 2012).
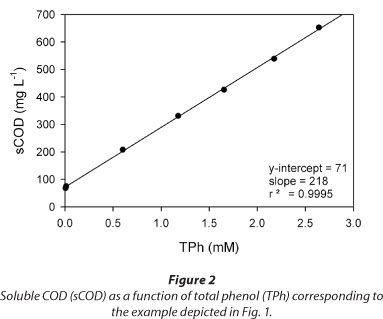
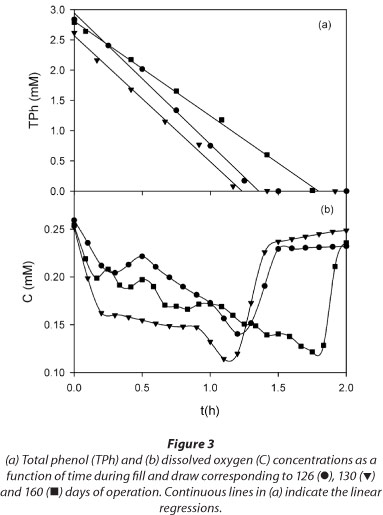
Figure 3 shows several examples of total phenols (TPh) and dissolved oxygen (C) concentrations as a function of time during a fill and draw cycle with phenol. In all cases, a linear decrease of TPh concentration was obtained (Fig. 3a). Taking into account that C values ranged between 0.10 and 0.25 mM (Fig. 3b), these results suggest that within the tested conditions the phenol consumption rate (.RS) was not affected by the dissolved oxygen concentration. Figure 3 also shows that the time at which phenol is depleted (tF) is similar to the time at which C begins to increase; thus, the increase of C can be used as an indication of substrate depletion. Buitron et al. (2005) developed a control strategy to optimise the reaction time of a SBR based on the DO profile; according to those authors, the time at which the substrate is completely consumed (tF) can be assessed by the increase in DO.
Effect of the initial phenol concentration on the biodegradation kinetics
Open respirometer experiments were performed in order to study the effect of initial phenol concentration on respiration rate and on oxygen consumed during phenol biooxidation. Figure 4 shows that for all the tested initial phenol concentrations (S0 = 0.53 to 5.3 mM), after a start-up period RO2 increased almost linearly as a function of time and then decreased to values close to zero due to substrate depletion. According to Fig. 3, the time at which the substrate is completely consumed (tF) can be assessed by the increase in DO; based on these tF values, average substrate consumption rates (RS-ave) corresponding to different initial phenol concentrations were calculated as the ratio S0/tF. Figure 5a shows that RS-ave values were constant as a function of the initial phenol concentration (S0), suggesting Monod type kinetics for the removal rate of TPh (RS). This result is in accordance with the linear decrease of TPh and sCOD depicted in Figs. 1a and 3a. Besides, from the extrapolation of RO2 to time zero (Fig. 4), initial RO2 values (RO20) corresponding to the different initial phenol concentrations can be obtained. Figure 5a shows that RO20 decreased as 50 increased, suggesting a Haldane dependence of RO2 as a function of 5. Note that if RS follows the Monod equation and RO2 obeys a Haldane-type dependence with respect to 5, then the oxidation coefficient (e.g., the amount of oxygen consumed per unit of substrate oxidised) must be a function of S0, rather than a constant.
Based on the RO2 profiles corresponding to different S0 values (Fig. 4), maximum values for the oxygen consumed (OCm) were calculated using Eq. (2). Figure 5b shows that the overall oxidation coefficient (YO/S) decreased as S0 increased, confirming that the amount of oxygen consumed per unit of substrate oxidised was a function of S0. The range of YO/S values corresponding to phenol obtained in the present work (1.9-2.O2mol-1 phenol) was similar to that reported by other authors. Orupold et al. (2001) studied the oxidation of several phenolic compounds by activated sludge; those authors reported a YO/S value of 2.6 ± 0.5 mol O2 mol·-1 phenol. Recently, Lepik and Tenno (2011) studied the aerobic degradation of phenol by activated sludge acclimated to a wastewater of an oil-shale industry; those authors reported a YO/S value of 2.0 mol O2-mol-1 phenol. It should be noted that YO/S values, calculated according to carbon and reduction degree balances applied to biomass growth with phenol as sole carbon source, range between 4.0 and 7.3 mol O2 · mol-1 phenol (Feitkenhauer et al., 2001; Kumar et al., 2005). These differences suggest that respirometric YO/S values reflect a partial oxidation of phenol due to the accumulation of metabolic intermediates. Wang and Loh (1999) studied phenol degradation by Pseudomonas putida ATCC 49451; those authors found that the accumulation of metabolic intermediates of phenol inhibited phenol oxidation, especially at high initial phenol concentrations. Similar results were reported by other authors with regard to the accumulation of metabolic intermediates during phenol degradation by activated sludge (Nuhoglu and Yalcin, 2005; Vazquez-Rodriguez et al., 2006, Ben-Youseff and Vazquez-Rodriguez, 2011).6 mol
Modelling phenol oxidation by acclimated activated sludge
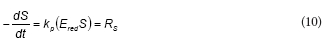
The first step in the aerobic degradation pathway of phenol comprises the hydroxylation of phenol by the enzyme phenol 2-monooxygenase (PH2MO). In the present model it was assumed that the total PH2MO concentration (ET) is proportional to the biomass concentration (X), being qE, the proportionality constant. According to several authors, the catalytic mechanism of PH2MO involves 3 substrates: molecular oxygen, phenol and NADPH. The reaction scheme for PH2MO can be divided into reductive and oxidative half-reactions. During the reductive step, after the phenol binding, the oxidised form of the enzyme (EoxS) is reduced by NADPH, NADP+ leaves the enzyme to produce an intermediary complex EredS. In the oxidative half-reaction, molecular oxygen reacts with EredS, phenol (S) is hydroxylated to catechol (SOH) and the oxidised form of the enzyme Eox is regenerated (Enroth et al., 1998). Besides, Divari et al. (2003) demonstrate that during the catalytic cycle of PH2MO, the ratio of product formed to NADPH consumed is less than 1. Several authors (Enroth et al., 1998; Divari et al., 2003) have proposed that the mechanism of action of PH2MO must bifurcate into productive and unproductive paths, which involves the dissociation of red5 to form free reduced enzyme (Ered). The free reduced enzyme is then oxidised by oxygen to produce Eox and H2O2. Because the decomposition of hydrogen peroxide returns one half of the oxygen consumed, the net result of the unproductive path is the consumption of 0.5 mol of oxygen. The overall reactions for the productive and unproductive paths are the following:
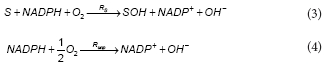
where:
RS and Runp are the rates of the productive and unproductive paths, respectively
Results shown in Fig. 3 suggest that within the experimental conditions the phenol consumption rate was not affected by the dissolved oxygen concentration. Thus, in order to reduce the model complexity it was assumed that, within the tested conditions, both productive and unproductive reaction rates were not affected by the dissolved oxygen concentration. Under these assumptions, the productive path was represented as follows:
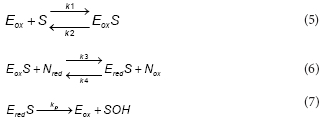
To represent the unproductive path, the following reactions were proposed:
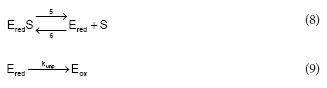
To express the phenol consumption rate (RS) as a function of S, a steady-state for Eox , Eox, Ered,S and Ered , was assumed Under this assumption the phenol consumption rate (RS) is:
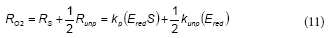
Considering Eqs. (3) and (4), the oxygen consumption rate (RO2) is
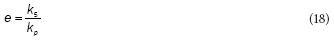
To further simplify the model, it was assumed that NADPH and NADP+ concentrations are nearly constant during the phenol metabolism. Because NADPH and NADP+ are intracellular metabolites, their total concentration (NT = Nred + N ) is proportional to the biomass concentration (X). If the initial phenol concentration (S0) is much lower than NT, then both NADPH and NADP+ concentrations can be considered as constants. Additionally, if fred is defined as the ratio Nred/NT then fred is a constant also. Under this assumption, the following expression can be obtained:
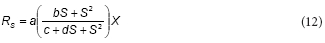
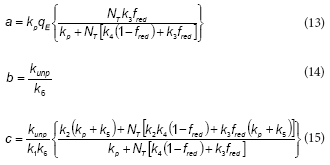
where the expressions corresponding to the constants a, b, d and d are the following:

According to the proposed model, the rate of the unproductive path is:
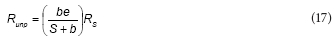
where:
The overall oxygen uptake rate during the phenol oxidation (RO2) due to productive and unproductive paths can be calculated by combining Eqs. (11), (12) and (17):
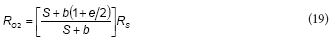
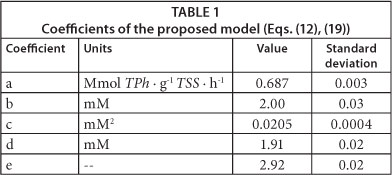
Using software package Gepasi 3, Eqs. (12) and (19) were fitted to the measured RO2 values as a function of time, corresponding to the different initial phenol concentrations; obtained results are shown in Table 1. Figures 4 and 5 demonstrate that the proposed model adequately represents RO2 and RS as a function of time for all of the tested initial phenol concentrations. Using the fitted model, RO2 profiles were calculated for different S0 values; then, maximum oxygen consumed (OCm) was calculated using Eq. (2) and the overall oxidation coefficient (YO/S) calculated as the ratio OCm/S0. Figure 5b shows that YO/S values obtained from the model were close to the experimental ones, confirming the validity of the developed model.
The fitted model was used to represent the total phenol concentration (TPh) and oxygen uptake rate (RO2) profiles during the fill and draw cycle shown in Fig. 1. In this case, the proposed model adequately predicts the linear decrease of TPh up to its depletion (Fig. 1a). Moreover, Fig. 1b shows that RO2 increased as a function of time up to the substrate depletion at t = 2.2 h. Taking into account that these data were not used to fit the model, the agreement shown in Fig. 1 provides a validation of the proposed model.
Analysis of the developed model and comparison with other authors
Several conclusions arise from the analysis of the proposed model. The first one is that the kinetic coefficients obtained from respirometric data (e.g., RO2 as a function of S) characterise the substrate consumption kinetic only if the oxidation coefficient is a constant. Note that the term between brackets in Eq. (19) corresponds to the instantaneous oxidation coefficient, which in fact varies as a function of the actual substrate concentration. For this reason, the overall oxidation coefficient was also a function of the initial phenol concentration.
According to the proposed model, dependences between RO2 and RS with S are quite different. While RO2 as a function of S is close to the Haldane model, a Monod-type equation is more suited to describe the dependency of RS with S (Fig. 5a). In most of the proposed models in the literature, the Haldane equation is an assumption to describe, with more or less accuracy, the biomass growth, phenol and oxygen consumption rates as a function of substrate concentration (Ben-Youssef and Vazquez-Rodriguez, 2011; Christen et al., 2012; Pramparo et al., 2012). Conversely, in the model proposed in the present work the inhibition of the respiration rate for high phenol concentrations arises as a natural consequence of the unproductive path during phenol metabolism (Eqs. (8), (9)). Indeed, in the case of an extremely stable EredS complex (e.g., k5 ≅ 0 or k6 -» ∞), or if the free reduced enzyme (Ered) could not be oxidised by oxygen (e.g., kunp ≅ 0), coefficients b and c tend to zero (Eqs. (14), (15)), and in this case Eq. (19) of the proposed model can be simplified to obtain the Monod equation.
Several authors have found that the Haldane equation is not always suitable to represent the dependence of growth and substrate consumption rates as a function of S. For example, Marrot et al. (2006) studied the growth of activated sludge in phenol as a sole carbon source; these authors found that the specific growth rate increases with phenol concentration and then declines as substrate inhibition became important, in agreement with the Haldane equation. However, according to the data reported by the authors of the abovementioned work, the specific growth rate remains almost constant, about 10% of the observed maximum, for phenol concentrations higher than 10 mM. This behaviour is in agreement with the proposed model; Eqs. (12) and (19) show that both RS and R02 tend to constant values at high phenol concentrations.
Feitkenhauer et al. (2001) proposed the following equation for the growth rate (Rx) of Bacillus themoleovorans as a function of phenol concentration:
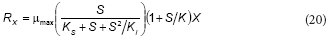
This equation is similar to the proposed model; rearranging Eq. (16) the following expression can be obtained:
From the comparison between Eqs. (20) and (21), it can be concluded that K = b, KS = c/d and Ki = d; thus, Feitkenhauer et al. (2001) found an empirical equation that is similar to the model developed in the present work.
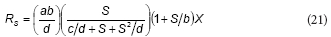
Several authors have also reported that, for low phenol concentrations, the Monod model with a constant oxidation coefficient (YO/S) is enough to represent oxygen and phenol consumption kinetics (Chudoba et al., 1985; Orupold et al., 2001; Contreras et al., 2008; Lepik and Tenno, 2011). Under this condition, quadratic terms in Eq. (12) can be neglected, obtaining the following expressions:
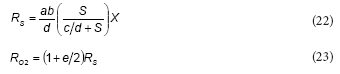
Equations (22) and (23) demonstrate that the proposed model tends to the Monod model with a constant oxidation coefficient (YO/S) at low phenol concentrations. Figure 5b shows that YO/S values calculated by using the proposed model at low phenol concentrations are close to the reported values of other authors. Besides, according to Eq. (22), and using the constants shown in Table 1, the phenol saturation constant (KS) can be calculated as the ratio c/d = 10 µM. This value is in accordance with KS values reported by other authors who have studied phenol biodegradation using respirometric techniques. Chudoba et al. (1985) reported a KS of 14 µΜ; Orupold et al. (2001) found KS values ranging from 8 to 16 µΜ, corresponding to an activated sludge acclimated to phenolic compounds. Contreras et al. (2008) reported a value for KS = 11 µΜ, while Lepik and Tenno (2011) informed KS = 4 µΜ. These results demonstrate that the proposed model not only adequately represents the experimental results of the present paper, but also several findings reported by other authors.
CONCLUSIONS
This work demonstrates that while the phenol removal rate by acclimated activated sludge follows a Monod type kinetics, the oxygen uptake rate obeys a Haldane-type dependence with respect to the phenol concentration; thus, the phenol oxidation coefficient cannot be considered as a constant. A mathematical model based on a simplified version of the catalytic mechanism of the enzyme PH2MO was developed. The proposed model not only adequately represents the experimental results of the present paper, but also predicts several features regarding the aerobic phenol biodegradation that has been reported by other authors. The proposed model can be useful for predicting transient responses, such as substrate and DO concentrations as a function of time, in bioreactors experiencing an overload of phenolic wastewaters.
ACKNOWLEDGMENTS
The authors gratefully acknowledge the financial support provided by National Council of Scientific and Technical Research (CONICET), National University of La Plata (UNLP) and National Agency for Science and Technology (ANPCyT), Argentina.
REFERENCES
ALCOCER AS, ORDAZ NR, RAMÍREZ CJ and MAYER JG (2007) Continuous biodegradation of single and mixed chlorophenols by a mixed microbial culture constituted by Burkholderia sp., Microbacterium phyllosphaerae, and Candida tropicalis. Biochem. Eng. J. 37 201-211. [ Links ]
BANERJEE A and GHOSHAL AK (2010) Phenol degradation by Bacillus cereus: Pathway and kinetic modeling. Bioresour. Technol. 101 5501-5507. [ Links ]
BUITRON G, SCHOEB M-E, MORENO-ANDRADE I and MORENO JA (2005) Evaluation of two control strategies for a sequencing batch reactor degrading high concentration peaks of 4-chlorophenol. Water Res. 39 1015-1024. [ Links ]
BEN-YOUSEFF C and VÁZQUEZ-RODRÍGUEZ GA (2011) Model-based design of different fedbatch strategies for phenol degradation in acclimatized activated sludge cultures. Bioresour. Technol. 102 3740-3747. [ Links ]
BUSCA G, BERARDINELLI S, RESINI C and ARRIGHI L (2008) Technologies for the removal of phenol from fluid streams: A short review of recent developments. J. Hazardous Mater. 160 265-288. [ Links ]
CONTRERAS EM, ALBERTARIO ME, BERTOLA NC and ZARITZKY NE (2008) Modelling phenol biodegradation by activated sludges evaluated through respirometric techniques. J. Hazardous Mater. 158 366-374. [ Links ]
CONTRERAS EM, FERRO OROZCO AM and ZARITZKY NE (2011) Biological Cr(VI) removal coupled with biomass growth, biomass decay and multiple substrate limitation. Water Res. 45 3034-3046. [ Links ]
CHRISTEN P, VEGA A, CASALOT L, SIMON G and AURIA R (2012) Kinetics of aerobic phenol biodegradation by the acidophilic and hyperthermophilic archaeon 5lufolobus solfataricus 98/2. Biochem. Eng. J. 62 56-61. [ Links ]
CHUDOBA J, CECH JS, FARKAC J and GRAU P (1985) Control of activated sludge filamentous bulking. Experimental verification of a kinetic selection theory. Water Res. 19 191-196. [ Links ]
DIVARI S, VALETTI F, CAPOSIO P, PESSIONE E, CAVALETTO M, GRIVA E, GRIBAUDO G, GILARDI G and GIUNTA C (2003) The oxygenase component of phenol hydroxylase from Acinetobacter radioresistens S13. Eur. J. Biochem. 270 2244-2253. [ Links ]
EL-NAAS MH, AL-MUHTASEB SA and MAKHLOUF S (2009) Biodegradation of phenol by Pseudomonas putida immobilized in polyvinyl alcohol (PVA) gel. J. Hazardous Mater. 164 720-725. [ Links ]
ENROTH C, NEUJAHR H, SCHNEIDER G and LINDQVIST Y (1998) The crystal structure of phenol hydroxylase in complex with FA D and phenol provides evidence for a concerted conformational change in the enzyme and its cofactor during catalysis. 5tructure 6 605-617. [ Links ]
FEITKENHAUER H, SCHNICKE S, MULLER R and MARKL H (2001) Determination of the kinetic parameters of the phenol-degrading thermophile Bacillus thermoleovorans sp. A2. Appl. Microbiol. Biotechnol. 57 744-750. [ Links ]
KUMAR A, KUMAR S and KUMAR S (2005) Biodegradation kinetics of phenol and catechol using Pseudomonas putida MTCC 1194. Biochem. Eng. J. 22 151-159. [ Links ]
LEPIK R and TENNO T (2011) Biodegradability of phenol, resorcinol and 5-methyl resorcinol as single and mixed substrates by activated sludge. 0il 5hale 28 425-446. [ Links ]
LIN S-H and JUANG R-S (2009) Adsorption of phenol and its derivatives from water using synthetic resins and low-cost natural adsorbents: A review. J. Environ. Manage. 90 1336-1349. [ Links ]
LOBO CC, BERTOLA NC and CONTRERAS EM (2013) Stoichiometry and kinetic of the aerobic oxidation of phenolic compounds by activated sludge. Bioresour. Technol. 136 58-65. [ Links ]
MARROT B, BARRIOS-MARTINEZ A, MOULIN P and ROCHE N (2006) Biodegradation of high phenol concentration by activated sludge in an immersed membrane bioreactor. Biochem. Eng. J. 30 174-183. [ Links ]
NUHOGLU A and YALCIN B (2005) Modelling of phenol removal in a batch reactor. Proc. Biochem. 40 1233-1239. [ Links ]
ORUPOLD K, MASIRIN A and TENNO T (2001) Estimation of biodegradation parameters of phenolic compounds on activated sludge by respirometry. Chemosphere 44 1273-1280. [ Links ]
PRAMPARO L, SUÁREZ-OJEDA ME, PÉREZ J and CARRERA J (2012) Kinetics of aerobic biodegradation of dihydroxybenzenes by a p-nitrophenol-degrading activated sludge. Bioresour. Technol. 110 57-62. [ Links ]
ROS M (1993) Respirometry of Activated Sludge. Technomic Publishing Co., Inc. Basilea, Switzerland. 151 pp. [ Links ]
TZIOTZIOS G, TELIOU M, KALTSOUNI V, LYBERATOS G and VAYENAS DV (2005) Biological phenol removal using suspended growth and packed bed reactors. Biochem. Eng. J. 26 65-70. [ Links ]
VANROLLEHEM PA and GILLOT S (2002) Robustness and economic measures as control benchmark performance criteria. Water Sci. Technol. 45 117-126. [ Links ]
VAZQUEZ-RODRIGUEZ G, BEN-YOUSSEF C and WAISSMAN-VILANOVA J (2006) Two-step modeling of the biodegradation of phenol by an acclimated activated sludge. Chem. Eng. J. 117 245-252. [ Links ]
WANG S-J and LOH K-C (1999) Modeling the role of metabolic intermediates in kinetics of phenol biodegradation. Enzyme Microbiol. Technol. 25 177-184. [ Links ]
XIE W-M, NI B-J, SEVIOUR T, SHENG G-P and YU H-Q (2012) Characterization of autotrophic and heterotrophic soluble microbial product (SMP) fractions from activated sludge. Water Res. 46 6210-6217. [ Links ]
 Correspondence:
Edgardo M Contreras
+54 223 4816600 (Int. 242)
E-mail: edgardo.contreras@ing.unlp.edu.ar
Received 20 January 2013
Accepted in revised form 17 December 2013

