


Servicios Personalizados
Articulo
 Inglés (pdf)
 Articulo en XML
 Referencias del artículo
Indicadores

Links relacionados
-
 Citado por Google
 -
 Similares en Google
Compartir

 Permalink
Water SA
versión On-line ISSN 1816-7950
versión impresa ISSN 0378-4738
Water SA vol.39 no.5 Pretoria ene. 2013
Not so pristine - characterising the physico-chemical conditions of an undescribed temporarily open/closed estuary
T Kaselowski; JB Adams*
Department of Botany, Nelson Mandela Metropolitan University, PO Box 77000, Port Elizabeth, 6031, South Africa
ABSTRACT
A rapid ecological water requirement study of the Department of Water Affairs in 2009 classified the Goukamma Estuary as largely natural with few modifications, i.e., in an A/B state. However this detailed 13-month study showed that the estuary is impacted. Salinity stratification and hypoxic conditions (dissolved oxygen (DO) < 3 mgℓ-1) were measured during both open and closed mouth states. The Goukamma Estuary is a blackwater system and in its natural state is expected to be nutrient poor. However high nutrient concentrations were measured in the middle and upper reaches of the estuary, adjacent to cattle farms. Nutrient concentrations represented mesotrophic (DIN > 500 µg·ℓ-1) to eutrophic conditions (DIP > 25 µg·ℓ-1). Nutrient input stimulated microalgae to attain a high biomass, ranging between 0.3 and 112 µg·ℓ-1 (average 7.7 ± 1.3 µg·ℓ-1) and 0.8 and 289 µg·ℓ-1 (average 21.1 ± 4.4 µg·ℓ-1) during the open and closed mouth states, respectively. Exacerbated by natural salinity stratification which effectively limits oxygenation of the water column, unnaturally high nutrient concentrations, microalgal blooms and coinciding organic loads all indicate poor water quality of the Goukamma Estuary. This research showed that detailed studies involving field measurements of water quality are required before the present health status of an estuary can be assessed.
Keywords: Temporarily open/closed estuaries, blackwater system, water quality, stratification, hypoxia, DIN, DIP, microalgae biomass
INTRODUCTION
Situated at the interface between fresh- and marine waters, estuaries are among the most biologically productive ecosystems in the world and are of great ecological and economic importance (Turpie and Clarke, 2007; Shimmield 2012). Yet, these water bodies are becoming some of the world's most threatened habitats (Elsdon et al., 2009). Characterised by their natural complexity, estuaries face degradation due to human-induced alterations to their dynamic variability (De Villiers and Thiart, 2007; McQuatters-Gollop et al., 2009; Robertson and Funnell, 2012). Nutrient over-enrichment is considered to be one of the most serious human-induced impacts on estuaries (Heisler et al., 2008; Costa et al. 2009; Robertson and Funnell, 2012).
Nutrient over-enrichment is mainly associated with the input of excessive amounts of nutrients, which leads to a buildup of organic material. During bacteriological decomposition of the latter, oxygen demand in the water column exceeds the oxygen supply and typically results in oxygen-deficient conditions, termed hypoxia (DO < 3 mgℓ-1) and anoxia (DO = 0 mgℓ-1) (McQuatters-Gollop et al., 2009; Shimmield, 2012; Cowie and Woulds, 2012). Hypoxia is directly linked to a degraded water quality, which holds numerous detrimental effects for the biota of the system (Barton and Sherwood, 2004; De Villiers and Thiart, 2007; Turpie and Clarke, 2007; Becker et al., 2009).
On the other hand, hypoxia can also be a natural phenomenon. In estuaries, water circulation processes (e.g. mixing, flushing and retention times) are responsible for regulating overall water quality characteristics (Snow and Taljaard, 2007; Taljaard et al., 2009a,b). In microtidal estuaries, as opposed to meso- and macrotidal estuaries, flushing of the water column (associated with water replenishment) and mixing forces (associated with oxygenation of the water column via wind and tidal currents) are limited. Inflowing river water typically creates stratified conditions whereby the less dense freshwater flows over denser saline bottom water. Due to the difference in density between these two water layers, mixing of the water column is significantly limited and bottom water hypoxia commonly occurs under such highly stratified conditions (Kurup and Hamilton, 2002; Snow and Taljaard, 2007; Du Laing, 2012). This has been recorded in certain southern Australian estuaries, particularly in south-west Victoria (Barton and Sherwood, 2004), and during partial mouth breaching events, when the oxygenated surface water flows over the saline water, leaving behind the hypoxic bottom water (Becker et al., 2009).
South African temporarily open/closed estuaries (TOCEs) share similar hydrological and morphological characteristics to many south-west Victorian estuaries (intermittently closed/ open lakes and lagoons (ICOLLS)). Of the approximately 250 functional estuaries in South Africa (all are microtidal), 71% are classified as TOCEs. These systems are characterised by the presence of a berm (sandbar) at the mouth of the estuary, which separates it from the ocean for varying periods of time (Whitfield, 1992). In combination with marine sediment movement, the mouth of the estuary generally closes in response to periods of low river inflow whereas high river discharge causes the mouth to open. The conceptual model for water quality of South African TOCEs (Snow and Taljaard, 2007) proposes that during the open mouth state, physico-chemical gradients reflect a combination of that of the river (fresh) and seawater inflow. Nutrient concentrations are normally high and microalgae, in particular, increase with increasing nutrient concentrations. However, tidal exchange creates unstable physical conditions inside the estuary which disfavour the growth of microalgae and their biomass is typically low. In addition, tidal exchange tends to replenish the water column of oxygen and thus the probability of hypoxia occurring is low, except in deep saline pools where stratification effectively limits oxygenation. In the absence of marine input (associated with highly oxygenated conditions), wind mixing and inflowing river water (typically low if present) generally assume the role of oxygenation.
The Goukamma Estuary is classified as a microtidal TOCE which is situated in a relatively undisturbed catchment of 235 km2. Whitfield's (2000) bibliography indicates that the estuary is largely undescribed; there are no previous detailed studies on the system and the available information is listed as poor. A Department of Water Affairs Ecological Water Requirement study (DWA, 2009), as part of a larger Outeniqua study, completed a rapid low-confidence study on the Goukamma Estuary based on available information and one sampling trip. The present ecological status of the estuary was assessed as A/B, i.e., largely natural with only a few modifications (DWA, 2009), therefore close to pristine. Poor water quality (attributed to nutrient enrichment from agricultural effluent) and water abstraction were identified as the principal factors contributing to the degraded health of the estuary (DWA, 2009). The current study was designed to contribute to a better understanding of the health of the estuary. The response of the estuary to changes in mouth state was assessed by measuring abiotic characteristics (salinity, dissolved oxygen, dissolved inorganic phosphorus and dissolved inorganic nitrogen concentrations) and the biotic response (microalgal biomass and phytoplankton community composition).
STUDY AREA
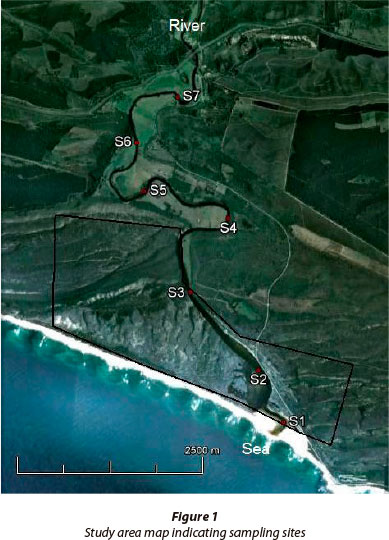
The Goukamma Estuary (34°04'39"S; 22°57'07"E) is situated in the south-eastern region of the Western Cape Province of South Africa (Fig.1). Its main tributary, the Goukamma River, drains the southern slope of the Outeniqua Mountain range and discharges into the ocean to the west of Buffalo Bay, a small coastal town approximately 10 km west of Knysna. The estuary meanders extensively throughout its length (approximately 9.2 km) and the channels are relatively narrow with an average width of 30-40 m in the upper and middle reaches while widening in the lower reaches to a maximum width of 200 m approximately 0.9 km from the mouth. The depth of the water column varies between 1 and 2 m, with deeper areas (3 to 6 m) in the middle and upper reaches (DWA, 2009). The lower reaches of the Goukamma Estuary (~ 4 km from the mouth) form part of the Goukamma Nature Reserve and Marine Protected Area (MPA) which falls within the jurisdiction of CapeNature. The terrestrial reserve (~ 2 241 67 ha) lies adjacent to the MPA (~ 2 600 ha) with which it shares a common boundary. The Goukamma Estuary spans a total area of 270 ha. Along the upper and middle reaches of the estuary there are farmlands (cattle) interspersed with pockets of indigenous vegetation and forestry plantations (mainly Pinus and Eucalyptus spp.). The mean annual runoff (MAR) to the estuary has been reduced from 57.5 x 10⁶ m3 under reference condition to 48.8 x 10⁶ m3 (85% of natural MAR) under the present state. Presently, off-channel consumption comprises 9% irrigation, 78% commercial afforestation and 13% uptake by alien vegetation (DWA, 2009). The Goukamma Estuary is a blackwater system and would naturally in its undisturbed state be oligotrophic (nutrient poor).
MATERIALS AND METHODS
Water column variables
Data were collected over a period of 13 consecutive months, from April 2010 - April 2011. There were a total of 9 sampling sites, 7 in the estuary located evenly along the estuary length and a river and sea site. The sea site was located within the boundaries of the Goukamma Marine Protected Area while Sites 1 - 3 were located within the Goukamma Nature Reserve. Samples of the water column of the estuary were analysed for physico-chemical parameters, nutrients, phytoplankton biomass and phytoplankton community composition. Physico-chemical readings were recorded at the sub-surface and thereafter at 0.5 m depth intervals until the bottom was reached. For the remaining analyses, water samples were collected at the sub-surface and near-bottom waters using a weighted pop-bottle. Only sub-surface water samples were collected for the river and sea sites. Furthermore, the mouth condition (open/ closed/semi-closed) was recorded on each day of sampling. In addition, daily rainfall measurements were recorded on site at the Goukamma Nature Reserve. A YSI 650 MPS multiprobe was used to record physico-chemical parameters at each sampling site within the estuary, with reference to salinity (ppt) and dissolved oxygen (DO: mgℓ-1).
Nutrient analyses
Replicate water samples were filtered through Millipore nutrient filters (0.45 µm pore size), stored in 150 mℓ pharmaceutical bottles and frozen until analyses could commence. The samples were analysed for total oxidised nitrogen (TOxN) using the reduced copper cadmium method as described by Bate and Heelas (1975). Ammonium (NH4+) and soluble reactive phosphorus (SRP) were analysed using standard spectrophotometric methods described by Parsons et al. (1984). All analyses were done within 2 weeks of sampling.
Sediment moisture and organic content
Replicate subtidal sediment samples were collected from each of the sampling sites and stored in the dark at ~4°C until processing in the laboratory. Approximately 10 g of sediment was weighed and placed in crucibles, and dried at 105°C for 24 h. The dry weight was measured and the loss of weight used to calculate the moisture content (%) of the sample. Subsequently, the samples were ashed in a furnace at 550°C for 8 h and weighed again. Organic content (%) was calculated as the loss of weight of the sample (Briggs, 1977).
Phytoplankton biomass
Phytoplankton biomass (measured as chlorophyll a concentrations) was measured by collecting replicate water samples of 500 mℓ at the sub-surface and near-bottom waters at each site using a weighted pop-bottle. The samples were gravity-filtered through plastic Millipore towers using Whatman (GF/C) glass-fibre filters and were frozen until analyses could commence. Chlorophyll a was extracted by placing the frozen filters into glass vials containing 10 mℓ of 95% ethanol (Merck 4111). The samples were stored in a cool, dry place at 1 to 2°C for 24 h. After extraction, the contents of the vials were once again filtered and spectrophotometric determinations of chlorophyll a were performed according to Nusch (1980). Absorbance was measured at 665 nm before and after acidification with 0.1 N HCl. The following equation was used to calculate phytoplank-ton biomass:
Chl-a (µgℓ-1) = (Eb665 - Ea665) x 29.6 x (v/(Vxl))
where:
Eb665 = absorbance at 665 nm before acidification
Ea665 = absorbance at 665 nm after acidification
29.6 = constant calculated from the maximum acid ratio (1.7) and the specific absorption coefficient of Chlorophyll a in ethanol (82 gℓ-1cm-1)
v = volume of solvent used for the extraction (mℓ)
V = volume of the sample filtered (l)
l = path of spectrophotometer cuvette (cm)
Phytoplankton community composition
Single water samples of 200 mℓ were collected from the subsurface and near-bottom waters at each sampling site within the estuary. The samples were preserved with glutaraldehyde. The Coulon and Alexander (1972) method was used to settle 60 mℓ of the sample overnight in 26.5 mm diameter settling chambers and 6 drops of Rose Bengal were added to stain the cells. After settling, a Zeiss IM 35 inverted microscope was used to count and identify the microalgal groups at maximum magnification of 630 x, during which either a minimum of 200 frames (3.142 mm2 in diameter) or 200 cells were counted. The cells were classified according to different algal groups, i.e., diatoms, flagellates, dinoflagellates, green and blue-green algae (cyanobacteria), and coccolithophorids. The actual counts for the different groups were calculated using the following equation (Snow et al., 2000):
Cells mℓ-1 = ((πr2)/A) x C/V
where:
A = area of each frame (mm2)
C = number of cells in each frame
V = volume of sample in settling chamber (mℓ)
Statistical analyses
Data were analysed using Statistica (Version 8). After testing the data for normality and homogeneity of variance, one-way ANOVA was used to compare significant differences between parametric data sets followed by a post-hoc Tukey's test for multiple comparisons. For non-parametric data, the Mann-Whitney Rank Sum test was used for the comparison of two data sets. Spearman Rank Order Correlation (non-parametric) and Pearson's Product Moment Correlation (parametric) were used to test the strength of the association between variables. All analyses were done at α = 0.05.
RESULTS
During the 13-month study period, 8 open and 5 closed mouth states were recorded. The mouth state was significantly correlated with the monthly amount of rainfall received; open mouth states were associated with rainfall greater than ~ 48 mm (p < 0.05) and closed states with lower rainfall (~ 27.6 mm; p < 0.05).
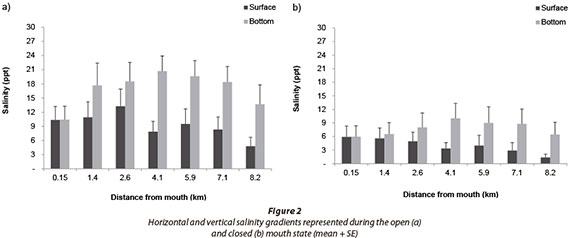
Salinity data showed that the bottom layer was significantly more saline than the surface layer during both open (F = 19.19; p < 0.05; n = 112) and closed (F = 9.23; p < 0.05; n = 56) mouth states (Fig. 2). There was a significant positive correlation between salinity and depth during the open (p < 0.05; n = 303) and closed mouth states (p < 0.05; n = 198).
Dissolved oxygen concentrations showed marked vertical and horizontal gradients throughout the study period (Fig. 3). There were significantly higher DO concentrations in the surface layers and lower reaches of the estuary (p < 0.05) during both mouth states. During the open state, DO concentrations differed significantly between sites (F = 10.58; p < 0.05; n = 56). Post hoc analyses revealed that Site 1 (~ 7.1 mgℓ-1) had the highest DO concentration and Site 6 (~ 2 mgℓ-1) the lowest. During the closed mouth state, the bottom layers differed significantly between sites (F = 13.39; p < 0.05; n = 28). Similar to the open state, post-hoc analyses indicated that Site 1 (~ 7.5 mgℓ-1) had the highest DO concentration and Site 6 (~ 1.63 mgℓ-1) the lowest. Sites with DO concentrations less than 3 mgℓ-1 were recorded from 4.1 to 8.2 km from the mouth (Site 4 to Site 7). Dissolved oxygen concentrations decreased significantly with depth during both open (p < 0.50; n = 198) and closed mouth states (p < 0.05; n = 301). During the open mouth state, the maximum depth was recorded at 4.9 m (4.1 km from the mouth) and hypoxic conditions were recorded 100% of the time at a depth of 4.5 m (Fig. 4). During the closed state, the maximum depth was recorded at 5.5 m (4.1 km from the mouth) and hypoxic conditions were recorded 100% of the time at depths greater than 3.5 m. Moreover, DO concentrations decreased significantly with increasing salinity during both open (p < 0.05; n = 303) and closed mouth states (p < 0.05; n = 198).


Soluble reactive phosphorus (SRP) concentrations during the open mouth state ranged between 0.1 and 4.9 µΜ (~ 0.7 ± 0.1 µM; n = 128) (Fig. 5). There was a significant positive correlation between DIP concentrations and distance from the mouth (R = 0.25; p < 0.05; n = 128) and a significant difference between sites (F = 2.59; p < 0.05; n = 128). The highest concentration was recorded at Site 7 (~ 1.1 µΜ) and the lowest at Site 1 (~ 0.5 µΜ). During the closed mouth state SRP concentrations ranged between 0.2 and 7.9 µΜ (~ 0.8 ± 0.2 µΜ; n = 80). Concentrations showed neither a significant correlation with distance from mouth nor a difference between sites. However, Site 6 (~ 1.7 µΜ) had the highest concentrations and Site 1 (~0.4 µΜ) the lowest (p > 0.05).

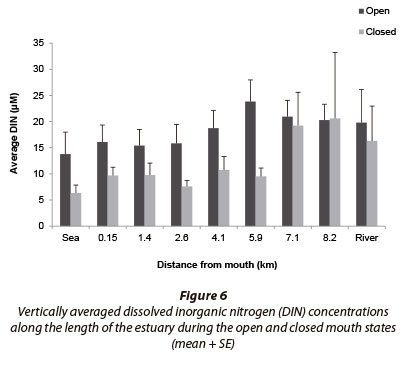
Dissolved inorganic nitrogen concentrations (DIN; total of TOxN + NH4+) differed significantly between mouth states (p < 0.05; n = 208), with higher concentrations recorded during the open mouth state (~ 18.5 µΜ) and lower concentrations during the closed mouth state (~ 12.3 µΜ) (Fig. 6). During the open mouth state, DIN concentrations ranged between 1.5 and 63.3 µΜ (~ 18.5 ± 1.21 µΜ; n = 128) while during the closed mouth state, concentrations ranged between 1.3 and 133.3 µΜ (~ 12.3 ± 1.9 µΜ; n = 80).
Chlorophyll a concentrations showed a significant difference between mouth states (F = 12.04; p < 0.05; n = 208) (Fig. 7). Higher concentrations were recorded during the closed mouth states (~ 21.1 µgℓ-1) and lower concentrations during open mouth states (~ 7.7 µgℓ-1). Microalgal blooms (> 20 µgℓ-1) were occasionally recorded within the surface and bottom layers during both mouth states (Table 1). Only during the closed mouth state did chlorophyll a concentrations show a significant positive correlation with distance from mouth (p < 0.05; n = 80). The highest concentration was recorded at Site 6 (7.1 km from the mouth; ~ 54.8 µgℓ-1) and the lowest at the sea site (~ 4.7 µgℓ-1).


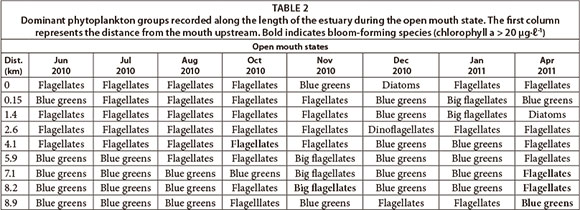
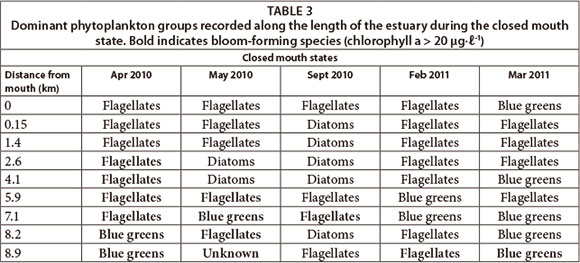
The dominant phytoplankton groups recorded were summarised based on open (Table 2) and closed mouth states (Table 3). During the open mouth state, cyanobacteria were dominant (~ 10 424 cells mℓ-1) followed by flagellates (~ 1 741 cells mmℓ-1). There was a positive correlation between the abundance of cyanobacteria and distance from the mouth (p < 0.05; n = 128). There was also a significant difference in their abundance between sites (F = 2.8; p < 0.05; n = 128). The river site had the highest cell density of cyanobacteria (p < 0.05) which corresponds to the significant negative correlation with salinity (p < 0.05) and positive correlation with TOxN (p < 0.05). Cyanobacteria cell density decreased towards the lower saline reaches but peaked at Site 2 (~ 5 933 cells mℓ-1). In this region, prolific growth of the macroalgae Cladophora glomerata (Linnaeus Kützing), as well as slight nutrient peaks, had also been observed. During the closed mouth state, flagellates (~ 4 902 cells-mℓ-1) and diatoms (~ 2 230 cells mℓ-1) were dominant. Cyanobacteria were occasionally recorded in the upper reaches of the estuary.
There was a significant difference in sediment organic content between subtidal sites (p < 0.05; n = 98) (Fig. 8). This was highest at 7.1 km from the mouth, at Site 6 (~ 8.4%) and lowest at Site 2 (~ 1.4%). At Site 6 high nutrient concentrations were recorded during both mouth states. This site also had the lowest average DO concentration and the highest phytoplankton biomass (all significant at p < 0.05) throughout the study, during both open and closed mouth conditions. Field investigations showed that this site represented a point source input to the estuary from the adjacent farmland, in the form of a drainage channel.

DISCUSSION
South African TOCEs are typically characterised by the dynamic fluctuation in salinity and water level in response to the magnitude of river inflow (Harrison, 2004; Snow and Taljaard, 2007). Long and cross-shore sediment movement influenced by wind and wave action, together with periods of low rainfall and river inflow, cause the mouth of the estuary to close. Conversely, during high river inflow when the water level exceeds the height of the berm, the mouth breaches and the estuary reverts to an open state (Snow and Taljaard, 2007). During this study the Goukamma Estuary was predominantly in an open mouth state which coincided with above-average rainfall and, consequently, higher river inflow, while closed mouth states were associated with periods of low rainfall.
Salinity stratification develops as a result of the difference in density between the inflowing fresh and saline water. The Goukamma Estuary showed strong horizontal and moderate vertical stratification in both open and closed mouth states as the river provided a sustained freshwater inflow to the estuary. Vertical stratification was more pronounced in the deeper channel-like middle and upper reaches. In the shallow lower reaches, salinity gradients were weak, probably as a result of wind mixing, which is more effective in shallow areas with a large surface area. Similarly, Snow et al. (2000) and Kotsedi et al. (2012) recorded highly stratified conditions within the channel-like Gamtoos and Sundays estuaries, partly because of the limited influence of wind-mixing.
In highly stratified conditions, haloclines effectively prevent the entrainment of oxygenated fresh surface water into the more saline bottom water and typically result in bottom water hypoxia (Diaz, 2002; Franco et al., 2002; Kurup and Hamilton, 2002; Barton and Sherwood, 2004; Snow and Taljaard, 2007; Becker et al., 2009; Du Laing, 2012). In the Goukamma Estuary, DO concentrations displayed a marked vertical stratification during both mouth states, with surface layers significantly more oxygenated than bottom layers (p < 0.05). Hypoxic conditions, and occasionally anoxia, were also recorded during both mouth states when vertical stratification was a prominent feature.
In June 2010 the mouth opened for the first time during the study following heavy rains (75 mm) 2 weeks prior to sampling. At this time, sub-surface salinity of Sites 4 - 7 was fresh (< 4 ppt) with DO concentrations greater than 8 mgℓ-1, while below the halocline the water column was completely hypoxic. This showed that runoff from the 75 mm rainfall event was insufficient for proper flushing; rainfall was sufficient to rapidly breach the mouth, allowing the freshwater to flow over the denser saline water and into the sea but without proper mixing. A similar effect is displayed in the highly stratified south-west Victorian estuaries in which deep water hypoxia commonly occurs, as well as in Fjord systems in Europe (Du Laing, 2012). During this time, these estuaries are at particular risk as most estuarine biota require DO concentrations greater than 5 mgℓ-1 to survive, while lower concentrations could lead to mass mortality (Barton and Sherwood, 2004). Becker et al. (2009) also recorded this 'shearing-effect' in the Surrey Estuary, and DO concentrations only began to increase following intrusion of marine water.
The Goukamma River is classified as a blackwater system which, if undisturbed, would reside in a nutrient-poor state (oligotrophic) (DWA, 2009) similar to the adjacent ocean (Van Ballegooyen et al., 2007). In addition, blackwater systems also have very low concentrations of suspended sediment and the channels mainly comprise coarse-grained sediment particles which typically have a low adsorption capacity. Microalgae and organic material loads in the estuary would therefore be limited (Bilotta and Braziera, 2008; DWA, 2009). Farming activities in the catchment were expected to elevate nutrient levels, especially DIN, in the water entering the estuary (DWA, 2009), as studies conducted in February (2008) and June (1994) found slight peaks in DIN concentrations in the middle reaches of the estuary. This was mainly attributed to the seepage of nutrients from agricultural lands along the banks of the estuary (DWA, 2009). Results indicate that nutrient concentrations recorded in the Goukamma Estuary during this study significantly exceeded predetermined concentrations and ranged within mesotrophic (DIN) to eutrophic (SRP) conditions.
The concentration of DIN and SRP recorded in the water column partly reflects the rate of uptake by primary producers (Thomas et al., 2005; Snow and Taljaard, 2007). A low nutrient concentration could indicate rapid uptake by primary producers or depletion of a particular nutrient which limits primary production. Nevertheless, the net effect of nutrients in estuaries is mainly influenced by flushing mechanisms and water retention times which are regulated by the magnitude of river inflow (Cloern, 2001; Snow et al., 2000; Bate et al., 2002; Taljaard et al., 2009a). During the open mouth state, nutrients tend to attain greater concentrations due to the input from both river and seawater; however, shorter retention times associated with this mouth state limit the growth of microalgae and the biomass is typically low. During the closed mouth state, nutrient concentrations are lower in response to decreased runoff and exclusion of marine input; however, longer retention times favour the growth of microalgae and therefore greater biomass (Snow and Taljaard, 2007). This has been documented in various studies (e.g. Adams and Bate, 1999; Froneman, 2002; Perissinotto et al., 2003; Anandraj et al., 2008), including this study in the Goukamma Estuary. During the open mouth state, phyto-plankton biomass was low (~7.7 µgℓ-1) when nutrient concentrations were high, as opposed to the closed mouth state during which the phytoplankton biomass was greater (~ 21.1 µgℓ-1) and nutrient concentrations were lower.
Microalgal blooms indicate the input of excessive amounts of nutrients (Nixon, 1995; Cloern, 2001; Webster and Harris, 2004; Heisler et al., 2008). Throughout the study period, blooms (chlorophyll a > 20 µgℓ-1) were recorded within the surface and bottom layers during both open and closed mouth states. Stratification tends to favour the formation of blooms by retaining phytoplankton inside the estuary (Hilmer, 1990; Cloern, 2001; Kotsedi et al., 2012). A sustained river flow is also likely to provide a continuous supply of nutrients to the estuary and maintain a certain level of pelagic primary production (Jickells, 2005; Snow and Taljaard, 2007). Seepage from agricultural lands and elevated nutrient concentrations recorded in the Goukamma River would also have been mainly responsible for elevating the level at which primary production was maintained in the estuary.
Throughout the study, dinoflagellates were dominant in the saline bottom water of the stratified middle and upper reaches of the estuary where retention times were longer. Cyanobacteria attained high cell concentrations especially in the upper reaches of the estuary where farming activities are concentrated. Cyanobacteria indicate high nutrient concentrations in freshwater conditions (Garofalo, 2011). Dinoflagellates have been found to be dominant when nutrient concentrations are high and during stable stratified conditions (Margalef, 1978; Adams and Bate, 1999; Lee et al., 2003). Thus, the occurrence of both these phytoplankton groups confirms nutrient enrichment in these reaches of the estuary.
This research concluded that detailed studies particularly related to water quality are required before the present health status of an estuary can be assessed. The study showed that vertical stratification effectively limited oxygenation of the water column below the halocline and partly contributed to the formation of bottom water hypoxia and anoxia in the middle and upper reaches of the estuary. Nutrient concentrations during this study were significantly elevated, being mesotrophic to eutrophic, which resulted in prolific microalgal growth and high biomass. Nutrient concentrations were especially high in the middle and upper reaches of the estuary, which was attributed to seepage from farmlands and exacerbated by the severe reduction (~ 50%) of the riparian buffer zone, mainly due to clearing. The predominance of cyanobacteria and high phytoplankton biomass in the upper reaches of the estuary confirms the input of excessive nutrient concentrations. In an environmental water requirements study in 2008, the ecological status of the Goukamma Estuary was classified as natural with a few modifications. However this study has shown that the estuary shows signs of eutrophication (low oxygen, high nutrient concentrations and microalgal biomass) and the estuary is certainly not pristine. The water quality would fall more into a Category D (largely modified). The implementation of mitigation measures in conjunction with a sound monitoring programme are needed to alleviate threats currently facing the estuary. The riparian buffer zone needs to be re-established to aid in nutrient attenuation and artificial wetlands should be established at point-source inputs such as that identified at Site 6. These recommendations have been passed on to CapeNature which is responsible for the management of the estuary. On a national scale agricultural run-off and subsequent eutrophica-tion poses a significant threat to South African estuaries and requires detailed investigation.
ACKNOWLEDGEMENTS
Funding for this research was provided by the National Research Foundation (NRF). We also thank CapeNature for research permission, Gavin Snow and Lucienne Human for assistance in the laboratory and Monique Nunes for assistance in the field.
REFERENCES
ADAMS JB and BATE GC (1999) Primary producers. Estuarine micro-algae. In: Allanson BR and Baird D (eds.) Estuaries of South Africa. Cambridge University Press, Cambridge. 91-101.
ANANDRAJ A, PERISSINOTTO R, NOZAIS C, and STRETCH D (2008) The recovery of microalgal production and biomass in a South African temporarily open/closed estuary, following mouth breaching. Estuar. Coast. Shelf Sci. 79 599-606. [ Links ]
BARTON J and SHERWOOD J (2004) Estuary opening management in Western Victoria: An information analysis. Parks Victoria Technical Series No. 15. Parks Victoria, Melbourne. [ Links ]
BATE GC and HEELAS (1975) Studies on the nitrate nutrition of two indigenous Rhodesian grasses. J. Appl. Ecol. 12 941-952. [ Links ]
BATE GC, WHITFIELD AK, ADAMS JB, HUIZINGA P and WOOL-DRIDGE TH (2002) The importance of the river estuary interface (REI) zone in estuaries. Water SA 28 271-279. [ Links ]
BECKER A, LAURENSON LJB and BISHOP K (2009) Artificial mouth opening fosters anoxic conditions that kill small estuarine fish. Estuar. Coast. Shelf Sci. 82 566-572. [ Links ]
BRIGGS D (1977) Sources and Methods in Geography. Butterworths, London. 123 pp. [ Links ]
CLOERN JE (2001) Our evolving conceptual model of the coastal eutrophication problem. Mar. Ecol. Prog. Series 210 223-253. [ Links ]
COSTA LS, HUSZAR VLM and OVALLE AR (2009) Phytoplankton functional groups in a tropical estuary: hydrological control and nutrient limitation. Estuar. Coast. 32 508-521. [ Links ]
COULON C and ALEXANDER V (1972) A sliding-chamber phytoplankton settling technique for making permanent quantitative slides with applications in fluorescent microscopy and autoradiography. Limnol. Oceanogr. 17 149-152. [ Links ]
COWIE G and WOULDS C (2012) Chapter 4.03 Tracer studies of benthic communities and biogeochemical processes in coastal and estuarine marine environments. In: McLusky D and Wolanski E (eds.) Treatise on Estuarine and Coastal Science (1st edn.). Elsevier, Oxford. 4590 pp. [ Links ]
DE VILLIERS S and THIART C (2007) The nutrient status of South African rivers: concentrations, trends and fluxes from the 1970's to 2005. S. Afr. J. Sci. 103 343-349. [ Links ]
DIAZ RJ (2002) Hypoxia and anoxia as global phenomena. In: Thurston RV (ed.) Proceedings, 6th International Symposium, Fish Physiology, Toxicology and Water Quality, Hypoxia in the Aquatic Environment, La Paz, Baja California, Mexico, January 2001. EPA Rpt. No. EPA/600/R-02/097. United States Environmental Protection Agency, Ecosystems Research Division, Athens, Georgia. URL: http://nepis.epa.gov/Exe/ZyNET.exe/P1000FP9.TXT?ZyActionD=ZyDocument. [ Links ]
DU LAING G (2012) Chapter 4.05 Redox metal processes and controls in estuaries. In: McLusky D and Wolanski E (eds.) Treatise on Estuarine and Coastal Science (1st edn.). Elsevier, Oxford. 4590 pp. [ Links ]
DWA (DEPARTMENT OF WATER AFFAIRS, SOUTH AFRICA) (2009) Reserve Determination studies for selected surface water, groundwater, estuaries and wetlands in the Outeniqua (Groot Brak and other water resources, excluding wetlands) catchment: Ecological Water Requirements Study - Estuarine RDM Report: Goukamma Assessment. Report No. RDM/K10-K30, K40E/00/ CON/0407. Department of Water Affairs, Pretoria. [ Links ]
ELSDON TS, DE BRUIN MBNA, DIEPEN NJ and GILLANDERS BM (2009) Extensive drought negates human influence on nutrients and water quality. Sci. Total Environ. 407 3033-3043. [ Links ]
FRANCO J, ASPILLAGA E, MUXIKA I, PÉREZ V, SOLAUM O and BORJA A (2002) Hypoxia and anoxia in small temperate estuaries: Patterns of oxygen deficiency, effects, and recovery. In: Thurston RV (ed.) Proceedings, 6th International Symposium, Fish Physiology, Toxicology and Water Quality, Hypoxia in the Aquatic Environment, La Paz, Baja California, Mexico, January 2001. EPA Rpt. No. EPA/600/R-02/097. United States Environmental Protection Agency, Ecosystems Research Division, Athens, Georgia. URL: http://nepis.epa.gov/Exe/ZyNET.exe/P1000FP9.TXT?ZyActionD=ZyDocument. [ Links ]
FRONEMAN PW (2002) Seasonal variations in selected physico-chemical and biological variables in the temporarily open/closed Kasouga estuary (South Africa). Afr. J. Aquat. Sci. 27 117-123. [ Links ]
GAROFALO R (2011) Algae and aquatic biomass for a sustainable production of 2nd generation biofuels. (AquaFUELs). Proposal No. AQUAFUEL FP7 - 241301-2. Coordination Action FP7-ENERGY-2009-1. Aquafuels Project, European Biodiesel Board (EBB), Brussels. URL: http://www.aquafuels.eu/attach-ments/079 Merged%20reports%20-Taxonomy Biology%20&%20Biotechnology.pdf [ Links ]
HARRISON TD (2004) Physico-chemical characteristics of South African estuaries in relation to the zoogeography of the region. Estuar. Coast. Shelf Sci. 61 73-87. [ Links ]
HEISLER J, GLIBERT PM, BURKHOLDER JM, ANDERSON DM, COCHLAN W, DENNISON WC, DORTCH Q, GOBLER CJ, HEIL CA, HUMPHRIES E, LEWITUS A, MAGNIEN R, MARSHALL HG, SELLNER K, STOCKWELL DA, STOECKER DK and SUDDLESON Μ (2008) Eutrophication and harmful algal blooms: a scientific consensus. Harmful Algae 8 3-13. [ Links ]
HILMER T (1990) Factors influencing the estimation of primary productivity in small estuaries. PhD thesis, University of Port Elizabeth. 154 pp. [ Links ]
JICKELLS T (2005) External inputs as a contributor to eutrophication problems. J. Sea Res. 54 58-69. [ Links ]
KOTSEDI D, ADAMS JB and SNOW GC (2012) The response of microalgal biomass and community composition to environmental factors in the Sundays Estuary. Water SA 38 177-190. [ Links ]
KURUP RG and HAMILTON DP (2002) Flushing of dense, hypoxic water from a cavity of the Swan River Estuary, Western Australia. Estuaries 25 (5) 908-915. [ Links ]
LEE H-O, KEUN-HYUNG C, and MYUNG-SOO H (2003) Spring bloom of Alexandrium tamarense in Chinhae Bay, Korea Chinhae Bay. Aquat. Microb. Ecol. 33 271-278. [ Links ]
MARGALEF R (1978) Life-forms of phytoplankton as survival alternatives in an unstable environment. Oceanologica Acta 1 493-509. [ Links ]
McQUATTERS-GOLLOP A, GILBER AJ, MEE LD, VERMAAT JE, HUMBORG C and WULFF F (2009) How well do ecosystem indicators communicate the effects of anthropogenic eutrophication? Estuar. Coast. Sci. 82 583-596. [ Links ]
NIXON SW (1995) Coastal marine eutrophication: a definition, social causes, and future concerns. Ophelia 41 199-219. NUSCH EA (1980) Comparison of different methods for chlorophyll and phaeopigment determination. Archiv fur Hydrobiologie, Beiheft Ergebnise der Limnologie 14 14-36. [ Links ]
PAERL HW, VALDES LM, PEIERLS BL, ADOLF JE and HARDING LW (2006) Anthropogenic and climatic influences on the eutro-phication of large estuarine ecosystems. Limnol. Oceanogr. 51 448-462. [ Links ]
PARSONS TR, MAITA Y and LALLI CM (1984) A Manual of Chemical and Biological Methods for Seawater Analysis. Pergamon Press, New York. 173 pp. [ Links ]
PERISSINOTTO R, NOZAIS C, KIBIRIGE I and ANADRAJ A (2003) Planktonic food webs and benthic-pelagic coupling in three South African temporarily open/closed estuaries. Acta Oecol. 24 307-316. [ Links ]
ROBERTSON HA and FUNNELL EP (2012) Aquatic plant dynamics of Waituna Lagoon, New Zealand: trade-offs of managing opening events of a Ramsar site. Wetlands Ecol. Manage. 20 (5) 433-445. [ Links ]
SHIMMIELD G (2012) Introduction to geochemistry of estuaries and coasts. Chapter 4.01. In: McLusky D and Wolanski E (eds.) Treatise on Estuarine and Coastal Science (1st edn.). Elsevier, Oxford. 4590 pp. [ Links ]
SNOW GC and TALJAARD S (2007) Water quality in South African temporarily open/closed estuaries: a conceptual model. Afr. J. Aquat. Sci. 32 (2) 99-111. [ Links ]
SNOW GC, BATE GC and ADAMS JB (2000) Effect of river flow on estuarine microalgal biomass and distribution. Estuar. Coast. Shelf Sci. 50 255-266. [ Links ]
STATSOFT Inc. (2011) STATISTICA (data analysis software system), version 10.1. URL: http://www.statsoft.com. [ Links ]
TALJAARD S, SNOW G, GAMA P and VAN NIEKERK L (2009a) Verification of a conceptual model of water quality for small temporarily open/closed estuaries: East Kleinemonde Estuary, South Africa. Mar. Freshwater Res. 60 234-245. [ Links ]
TALJAARD S, VAN NIEKERK L and JOUBERT W (2009b) Extension of a qualitative model on nutrient cycling and transformation to include microtidal estuaries on wave-dominated coasts: Southern hemisphere perspective. Estuar. Coast. Shelf Sci. 85 407-421. [ Links ]
THOMAS CM, PERISSINOTTO R and KIBIRIGE I (2005) Phyto-plankton biomass and size structure in two South African eutrophic, temporarily open/closed estuaries. Estuar. Coast. Shelf Sci. 65 223-238. [ Links ]
TURPIE J and CLARK B (2007) Development of a conservation plan for temperate South African estuaries on the basis of biodiversity importance, ecosystem health and economic costs and benefits. Final report to CapeNature. Anchor Environmental Consultants, University of Cape Town, Cape Town. [ Links ]
VAN BALLEGOOYEN RC, TALJAARD S, VAN NIEKERK L, LAM-BERTH SJ, THERON AK and WEERTS SP (2007) Freshwater flow dependency in South African marine ecosystems: A proposed assessment framework and initial assessment of South African marine ecosystems. WRC Report No. KV 191/07. Water Research Commission, Pretoria. [ Links ]
WEBSTER IT and HARRIS GP (2004) Anthropogenic impacts on the ecosystems of coastal lagoons: modelling fundamental biogeo-chemical processes and management implications. Mar. Freshwater Res. 55 67-78. [ Links ]
WHITFIELD AK (1992) A characterization of South African estuaries. S. Afr. J. Aquat. Sci. 18 89-103. [ Links ] WHITFIELD AK (2000) Available scientific information on individual South African estuarine systems. WRC Report No. 577/3/00. Water Research Commission, Pretoria. 217 pp. [ Links ]
Received 12 November 2012
Accepted in revised form 15 August 2013
* To whom all correspondence should be addressed. +27 41 504 2429; fax: +27 41 583 2317; e-mail: janine.adams@nmmu.ac.za

