


Servicios Personalizados
Articulo
 Inglés (pdf)
 Articulo en XML
 Referencias del artículo
Indicadores

Links relacionados
-
 Citado por Google
 -
 Similares en Google
Compartir

 Permalink
Water SA
versión On-line ISSN 1816-7950
versión impresa ISSN 0378-4738
Water SA vol.39 no.4 Pretoria ene. 2013
On the use of electrical resistivity methods in monitoring infiltration of salt fluxes in dry coal ash dumps in Mpumalanga, South Africa
Innocent MuchingamiI, IV, *; Jacobus NelV; Yongxin XuI; Gideon SteylII; Kelley ReynoldsIII
IDepartment of Earth Sciences, University of the Western Cape, Bellville, South Africa
IIInstitute for Groundwater Studies, University of Free State, Bloemfontein, South Africa
IIIApplied Chemistry and Microbiology, Sustainability, Eskom Research, Technology and Development, Rosherville, South Africa
IVDepartment of Applied Physics, National University of Science and Technology, Bulawayo, Zimbabwe
VGCS Water & Environment (Pty) Ltd, Johannesburg, South Africa
ABSTRACT
One of the principal environmental concerns relating to coal combustion waste disposal is the potential for groundwater contamination from salt fluxes and trace elements that may be leached into the underlying groundwater system. Since changes in moisture and salt concentrations usually provide contrasts in electrical properties against the host media, electrical resistivity methods can be used to monitor ingression of solute plumes as well as to detect any preferential flow paths within the ash medium. In this study, 2D electrical resistivity tomography was used to monitor brine (10% NaCl) water ingression through the unsaturated zone of a dry coal ash dump at a power station, Mpumalanga, South Africa. This was after the initial laboratory determination of the relation between electrical resistivity and moisture/salt content for the ash dump. The results showed that infiltration plume progression was more pronounced in the vertical direction, suggesting that moisture movement is mainly due to gravitational pull. There was no evidence of preferential flow within the ash medium, although the different infiltration rates for different sites suggested different permeability within the unsaturated zone.
Keywords: coal ash dumps, brine infiltration, cementation factor, electrical resistivity tomography, time lapse survey
INTRODUCTION
Despite environmental concern, coal-fuelled thermal power stations remain the main sources of electricity generation in most developing countries. For instance, more than 90% of South Africa's electricity is generated from the combustion of coal (Kruger and Krueger, 2005). However, large quantities of solid residues (ash) remain after the combustion of coal during the electricity generation process. These large volumes of ash are disposed of in holding ponds or ash heaps, which are often referred to as ash dumps. The environmental impact of ash dumps consists of at least two aspects:
- emission and deposition of enormous amounts of coal ash, polluting air, water and soil with ash particles (including the problem of huge ash dumps); and
- leaching of microelements (including toxic heavy metals) as well as major salts from wastewater used for dust suppression.
Thus, there is a need to implement a close monitoring mechanism for the environmental impact assessment of the dangers associated with such ash dumps. However, in order to implement an efficient monitoring scheme, a thorough knowledge of the migration of solute fluxes within the ash dump is required.
Since changes in moisture and salt concentrations usually provide contrasts in electrical properties in the host media, electrical resistivity methods can be used as a tool in monitoring the progression of the water/salt plumes, as well as to detect any preferential hydraulic paths within the ash medium. Several studies have used electrical resistivity techniques to investigate changes in resistivity because of contaminant migration through the unsaturated zone (e.g., Greenhouse and Harris, 1983; Macfarlane et al., 1983; Bevc and Morrison, 1991; Muhktar et al., 2000; Abdullahi et al., 2011). Rogers and Kean (1980) reported successful monitoring of groundwater contamination at a fly ash disposal site. In particular, 2D electrical resistivity tomography (ERT) has frequently been used to monitor water infiltration into the soil or at waste disposal sites (e.g. Mukhtar et al., 2000). Barker and Moore (1998) reported a successful 2D ERT time-lapse survey for the infiltration of water in the unsaturated zone after 10 hours of irrigation in Birmingham, England. The same methods were also used to map unsaturated zone transport using the salt tracer methods (e.g. White, 1988; Bevc and Morrison, 1991; Kemna et al., 2002), and to delineate contaminant movement, (e.g. Osiensky and Donaldson, 1995; Benson et al., 1997; Atekwana et al., 2000; De la Vega et al., 2003 and Zume et al., 2006). ERT techniques can also be used to assess the flow of moisture in dry ash dumps, in order to develop an assessment of dynamic processes in the subsurface environment of the dump. Both natural infiltration processes and specifically designed tracer tests can be monitored over periods of time that can last from a few hours to several years (e.g. Arora et al., 2005).
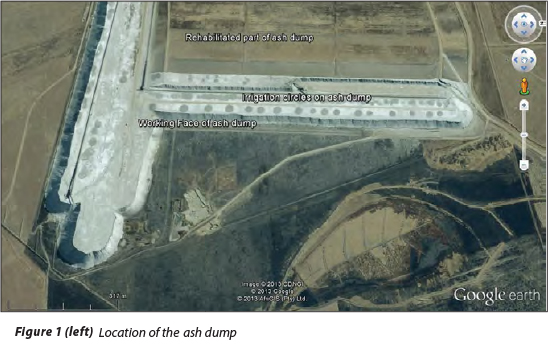
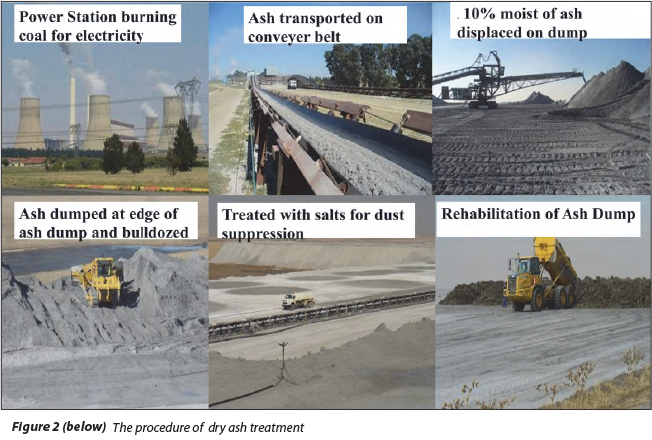
In this study, 2D ERT techniques were used in a time-lapse infiltration survey at a power station's dry ash dump, in Mpumalanga, South Africa (Fig. 1). The ash rehabilitation procedure at the ash dump is summarised in Fig. 2.
The main objective of this research was to develop a field monitoring technique that will enable the assessment of potential solute transport in the unsaturated zone dry ash dumps. The specific objectives were:
- to investigate the relationship between moisture content and electrical resistivity of the ash medium;
- to use electrical resistivity to monitor the infiltration pattern of injected brine water within the unsaturated zone of the ash dump;
- to investigate the main mechanisms of infiltration and potential contaminant transport in the ash dump; and
- to relate these patterns to the assessment of the flow paths for salt leachates into the ash dump.
MATERIALS AND METHODS
Correlation of electrical resistivity with salinity and moisture content
Electrical resistivity is often used to monitor salt leachate flow in coal ash dump, on the basis of a decrease in resistivity with leachate flow. Recently, the ERT method has proved to be efficient in monitoring moisture distribution during leachate flow at waste disposal sites (Moreau et al., 2003; Rosqvist et al. 2003; Guerin, 2004). However, no general relationship between electrical resistivity and moisture content has been reported for the coal ash medium, although Kean et al. (1987) showed that electrical resistivity techniques can be used to monitor leachate flow in dry ash dumps. Knowledge of the variation of electrical resistivity with salinity and moisture content of the ash medium is critical in assessing the suitability of the electrical methods in monitoring leachate flow in the ash medium.
Electrical resistivity is a function of textural and structural characteristics and is particularly sensitive to the water content of the geological formation (Arora and Shakeel, 2010). It is usually dependent on the degree of water saturation, amount of dissolved solids, content of the organic matter, grain shape of the matrix medium, and the mineral content of the soil or material forming the matrix medium. The fundamental empirical relationship for interpreting electrical resistivity measurements in the subsurface was developed by Archie (1942) when addressing the effects of saturation on the resistivity responses of unconsolidated materials by suggesting that resistance drops with increased water content according to an inverse power law (Eq. (1)):
![]()
where:
ρ is the measured resistivity of the ash medium
pw is the pore water resistivity of the infiltrating water
φ is the porosity (volumetric fraction of the medium filled with fluid)
a and m are two empirical parameters (Keller and Frischknecht, 1966)
The parameter, m, known as the cementation exponent, describes the inter-connectedness of the medium pore properties, and usually takes values of between 1 and 5 (Glover, 2010). Archie's law allows the correlation of electrical resistivity with saturation and porosity for the ash medium. The main procedure for establishing whether the electrical behaviour of a material is suitable for application of electrical resistivity methods is by establishing if its cementation factor falls within the ranges specified for Archie's law to hold. Grellier et al. (2005) showed that, in terms of soil moisture content, Archie's law can be reduced to Eq. (2):
![]()
where:
0w is the gravimetric moisture content of the medium
α is a parameter that includes the bulk density of the medium
The moisture content of the medium is determined using the standard formulae suggested in Bowles (1992) (Eq. (3)):
![]()
where:
M is the dry mass of the sample
Mf is the total mass of the wet sample
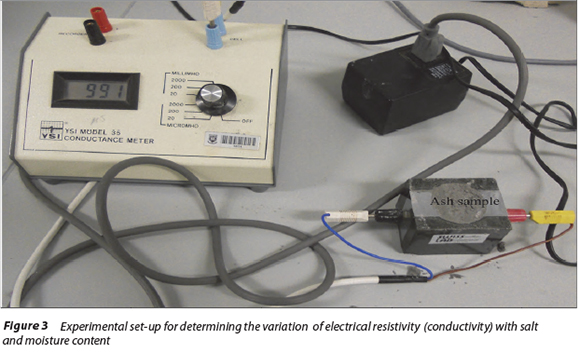
Variation of electrical resistivity with moisture content was achieved by determining the electrical conductance of each sample for which moisture content had previously been determined (Fig. 3). To ensure consistent results, the experimental procedure was also repeated using brine water used for ash irrigation.
The measured electrical conductivity values were converted to electrical resistivity (1/conductivity) and plots of variation of resistivity with moisture content for both still water and brine water were produced (Fig. 4). The value for the cementation exponent of the ash medium was then empirically determined from the plots.
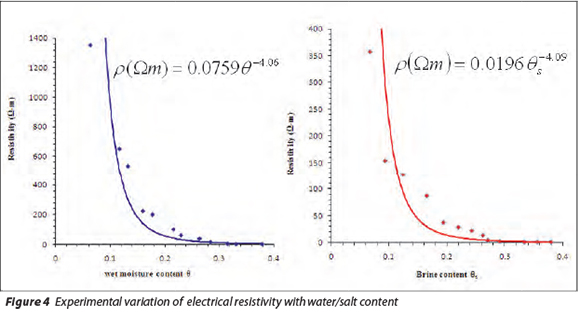
The results suggested an inverse power relation between electrical resistivity and both moisture and brine saturation content (Eqs. (4) and (5)) with the power exponent representing the cementation factor for the ash medium:
![]()
and
![]()
Such a high cementation factor is often associated with a medium with pore spaces that are less well connected (Tiab and Donaldson, 1996). This is in agreement with the conditions in the coal ash medium which are created by the pozzolanic reactions responsible for the partial cementation observed in the ash dump.
Tiab and Donaldson (1996) suggested that for a medium to meet the minimum conditions for application of Archie's law, the cementation factor should be between 1 and 5. As such, the ash medium matrix is in agreement with Archie's conditions and electrical-resistivity geophysical methods can be used as a reliable tool in characterisation of the transport properties of the ash dump.
Time-lapse infiltration survey using electrical resistivity tomography (ERT)
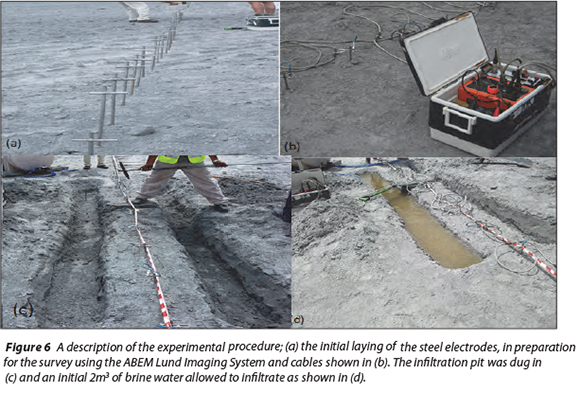
Time-lapse infiltration experiments were conducted on the ash dump and 2D electrical resistivity methods were used to monitor the rate of brine ingression through the unsaturated zone of the ash dump. The resistivity data acquisition system used for this survey was the ABEM Lund Imaging System (Dahlin, 1996) which uses an ABEM SAS 4000 terrameter and ES 10-64 switching unit, with 60 standard stainless steel electrodes and 4 multi-core cables with 20 electrode connection points for each cable.
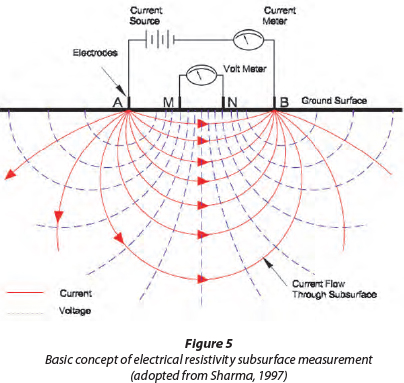
The electrical resistivity method consists of injecting an electrical current (I) through two metallic electrodes and measuring the potential difference (AV ) between two other electrodes. The apparent resistivity (ρ ) is given by the following relationship (Dahlin, 2001):
![]()
where:
K is a geometrical factor which only depends on electrode position. Ρ is the ratio of the potential obtained in situ with a specific array and a specific injected current to that which will be obtained with the same array and current for a homogeneous and isotropic medium of 1 Om resistivity.
The apparent resistivity measurements provide information about resistivity for a medium whose volume is proportional to the electrode spacing (Fig. 5).
The Wenner long and short measurement protocol, with an electrode spacing of 1 m for the long and 0.5 m for the short spacing, was employed for the survey so as to ensure that the field resistivity data were acquired with a high spatial resolution. In this protocol, the inner electrodes have a spacing equivalent to half the standard Wenner electrode separation, a, thereby ensuring a dense measuring network on the central region of the profile. A low-frequency (50 Hz) alternating current of 100 mA was used as the input current. The multicore cable was connected to a switching unit cascaded to a laptop computer (Fig. 6). The automatic data acquisition system made it possible to collect dense data sets for the survey. The sequence in which measurements are made, the type of electrode array that was being used for taking the measurements, and the value of the input current were entered on the switching unit of the switching unit. The time-lapse monitoring was conducted for a period of 48 h and the electrodes were left undisturbed with the same cable sequence being maintained during the whole survey (Fig. 6). ERT measurements were done at different time intervals of the survey. After 24 h, an additional 2 m3 of brine water was added into the trench in order to assess the effect of the volume of infiltrating brine on the rate of progression of the moisture plume through the unsaturated zone.
The apparent resistivity values were inverted using the time-lapse approach based on cross models implemented in the RES2DINV inversion software (Loke, 2000). The basis of a cross model is the use of an inverted model from a base dataset as the reference model for later datasets. Changes in subsurface resistivity were computed by using the apparent resistivity changes to ensure that changes in inverted resistivity values were only due to changes in apparent resistivity values. The inversion routine used is based on the smoothness constrained least squares technique (Loke and Barker, 1996). The program automatically creates a 2D model by dividing the subsurface into rectangular blocks, and chooses optimum inversion parameters for the data, which include the damping factor, vertical to horizontal flatness filter ratio, convergence limit and number of iterations. The resistivity of the model blocks is adjusted iteratively until the calculated apparent resistivity values of the model agree with the actual measurements.
Since time-lapse measurements are performed, changes in ERT images with time could easily be assessed by subtraction of pixel-by-pixel values from some background image. The model obtained from the first data set was used as a reference model for all of the later data sets. The least-squares smoothness constraint option was used to ensure that the differences in the model resistivity varied in a smooth manner. The data from time-lapse surveys conducted at different times was therefore inverted independently and the changes in the subsurface resistivity values were then determined by comparing the model resistivity values obtained from the inversions of an initial data set and the later time data and presented as the percentage change in the model resistivity. The inversion of the data sets was carried using a joint inversion technique where the model obtained from the initial technique was used to constrain the inversion of the later resistivity model (as described in Loke, 1999).
RESULTS AND INTERPRETATION
The distribution of the infiltrating brine in the subsurface of the ash dump was not very clear from a direct comparison of the inverse resistivity models alone; hence the percentage change in the subsurface resistivity of the subsequent models was used to show the ingression of the plume (Fig. 7). The first set of results obtained after 1.5 h from the start of the infiltration experiment showed that the plume had progressed to depths below 0.9 m (Fig. 7).
The models on the left in Fig. 7 represent the inverse model pseudo-sections taken at specific times as the plume was progressing in the ash dump, and the models on the right represent the percentage change in resistivity of that particular resistivity model with respect to the initial resistivity model. The percentage change models show areas of slight change (anomalies) on the flanks of the model. These spurious changes can be regarded as the result of noise or minute measuring fluctuations in the later time surveys. By using a time-constrained weighting scheme suggested in Loke (1999), these changes would be reduced at the expense of increasing the RMS misfit between the calculated and measured data.
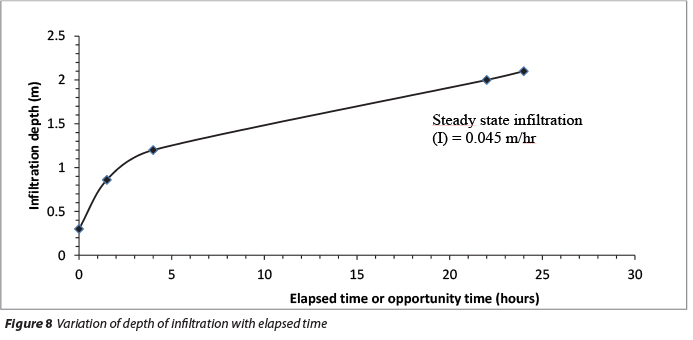
Although plume migration started shortly after the brine injection into the ash, the overall plume spreading behaviour was less pronounced, suggesting smaller unsaturated hydraulic conductivity values for the ash dump. The respective depths of the wetting front were plotted against survey time in order to obtain the infiltration rates (Fig. 8).
The infiltration rate was obtained by considering the method of an anisotropic model proposed in Amoozegar (1992). Using this approach, the vertical infiltration (I) rate is based on the centre-of-mass motion per Eq. (7):
![]()
As described earlier, an additional 2 m3 of brine water was poured into the infiltration trench in order to observe the effects of the volume of brine on the rate of progression of the moisture plume. The rate of progression of this plume increased abruptly soon after the addition of the extra brine, such that it had progressed to depths well below 6 m within a time interval of 42 h from the start of the survey (Fig. 9).
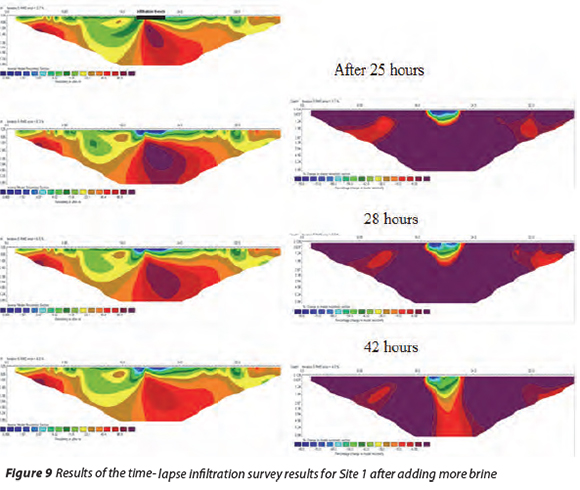
After the addition of the extra brine, the infiltration rate was calculated using Eq. (7) as I= 3.85 m/day. This sudden increase in infiltration rates suggested that the field capacity of the ash dump had been exceeded and brine water was infiltrating at a much faster rate. Field capacity is the maximum amount of water that a soil or rock can hold, by capillary action, before the water is drawn away by gravity. However, the infiltration was most pronounced in a vertical direction, indicating that gravity is the main driver of moisture and solute transport in the ash dump.
CONCLUSIONS
Changes in resistivity were correlated to changes in moisture content during moisture and salt leachate ingression for a coal ash medium, and the relationship was successfully used to evaluate the conductivity of fluid through the ash dump. The high cementation factor obtained for the ash medium is generally associated with a medium with pore spaces that are less well connected (Tiab and Donaldson, 1996). The experimental results offered information on the use of resistivity methods as a suitable tool for monitoring moisture and salt flow in the ash dump. Two-dimensional electrical resistivity profiles assisted in the elucidation of flow paths and brine dispersion in the ash dump.
Solute infiltration in the ash dump was estimated by considering the distance travelled by the brine plume over the time spanned by the investigations. Vertical infiltration is more pronounced than horizontal infiltration, indicating that gravity effects are the main forces behind brine infiltration, especially when the field capacity of the ash dump has been exceeded. The results offer no evidence of preferential flow, suggesting that the unsaturated zone of dry ash dumps is homogeneous. The results of the study are useful in the development of suitable hydrological models which could be used to obtain estimates of the spatial progression of any salt plumes through the ash medium, thereby assisting in assessing the potential pollution of both surface water and groundwater bodies within the influence of the ash dump.
ACKNOWLEDGEMENTS
The authors are grateful to ESKOM Holdings, who provided support in carrying out the field work.
REFERENCES
ABDULLAHI NK, OSAZUWA IB and SULE PO (2011) Application of integrated geophysical techniques in the investigation of groundwater contamination: A case study of municipal solid waste leachate. Ozean J. Appl. Sci. 4 (1) 7-25. [ Links ]
AMOOZEGAR A (1992) Compact constant head permeameter: A convenient device for measuring hydraulic conductivity. In: Topp GC, Reynolds WD and Green RE (eds.) Advances in Measurement of Soil Physical Properties: Bringing Theory into Practice. SSSA Special Issue 30 SSSA, Madison. 31-42. [ Links ]
ARCHIE GE (1942) The electrical resistivity log as an aid in determining some reservoir characteristics, Trans. Am. Inst. Min. Met. Eng. 146 54-61. [ Links ]
ARORA T and SHAKEEL A (2010) Electrical structure of an unsatu-rated zone related to hard rock aquifer. Res. Comm. Sci. 99 (2) 216-220. [ Links ]
ARORA T, KRISHNAMURTHY NS, and AHMED S (2005) TLERT to decipher the unsaturated zone. International Conference on Hydrological Perspectives for Sustainable Development Vol 2, 23-25 February 2005, IIT, Roorkee. Allied Publishers, Mumbai. 846-852. [ Links ]
ATEKWANA EA, SAUCK WA and WERKEMA J (2000) Investigations of electrical signatures at a contaminated site. Appl. Geophys. 44 (2-3) 167-180. [ Links ]
BARKER R and MOORE J (1998) The application of time-lapse electrical tomography in groundwater studies. The Leading Edge 17 1454-1458. [ Links ]
BENSON AK, PAYNE KL and STUBBEN MA (1997) Mapping groundwater contamination using DC resistivity and VLF geophysical methods - A case study. Geophysics 62 80-86. [ Links ]
BEVC D and MORRISON HF (1991) Borehole-to-surface electrical resistivity monitoring of a salt water injection experiment. Geophysics 56 769-777. [ Links ]
BOWLES JE (1992) Engineering Properties of Soils and their Measurements (4th edn.). McGraw-Hill, New York. [ Links ]
DAHLIN T (2001) The development of DC resistivity imaging techniques. Comput. Geosci. 27 (9) 1019-1029. [ Links ]
DAHLIN T (1996) 2D resistivity surveying for environmental and engineering applications. First Break 14 275-284. [ Links ]
DE LA VEGA M, OSELLA A and LASCANO E (2003) Joint inversion of Wenner and dipole-dipole data to study a gasoline-contaminated soil. Appl. Geophys. 54 (1-2) 97-109. [ Links ]
GLOVER PWJ (2010) A generalized Archie's law for n phases. Geophysics 75 (6) 85-91. [ Links ]
GREENHOUSE JP and HARRIS RD (1983) Migration of contaminants in groundwater at a landfill: A case study: 7. DC, VLF, and inductive resistivity surveys. J. Hydrol. 63 177-197. [ Links ]
GRELLIER S, BOUYE JM, GUERIN R, ROBAIN H and SKHIRI N (2005) Electrical Resistivity Tomography (ERT) applied to moisture measurements in bioreactor: principles, in situ measurements and results. Proc. International Workshop on Hydro-Physico-Mechanics of Landfills, 21-22 March 2005, Grenoble, France. [ Links ]
GUERIN R (2004) Leachate recirculation: moisture content assessment by means of a geophysical technique. Waste Manage. 24 (8) 785-794. [ Links ]
KEAN WF, WALTER MJ and LAYSON HR (1987) Monitoring moisture migration in the vadose zone with resistivity. Groundwater 25 562-571. [ Links ]
KELLER GV and FRISCHKNECHT FC (1966) Electrical Methods in Geophysical Prospecting (1st edn.). Pergainon, Oxford. [ Links ]
KEMNA A, KULESSA B and VEREECKEN H (2002) Imaging and characterization of subsurface solute transport using electrical resistivity tomography (ERT) and equivalent transport models. J. Hydrol. 267 125-146. [ Links ]
KRUGER RA and KRUEGER JE (2005) Historical development of coal ash in South Africa. Proc. 2005 World of Coal Ash (WOCA), 11-15 April 2005, Lexington, USA. [ Links ]
LOKE MH (2000) Rapid 2-D Resistivity & IP inversion using the least squares method. Geoelectrical Imaging 2D & 3D GEOTOMO SOFTWARE practical manual. URL: www.geoelectrical.com (Accessed 6 May 2011). [ Links ]
LOKE MH (1999) Time lapse resistivity imaging inversion. Proc. 5th Meeting of the EEGS European Section, 6-9 Sept. 1999, Budapest, Hungary. [ Links ]
LOKE MH and BARKER RD (1996) Rapid least-squares inversion of apparent resistivity pseudosections using quasi-Newton method. Geophys. Prospectus 44 131-152. [ Links ]
MACFARLANE DS, CHERRY JA, GILLHAM RW and SUDICKY EA (1983) Migration of contaminants in groundwater at a landfill: A case study: 1. Groundwater flow and plume delineation. J. Hydrol. 63 1-29. [ Links ]
MOREAU S, BOUYE JM, BARINA G and OBERTY O (2003) Electrical resistivity survey to investigate the influence of leachate recirculation in a MSW landfill. Proc.9th International Waste Management and Landfill Symposium, 5-9 Oct 2003, Calgliari, Italy. [ Links ]
MUKHTAR AL, SULAIMAN WN, IBRAHIM S, LATIF PA and HANAF MM (2000) Detection of groundwater pollution using resistivity imaging at Seri Petaling landfill, Malaysia. Environ. Hydrol. 8 Paper 3. [ Links ]
OSIENSKY JL and DONALDSON PR (1995) Electrical flow through an aquifer for contaminant source leak detection and delineation of plume evolution. Hydrology 169 243-263. [ Links ]
ROGERS RB and KEAN WF (1980) Monitoring groundwater contamination at a fly ash disposal site using surface electrical resistivity methods. Groundwater 18 472-478. [ Links ]
ROSQVIST H, DAHLIN T and LENHE C (2005) Investigation of water flow in a bioreactor landfill using geoelectrical imaging techniques. Proc. 10th International Waste Management and Landfill Symposium, 3-7 Oct 2005, Cagliari, Italy. [ Links ]
SHARMA PV (1997) Environmental and Engineering Geophysics. Cambridge University Press, Cambridge. [ Links ]
TIAB D and DONALDSON EC (1996) Petrophysics: Theory and Practice of Measuring Reservoir Rock and Fluid Transport Properties (1st edn.). Gulf Publishing Company, Houston, Texas. [ Links ]
WHITE PA (1988) Measurement of groundwater parameters using salt-water injection and surface resistivity. Groundwater 26 (2) 192-201. [ Links ]
ZUME JT, TARHULE A and CHRISTENSON S (2006) Subsurface imaging of an abandoned solid waste landfill site in Norman, Oklahoma. Ground Water Monit. Rem. 62 62-69. [ Links ]
Received 31 May 2012
Accepted in revised form 9 July 2013
* To whom all correspondence should be addressed. +27 21 959 2439; e-mail: ikmuchingami@gmail.com

