


Serviços Personalizados
Artigo
 Inglês (pdf)
 Artigo em XML
 Referências do artigo
Indicadores

Links relacionados
-
 Citado por Google
 -
 Similares em Google
Compartilhar

 Permalink
Water SA
versão On-line ISSN 1816-7950
versão impressa ISSN 0378-4738
Water SA vol.39 no.3 Pretoria 2013
Water demand characteristics of shared water and sanitation facilities: Experiences from community ablution blocks in eThekwini Municipality, South Africa
P CrousI, *; J HaarhoffI; CA BuckleyII
IUniversity of Johannesburg, PO Box524, Auckland Park, 2006, South Africa
IIUniversity of KwaZulu-Natal, Howard College Campus, Durban, 4041, South Africa
ABSTRACT
The provision of communal water and sanitation facilities has been mandated by the South African Government as an interim measure for informal settlement upgrading. These services form the first step in the upgrading process and are essential in meeting the basic needs of the community. The eThekwini municipality is rolling out community ablution blocks to informal settlements throughout their jurisdiction. This paper investigates the water demand characteristics of these community ablution blocks, and provides a detailed methodology for collecting the data, which provides the 15-minute peak and average water demand. The results from January to November 2012 indicate that the majority of the water supply (60%) is used for laundry purposes, which includes the water used in the laundry basins and from the tap for off-site consumption, while the water demand for toilet flushing accounts for 16% of the total water supply from each facility. The peak and average water demand can be used for future hydraulic modelling of these, and other, communal ablution facilities.
Keywords: informal settlements; communal sanitation; hydraulic modelling
INTRODUCTION
Sanitation is a basic need and the lack of improved facilities has significant effects on environmental and public health, with detrimental knock-on socio-economic impacts. In South Africa, every person has a right to access basic water and sanitation services (DWAF, 1994). The minimum sanitation standards in South Africa have been provided by the National Government (DWAF, 2001). These standards are defined rather broadly, enabling local authorities to choose their preferred implementation technology based on local conditions and institutional capacity. The technology choices include dry sanitation, low-flush, and full waterborne sanitation. Yet the most appropriate sanitation technology for an informal settlement must provide a socially and environmentally acceptable level of service with full health benefits, whilst being financially viable (Schouten and Mathenge, 2010). Despite the benefits of using dry sanitation, waterborne sanitation still remains the aspiration of inhabitants of poor informal settlements (Roma and Buckley, 2011).
The Government of South Africa has a mandate to upgrade informal settlements by 2014, by either in-situ upgrading or relocation to greenfield sites (DHS 2009). In-situ upgrading is provided incrementally by the provision of interim services, including communal water and sanitation services, stormwater control, roads and footpaths, electricity and refuse removal. The provision of interim services meets the basic, immediate needs of the community, while dovetailing with the local housing department's strategic plan of providing houses and full services. However, local authorities have had difficulty in providing sustained sanitation services that are effective, dignified and affordable, from both a capital and an operation and maintenance (O&M) perspective. The selection of appropriate sanitation services to informal settlements is guided by three significant factors. These include: (i) a high backlog of basic infrastructure, including water, sanitation, electricity and roads; worsened by (ii) rapid urbanisation and population growth; along with (iii) physical constraints, namely, high population densities, lack of available space and available land, and poor environmental conditions.
While communal water and sanitation services are appropriate as interim measure, communal sanitation facilities are not recognised as improved sanitation by the Millennium Development Goals of the United Nations (WHO and UNICEF, 2010). These facilities are notorious for poor maintenance, low usage rates and poor community ownership. Still, communal sanitation has been successful in informal settlements, where they have been the only appropriate technology within the financial, high population density and land tenure constraints (Schouten and Mathenge, 2010). It is noted that these communal water and sanitation services are an interim measure and not the final level of service required by National Government. This interim infrastructure forms part of the long-term upgrading strategy of providing permanent engineering services and housing to the settlement (DHS, 2009).
The eThekwini Municipality is implementing this mandate of interim sanitation and water provision to informal settlements through community ablution blocks (CABs). The municipality aims to provide in the order of 1 100 CABs to approximately 800 000 informal settlement residents (Roma and Buckley, 2011). From January 2009 to February 2012, a total of 233 prefabricated CAB facilities were installed in 105 informal settlements (Aurecon, 2012).
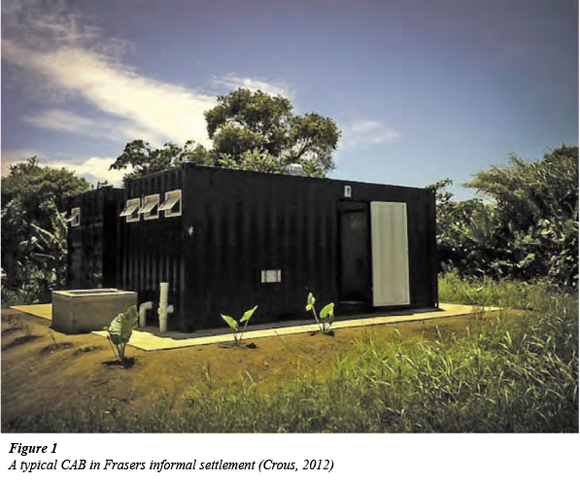
The CABs consist of 2 retro-fitted shipping containers, one for male and one for female ablution facilities (Fig. 1). Although the layout of the ablution facilities varies between different suppliers, the CABs provide showers, hand wash basins, laundry facilities, and toilets, and urinals in the male facilities. The laundry facilities are located between the two containers in Fig. 1. The laundry facilities have typically been used not only for laundry washing but also for carrying water back to the household for domestic purposes, such as cooking, drinking, and cleaning. As of December 2011, 2 taps, referred to as attached taps, are provided on the exterior of the CABs to improve the process for household water collection. The CAB facilities provide internal ventilation to keep them cool during the day, and rely on natural lighting, as electricity is not always available. Caretakers are employed by the municipality to ensure the sustained use of the CABs. The facilities are sometimes locked at night to prevent vandalism and crime (Roma and Buckley, 2011). As CABs provide waterborne services, adequate disposal of the effluent is required to protect both environmental and public health. Thus, these facilities have, until December 2011, been provided to those informal settlements within the waterborne edge of the urban environment - where sewer connections are readily available. CABs are designed to serve either a maximum of 50 to 75 households, or those households within a distance of 200 m. These design parameters are based on standpipe design parameters (as set out in CSIR, 2005). In general, the limiting factor for the spacing of CABs in informal settlements is not the maximum distance of 200 m, but the population density within the settlement (Gounden and Kee, 2012). The provision of CABs allows for the removal of standpipes from the interior of the settlements to eliminate the uncontrolled disposal of greywater from homes, which has negative public health and environmental implications. However, this removal process does not necessarily happen simultaneously.
The placement and site selection of the CAB is an extensive, iterative and collaborative procedure performed during the planning and design phase (Gounden and Kee, 2012). The associated factors dictating the potential placement of the CAB are identical for other sanitation technologies in informal settlements, as discussed by Schouten and Mathenge (2010), DWAF (2002) and Mels et al. (2009), and include:
- Availability of land and permission to occupy (PTO) the land
- Housing and population density
- Accessibility of land, both for construction and O&M
- Environmental conditions, i.e. wetlands and hydrogeologi-cal conditions, topography, etc.
- Method of disposal and treatment of effluent, either on-site or through conventional sewerage
- Proximity of sewers and water supply
- Willingness of the community to relocate dwellings, if land is required
Further, the social environment within which the CABs are constructed is unpredictable due to labour strikes typically found near the end of the construction period, dissatisfaction from the community regarding placement of the facility or the relocation of a household or crops. It was found that the average construction time of 258 CAB related projects took almost twice as long as the budgeted time for construction (Aurecon, 2012). This not only reduces the rate at which these facilities can be provided, but also increases the cost of rolling out CABs, as the majority of the project cost (60%) is dependent on the construction time (Crous et al., 2012).
RATIONALE
EWS recently piloted the provision of CABs in an informal settlement using decentralised wastewater treatment (DEWATs). The settlement, Frasers, is geographically located near Tongaat, in the northern section of eThekwini. This peri-urban informal settlement is beyond the waterborne edge and cannot economically be provided with a sewerage connection. The settlement has a population of 397 households. The number of households in the settlement was obtained from the eThekwini Housing Department's official records (Aurecon, 2011). The railway line separates the settlement into 2 distinct areas, north and south. From the aerial photograph, it was estimated that the north area includes 56 households, and the south area includes 341 households. Frasers informal settlement is planned to be provided with 5 CABs, as shown in Fig. 2. This figure shows the layout of the settlement, where each of the CABs are numbered from 1 to 5. The four CABs which were monitored are shaded in blue. The CAB effluent is treated by a combination of anaerobic baffled reactors (ABRs) or septic tanks (for primary-treatment), and evapotranspiration fields (for secondary treatment). At the time of writing, all of the CABs except CAB 4 were completed.

The design of the ABRs and septic tanks was based on previous in-house guidelines; however, there are no national water demand guidelines for CABs. CABs do not fit any of the scenarios presented in the SANS 10400 guidelines, as CABs include communal showers, basins, laundry facilities, toilets and urinals. SANS 10400 provides guideline water demands for communal standpipes and yard standpipes with a connected toilet, having an average water demand of 12-15 ℓ∙c-1d-1 and 20 - 25 ℓ∙c-1d-1, respectively (SANS 2010). End-use CAB water monitoring provides a powerful tool for more detailed analysis for water demand management, water supply and wastewater treatment design. The investigation of CAB end-use water demand in eThekwini has not been previously undertaken.
The design of the ABR requires 2 hydraulic parameters. The first parameter is the hourly flow, both average and peak flows, to ensure that the upflow rate meets the requirements for appropriate treatment - with acceptable design upflow velocities around 0.27 m-h-1 (Foxon et al. 2006) and an upper limit of 1.0 m-h-1 (Gutterer et al. 2009). The second parameter is the daily flow, which determines the hydraulic retention time, which is usually between 24 and 48 h. The hydraulic retention time is important for the design of both ABRs and septic tanks. For the hydraulic design of the water supply to the CABs, the instantaneous peak flow (assumed to be the 15-min peak flow) is required.
METHODOLOGY
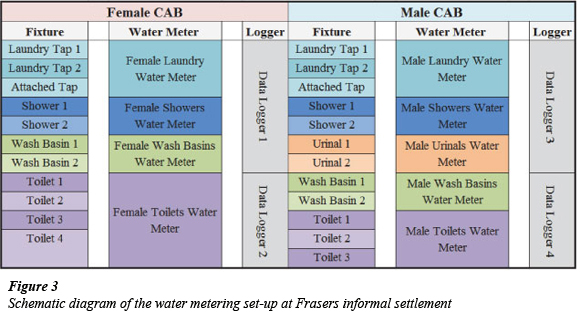
All CABs in eThekwini are fitted with bulk water meters in order to provide information to reduce the non-revenue water within the municipal area. Four of the CABs in Frasers were each additionally fitted with a standard Class C domestic water meter per fixture type (Van Zyl, 2011). It is noted that these water meters measured the water supplied to the CABs, as the meters are connected to the water supply pipes and do not measure the wastewater effluent flows. A total of 9 water meters were used for the male and female facilities combined, as shown in Fig. 3. These water meters were fitted to each type of fitting, namely, 1 per female toilet (4 toilets), female showers (2 showers), female laundry facilities (2 laundry taps and the attached tap), female hand wash basins (2 basins), male toilets (3 toilets), male urinals (2 urinals), male showers (2 showers), male laundry facilities (2 laundry taps and the attached tap), and male hand wash basins (2 basins). The water meters were then connected to a set of proprietary, wireless-transmitting data loggers. These data loggers transmit the data to a secure server which can be accessed remotely via a website. The data loggers require an internal power source, i.e. batteries, in order to record and transmit the data, consequently having an economic value and a target for theft.
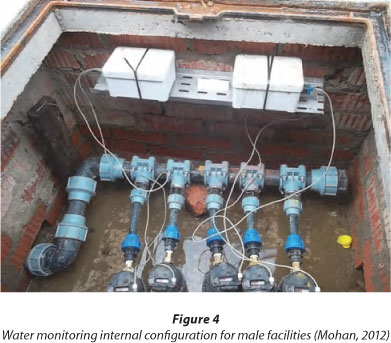
The monitoring equipment, both water meters and data loggers, was thus secured in a plastered-brick enclosure with a steel manhole cover (as shown in the front left of Fig. 1 and the internal configuration shown in Fig. 4) with a low-economic-value steel manhole cover. This enables adequate access for maintenance, whilst ensuring relative safety from vandalism and theft. The water meters are shown at the bottom of Fig. 4; the data loggers are elevated in order to protect them from water damage either due to rain or leaks. The 9 water meters were logged by 4 data loggers, with 3 analogue inputs per data logger.
The data loggers are remotely adjustable to the required logging intervals - as low as a minute and up to 24-h intervals.
However, the interval at which data is logged and sent to the web server determines the battery life of the data loggers. For peak-flow design purposes, the data were recorded at 15-min intervals. The facilities were monitored between January and November 2012, as shown in Table 1. This table presents the total monitoring days and the associated dates for which CABs were monitored.

The analysis of the data was performed in Microsoft Excel. However, there were days on which there were no data recorded for some of the fittings. This was due to either broken fittings or broken data loggers. Further, periods when fittings were leaking were discarded for the analysis of the water demand, for example the basin in the male container of CAB 5 leaked for several days. Where possible, the missing data were patched using the water demand from one week prior to (or following) that specific day. This patching algorithm is shown in Fig. 5. The estimated data in Table 1 refers to data that were estimated using the water demand from another CAB on that day, as the data could not be patched from one week prior to or following that specific date.

The end-use data were used to determine the average and peak daily, hourly and instantaneous water demand. The peak factors were then determined using Eq. (1), where Qpeak is the statistically significant peak flow and Qaverage is the average flow over the specified interval, either 15 min, 1 h or 1 day.

A survey conducted at each CAB in August 2012 found that the caretakers locked the CABs at night, from 20:00 to 05:00 on average. Further analysis of end-use water demand of CAB 5 indicated that the operating hours of the CABs were from 05:00 to 20:30 (15.5 h). This is an appropriate estimation which correlated to the caretaker surveys.
The peak factor for each interval cannot merely be determined by using the absolute maximum flow, as this value is statistically irrelevant (Tessendorf, 1972). A statistically relevant peak flow was determined by using the Weibull distribution, which is commonly used in hydrology to perform flood frequency analysis (Davis, 2008). This method requires that a return period (Tr) is determined for each interval (15-min, 1-h or 1-day), as shown in Eq. (2). The Weibull distribution requires that the data be sorted in descending order, with each sorted value assigned with a rank value (R) of 1 ... n from the maximum to the minimum flow value. The critical return period for design was fixed at 1 week, which means that the peak factor would be exceeded on average once every week. This is sufficient for water supply and wastewater management design, as failure is not catastrophic in water supply but only results in a loss in pressure throughout the network for that time period (Van Zyl, 1996; Booyens, 2000)

where:
Tr = return period
n = number of data points
R = rank value of each of the data points
The average flow was determined for the 15-min, 1-h and 1-day intervals by calculating the average flow over the entire monitoring period. The average flow was expected to decrease as the monitoring interval increased because of the inherent characteristics of water consumption. Based on Booyens (2000), this study interpreted the 'instantaneous peak factor' found in the Red Book as the 15-min peak factor (CSIR, 2005). The Red Book's instantaneous peak factors are vaguely defined, with the peak factor being above 4.0 for high-density urban areas, and between 3.0 and 4.0 for low-density rural areas. There was therefore a need to determine the peak factors of CABs in peri-urban areas.
RESULTS
The results from the four CABs in Frasers informal settlement are presented in terms of the average water demand and the associated peak factors. The results are reported for blackwater, greywater and total CAB water; where blackwater refers to the water supplied to the toilets and urinals, greywater refers to the water supplied to the showers, basins and laundry facilities, and the total CAB water refers to the combined water supplied to the CAB. The separation of the wastewater streams provides further water demand characteristics where the wastewater streams are separated before treatment. CAB 2 and CAB 5 in this study separated the waste streams at source, whereby the greywater bypassed the ABR and was discharged into a settler before discharging into the evapotranspiration field. CAB 1 and CAB 3 did not separate the wastewater before treatment with septic tanks.
Average water demand
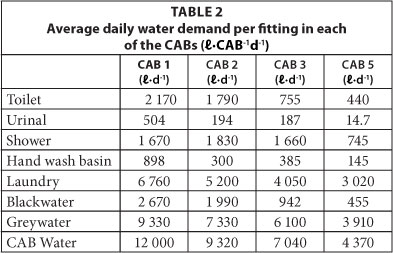
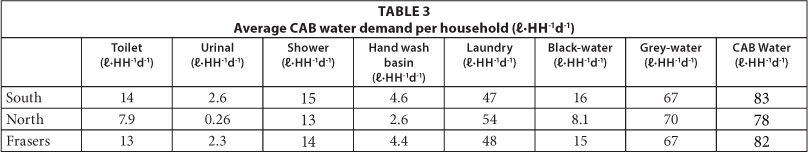
The results of the average daily water demand from the monitoring of four CABs in Frasers informal settlement are presented in Table 2. The table provides the water demand per fitting and the combined greywater and blackwater demand derived from the respective fittings and the combined water demand for each of the CABs, labelled CAB water. For an in-depth analysis of the results, see Crous (2013). The estimated household (HH) consumption is shown in Table 3 for the north area (CAB 5) and south area (CAB 1, CAB 2 and CAB 3) and the entire Frasers settlement, with an average water demand of 82 ℓ∙HH-1d-1. Although the number of people per household was not confirmed through a census survey of the whole settlement, the results from a representative sample of 147 households found an average of 2.2 people per household (Okem et al., 2012). This value provides an estimated average water demand of 37 ℓ∙c-1d-1. This value is consistent with the CAB water demand of 35 - 40 ℓ∙c-1d-1 (Roma et al., 2010). Yet, the average household water demand is approximately 4 times less than the eThekwini municipal free basic water allowance of 300 ℓ∙HH-1d-1 (EWS, 2012).
Peak factors
The peak factors for the average of the four CABs are provided in Fig. 6. The hydraulic design of the water supply system requires the instantaneous peak factor of the total water supplied to the CAB (total CAB water), and the design of the wastewater management requires the 1-h and 1-day peak factors of the separated wastewater sources, blackwater and greywater, and the combined total CAB water.

DISCUSSION
The integrity of the reported results is a function of the accuracy of the water meters, the data patching, the number of households, and the number of people per household. the international standards for Class C water meters, flow rates as low as 0.26 ℓ∙min-1 and 0.42 ℓ∙min-1 are, respectively, within 5% and 2% accuracy (Van Zyl, 2011). The flow rate from each of the fittings was measured on-site and the flow rate was greater than 0.42 ℓ∙min-1, which is the 2% accuracy. The water demand was logged at 15-min intervals and was automatically rounded off to the nearest half-litre, which does not have a significant effect on the total water demand for each 15-min interval, as the rounding off for the showers, toilets and laundry facilities, i.e. the fixtures using the majority of the water in the CABs, accounted for 3%, 4%, and 2% of the average water demand.
The results in Table 3 indicate that the north area and the south area used approximately the same amount of water for laundry washing and bathing purposes. The water consumed at the toilets was approximately 40% less in the north area than for the CABs in the south area. Although this was not further investigated, it is expected that this was as a result of the residents making use of rudimentary, pre-existing toilets for defecation.
The number of households (397 households) for the entire Frasers settlement was obtained from the eThekwini Housing Department. The number of households in the north area and the south area was estimated from the aerial photography of the settlement. The average number of people per household (2.2) provides an indication of the size of the households within the study. However, the number of people using the facility during the day will vary, as residents go to work or to school and as railway commuters use the CABs, for example. Thus, considering the variability in the number of users each day over the monitoring period, this study provides an estimate of the average water supply characteristics for the entire settlement by estimating the water balance of the entire settlement.
It is important to note that the water demand from the CABs does not account for all of the water used within Frasers settlement, as there were five remaining standpipes which also provided water to the settlement. The standpipes' water demand was not monitored. This means that the average water demand will be higher than the average water demand of the CABs. A study of 1 021 households in 31 informal settlements was conducted in 2011 (Roma and Buckley, 2011). This study found that 28% and 10% of households prefer to use standpipes over CABs for bathing and laundry washing, respectively. Using the average water demand for each fitting type in Frasers, the previous study suggests that 11% of the total CAB water is collected from the standpipes and not the CABs, for bathing and laundry washing. Based on accessibility, it was calculated that the drinking water (and water used for cooking) would typically be sourced from the standpipes, and accounts for 7% of the total CAB water demand, assuming each household uses in the order of 6 ℓ∙HH-1d-1 for drinking and cooking. Taking into account the water collected from the standpipes and the drinking water, the results from the CAB end-use water monitoring campaign should be increased by 18%, producing an average household water demand of 97 ℓ-HH-1d-1. Although the water sourced from the standpipes was estimated, the data were based on first principles, the authors' experience and similar studies in eThekwini.
The municipal design peak factor is 4.0 within the eThekwini metropolitan area (Rosseau, 2012), which is 23% lower than the average peak factor of 5.2 found in this study.
CONCLUSIONS
The design of the water supply to and wastewater generated from the 233 CABs rolled out in the eThekwini area were estimated, based on the relevant design guidelines. This was satisfactory where CABs were located within the waterborne edge. With the recent initiative to move CABs into informal settlements beyond the waterborne edge, with on-site waste-water treatment, there is a need to not only predict the overall water demand, but to provide the water demand and waste-water discharge for each type of fixture. This was achieved by end-use monitoring of all fittings in the CABs. The rational design of the ABRs and septic tanks, for example, requires average flow rates for blackwater and greywater (for the estimation of hydraulic retention times) and the associated peak factors (to assess the process efficiencies during peak flow). End-use monitoring is also beneficial for water distribution network modelling, planning for adequate water provision to CABs and future CAB water demand management.
The results from four CABs in Frasers informal settlement indicate that the average household daily water demand is 82 ℓ-HH-1d-1 from the CABs. Accounting for the standpipe water consumption, the estimated household water demand for the CABs was adjusted to 97 ℓ-HH-1d-1. This adjusted average household water demand is approximately three times less than the free basic water allowance of 300 ℓ-HH-1d-1 in eThekwini. It is also approximately double the SANS water demand guideline for a yard standpipe with a dry sanitation facility (50-55 ℓ-HH-1d-1), assuming 2.2 people per household (SANS, 2010). Adjusting the end-use water demand to account for the presence of 5 standpipes in Frasers, it was found that the water supplied to the CABs was predominantly used for laundry washing (60%), showering (20%) and toilet water consumption (16%).
The results indicate that the CAB water demand has an instantaneous (15-min) peak factor of 5.2, a 1-h peak factor of 3.5, and a 1-day peak factor of 1.4. This instantaneous peak factor was consistent with the Red Book's broad guideline for peak factors in high-density (urban) areas. However, this study identified that the peak factor for CABs is higher than the municipal guideline value of 4.0. The average daily water demand and instantaneous peak factors can be used for the hydraulic design of the water supply, and the 1-h and 1-day peak factors used for the design of the hydraulic retention time of on-site treatment facilities, such as ABRs and septic tanks, and the upflow rate of the ABRs.
It is recommended that future water demand studies account for water consumption from other sources, such as standpipes, in order to identify the total water demand of the settlement. Further research into the end-use water demand of CABs will enable more accurate water provision and waste-water treatment (centralised and decentralised) planning. It will, specifically, have significant impacts on the provision of CABs in unsewered areas as the SANS 10400 guidelines do not account for the design of septic tanks used for CABs.
ACKNOWLEDGEMENTS
The authors thank eThekwini Water and Sanitation Unit for funding the monitoring equipment. Further, the authors thank Stemele Bosch Africa (Umhlanga), Hering, and Borda for their contributions to the research. The authors also wish to thank the NRF and the UJ Research Council for funding the research.
REFERENCES
AURECON (2011) ISP Counts RapidRollout - Dec 2011 Excel spreadsheet. Aurecon internal document based on the official eThekwini Housing Department records, dated December 2011. Aurecon, Durban. [ Links ]
AURECON (2012) Master Dates file - 13 Feb 2012 Excel spreadsheet. Aurecon internal document dated 13 February 2012. Aurecon, Durban. [ Links ]
BOOYENS JD (2000) Spitsvloei in munisipale waterverspreiding-netwerke. Masters thesis, Rand Afrikaans University, Johannesburg. [ Links ]
CROUS P (2012) Photo of CAB 5 in Frasers informal settlement, January 2012. [ Links ]
CROUS P (2013) Community ablution facilities as interim measure for the upgrading of informal settlements. PhD thesis, University of Johannesburg, Johannesburg. [ Links ]
CROUS P, BUCKLEY C and HAARHOFF J (2012) Unaccounted costs and delays in the planning of interim water and sanitation services in informal settlements - Experience from eThekwini municipality. Wits Water Research Showcase, 22 June 2012, University of the Witwatersrand, Johannesburg. [ Links ]
CSIR (2005) Guidelines for Human Settlement Planning and Design. CSIR Building and Construction Technology, Pretoria. [ Links ]
DAVIE T (2008) Fundamentals of Hydrology. (2nd edn.). Taylor & Francis, New York. [ Links ]
DHS (DEPARTMENT OF HUMAN SETTLEMENTS, SOUTH AFRICA) (2009) National Housing Code - 5. Volume 4 Upgrading Informal Settlement. Department of Human Settlements, Pretoria. [ Links ]
DWAF (DEPARTMENT OF WATER AFFAIRS AND FORESTRY, SOUTH AFRICA) (1994) Water Supply and Sanitation Policy White Paper. URL: www.dwaf.gov.za/Documents/Policies/WSSP.pdf (Accessed January 2012). [ Links ]
DWAF (DEPARTMENT OF WATER AFFAIRS AND FORESTRY, SOUTH AFRICA) (2001) White Paper on Basic Household Sanitation. URL: http://www.dwaf.gov.za/Documents/Policies/ SanitationReviewPolicy.pdf (Accessed January 2012). [ Links ]
DWAF (DEPARTMENT OF WATER AFFAIRS AND FORESTRY, SOUTH AFRICA) (2002) Guidelines for the Formulation of a Strategy & Implementation Plan for the Provision of Sanitation Services in Informal Settlements. URL: http://www.dwaf.gov.za/dir_ws/content/lids/Tools/Booklet4Informalsettl ements.pdf (Accessed October 2011). [ Links ]
EWS (ETHEKWINI WATER AND SANITATION UNIT) (2012) Policies and Practices of the eThekwini Municipality Water and Sanitation Unit: Revision 1-26 April 2012. URL: http://www.durban.gov.za/CityServices/water sanitation/PoliciesPlansGuidelines/Documents/3804432.pdf (Accessed August 2012). [ Links ]
FOXON KM, BUCKLEY CA, BROUCKAERT CJ, DAMA P, MTEMBU Z, RODDA N, SMITH M, PILLAY S, ARJUN N, LALBAHADUR T and BUX F (2006) The evaluation of an anaerobic baffled reactor for sanitation in dense peri-urban settlements. WRC Report No. 1248/1/06. Water Research Commission, Pretoria. [ Links ]
GUTTERER B, SASSE L, PANZERBIETER T and RECKERZÜGEL T (2009) Decentralised Wastewater Treatment Systems (DEWATS) and Sanitation in Developing Countries. WEDC, Loughborough. [ Links ]
GOUNDEN T and KEE A (2012) Personal communication; interview conducted at eThekwini Water and Sanitation, Durban, 29 January 2012. Mr Teddy Gounden and Mr Alan Kee, eThekwini Water and Sanitation, 3 Prior Road, Durban, 4000. [ Links ]
MELS A, CASTELLANO D, BRAADBAART O, VEENSTRA S, DIJKSTRA I, MEULMAN B, SINGELS A and WILSENACH JA (2009) Sanitation services for the informal settlements of Cape Town, South Africa. Desalination 248 (1) 330-337. [ Links ]
MOHAN P (2012) Photo of the water monitoring set-up at a CAB facility in Frasers informal settlement, July 2012. Mr P Mohan, engineer, Stemele Bosch Africa, Durban. [ Links ]
OKEM A, BUCKLEY CA and ROMA E (2012) Frasers informal settlement baseline survey progress report. Pollution Research Group, University of KwaZulu-Natal. [ Links ]
ROMA E, BUCKLEY C, JEFFERSON B and JEFFREY P(2010) Assessing users' experience of shared sanitation facilities: A case study of community ablution blocks in Durban, South Africa. Water SA 36 (5) 589-594. [ Links ]
ROMA E and BUCKLEY CA (2011) Assessing Community Ablution Blocks and exploring sanitation market in informal settlements of eThekwini Municipality - South Africa. Milestone 1. Report to Unilever (UK). [ Links ]
ROSSEAU M (2012) Personal communication; e-mail with subject 'CAB water requirements' received 25 June 2012. Mr M Rosseau, engineer at Stemele Bosch Africa. [ Links ]
SANS (SOUTH AFRICAN NATIONAL STANDARD) (2010) SANS 10400-P:2010, The Application of the National Building Regulations - Part P: Drainage. SANS, Pretoria. [ Links ]
SCHOUTEN MAC and MATHENGE RW (2010) Communal sanitation alternatives for slums: A case study of Kibera, Kenya. Phys. Chem. Earth 35 (13-14) 815-822. [ Links ]
TESSENDORF H (1972) Problems of peak demand and remedial measures. Proc. International Water Supply Association Congress, 1972, New York. [ Links ]
VAN ZYL JE (1996) Peak factors in municipal water reticulation networks. Proc. WISA Biennial Conference, 20-23 May 1996, Port Elizabeth. [ Links ]
VAN ZYL JE (2011) Introduction to Integrated Water Meter Management. WRC Report No. TT 490/11. Water Research Commission, Pretoria. [ Links ]
WHO and UNICEF (2010) Types of drinking water and sanitation. Joint Monitoring Programme of the World Health Organisation and UNICEF. URL: http://www.wssinfo.org/definitions-methods/watsan-categories/ (Accessed August 2012). [ Links ]
This paper was originally presented at the 2012 Water Institute of Southern Africa (WISA) Biennial Conference, Cape Town, 6-10 May 2012.
* To whom all correspondence should be addressed. Current affiliation: SMEC South Africa, 267 Kent Avenue, Ferndale, South Africa, 2194 +27 11 369-0600; e-mail: bye.product@gmail.com

