


Servicios Personalizados
Articulo
 Inglés (pdf)
 Articulo en XML
 Referencias del artículo
Indicadores

Links relacionados
-
 Citado por Google
 -
 Similares en Google
Compartir

 Permalink
Water SA
versión On-line ISSN 1816-7950
versión impresa ISSN 0378-4738
Water SA vol.39 no.3 Pretoria 2013
Greywater reuse for toilet flushing at a university academic and residential building
AA IlemobadeI, *; OO OlanrewajuI; ML GriffioenII
ISchool of Civil and Environmental Engineering, University of the Witwatersrand, Private Bag 3, WITS 2050, South Africa
IIDepartment of Civil Engineering Science, University of Johannesburg, PO Box 524, Auckland Park 2006, South Africa
ABSTRACT
Interest in water reuse is increasing all over the world and particularly in South Africa, because of its potential to supplement scarce freshwater resources in the face of increased demand and aridity. If water reuse is to be implemented, it must be done sustainably. This study: (i) describes the perceptions of beneficiaries before and after greywater reuse (GWR) implementation; (ii) determines the attributes of greywater that were important to beneficiaries when reusing greywater and their willingness to pay for these attributes; and (iii) undertakes an economic analysis of the implemented GWR systems. To this end, two GWR systems for toilet flushing were installed. The first was installed at a university academic building at the University of the Witwatersrand, Johannesburg, and the second at a university residence at the University of Johannesburg. Perceptions highlighted included respondents' preference to reuse greywater for toilet flushing rather than irrigation, and the greater preference for GWR for toilet flushing expressed for the university academic relative to the university residential building. In sequence, 'smell', 'colour' and 'greywater tariff' emerged as the attributes of greywater that were important to respondents. In terms of payback period, net present value and benefit-cost ratio, both systems generated a net loss and were economically unfeasible.
Keywords: greywater reuse for toilet flushing, perceptions, economics
INTRODUCTION
Increased socio-economic development of South African communities has led to an overall increase in water demand for various purposes. Globally, water reuse is encouraged because of its potential to (i) supplement freshwater resources; (ii) provide reliable water services in remote or environmentally sensitive locations; (iii) mitigate the rising costs of meeting drinking water treatment and wastewater discharge standards; and (iv) reduce sewage discharges to water bodies. Water reuse seems inevitable in many South African communities especially those faced with declining freshwater availability (Ilemobade et al., 2012). If water reuse is to be implemented, it must be implemented sustainably. Sustainable development requires life-cycle consideration and assessment of different aspects (e.g. technical, social, economical, environmental, institutional, and health) impacting on or being impacted by the development.
Several water reuse schemes failed because benefactors/ decision-makers underestimated or ignored the importance of and/or impact of varied social and economic factors (May-Le, 2004; Po et al., 2003). To this end, perceptions were recognised as a key element of the success of water reuse (May-Le, 2004; Po et al., 2003). In many water reuse schemes in the US and Australia, perceptions have determined the acceptability of water reuse, with water reuse applications requiring little to no human contact (e.g. toilet flushing and irrigation) being the preferred amongst several reuse applications (Radcliffe, 2003).
In addition to perceptions, the economics associated with water reuse has become vital in the assessment of the viability and sustainability of reuse. In favour of greywater reuse (GWR), for example, Faruqui and Al-jayyousi (2002) published a benefit-cost ratio ranging from 2.8 to 9.4 for a 4-member household irrigating with greywater in Jordan. Other reasons in favour of GWR included high potable water tariffs, the availability of subsidies/grants for GWR, and the lower costs of greywater treatment in comparison to potable water treatment. On the other hand, Surendran and Wheatley (1998), March et al. (2004), and Ghisi and Ferreira (2007) determined long payback periods of between 8 to 14 years for GWR for toilet flushing in hotels and high-rise buildings. Greywater, which excludes toilet wastewater, refers to wastewater from showers, baths, hand wash basins, laundry and kitchens. Greywater is categorised into light and dark greywater, with light grey-water of better quality because it excludes kitchen effluent. Henceforth, all references to 'greywater' imply 'light greywater', unless otherwise stated.
Technically, GWR infrastructure (i.e., treatment, storage, distribution, operation and maintenance infrastructure) is similar to potable water infrastructure and may thus be designed and implemented in similar fashion (Ilemobade et al., 2009). Institutional arrangements (in respect of the availability and application of regulations and/or guidelines) for the planning, implementation and management of GWR are often location-specific, and most often present problems where GWR has developed in the absence of regulations, guidelines and management capacity. Some of these problems include the difficulty in achieving uniformity in GWR plumbing and installation, and the potential risks to health.
South African research published in the area of greywater and wastewater reuse has been few: Ilemobade et al. (2009) and Adewumi et al. (2010) provided tools to guide wastewater reuse for non-potable domestic and institutional applications from centralised municipal supply; Wilson and Pfaff (2008) investigated perceptions of direct potable reuse of treated wastewater in Durban, South Africa; Carden et al. (2007) recommended guidelines for the management of GWR within non-serviced, low-income settlements; and Rodda et al. (2010) recommended guidelines for GWR for small-scale agricultural irrigation. In the Ilemobade et al. (2009) study, a significant percentage of the South African respondents surveyed recorded their preference for the reuse of non-potable waters for toilet flushing in comparison to other non-potable applications such as car washing. To this end, GWR for toilet flushing was investigated in this study.
The specific objectives of this study were:
- To describe non-residential (specifically, university academic) and residential (specifically, university residential) beneficiaries' perceptions of GWR for toilet flushing
- To determine the attributes of greywater that were important to beneficiaries when reusing greywater and their willingness to pay for these attributes
- To analyse the economics (specifically benefits, costs, net present values and payback periods) of the implemented GWR systems
RESEARCH METHODOLOGY
The description of beneficiaries' perceptions of GWR for toilet flushing
Self-administered questionnaires were used to determine perceptions of GWR for toilet flushing, the attributes of greywater that were important to beneficiaries when reusing greywater and their willingness to pay for these attributes. To this end, four questionnaires were developed and administered prior to and after implementation of GWR (see Table 1). Questionnaire 1 solicited respondents' perceptions of GWR for toilet flushing prior to and immediately after the implementation of the GWR systems. About 3 months after GWR implementation, Questionnaire 2, which followed up on some items in Questionnaire 1, was administered to respondents. Questionnaire 3 followed up on some items in Questionnaires 1 and 2 about 7 months after implementation. Questionnaire 4, administered about 14 months after implementation, followed up on some items in Questionnaires 1, 2 and 3 and requested beneficiaries' responses to the attributes of greywater that were important to them during reuse. Several sites were initially investigated as locations for the proposed GWR systems. Based on available funds and approvals received, a GWR system was implemented at a university academic building at WITS (i.e. the School of Civil and Environmental Engineering, University of the Witwatersrand, Johannesburg) and at a residential building at UJ (i.e. Unit 51A, Student Town, University of Johannesburg, Kingsway Campus). Thus, the respondents used in this study were based at WITS and UJ.
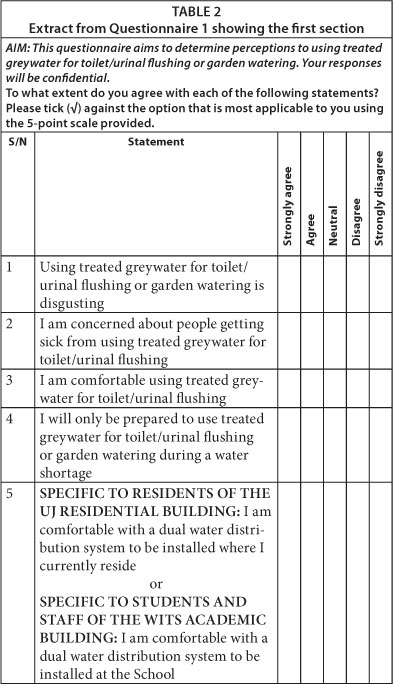
Po et al. (2003) identified the following factors which influenced perceptions of water reuse and, consequently, the acceptance of a water reuse scheme: disgust or 'yuck'; risks associated with reuse; uses of greywater; sources of greywater; and the issue of choice. The first section of Questionnaires 1 to 4 (see Table 2) contained statements, based on the factors above, requiring respondents to select the option that was most applicable to them using the 5-point scale provided, i.e. 'Strongly agree', 'Agree', 'Neutral', 'Disagree', and 'Strongly disagree'. The second section was open-ended and requested respondents to either list reasons (personal, cultural, religious or otherwise) why they may/may not use greywater for toilet/urinal flushing or garden watering, or make any comments.
Open-ended responses in the second section of the questionnaires were tabulated and grouped according to similarities and differences, while responses to statements in the first section were entered into a Microsoft Excel spreadsheet to determine response frequencies. The first two and last two responses on the scale were often collapsed to simplify the results generated.
Meetings with respondents typically began with the administration of the relevant questionnaire. This was done to garner the perceptions of respondents prior to the awareness/ education sessions. Hence, respondents' perceptions were not tainted by the information subsequently presented. Thereafter, awareness and education activities (some of which are listed below) were carried out. These activities elicited the cooperation of the respondents in the implementation of the GWR systems; clarified project objectives; explained how the GWR systems would work (prior to implementation) or worked (after implementation); allayed concerns due to issues such as grey-water colour, unpleasant smells, and potential health risks; and received guidance on strategic issues. Critical issues expressed during these activities were fed into subsequent questionnaires and monitored over time. Awareness and education activities included:
- Seminars on GWR were presented by final-year B.Sc. students.
- Before and after GWR implementation, awareness sessions were held with different stakeholders, e.g. technical staff, different undergraduate classes, and residents.
- Size A3, A4 and A5 posters were put up in the buildings where the GWR systems were implemented.
- GWR formed a portion of some water-related undergraduate and postgraduate lectures and assessments.
- Over a period of 4 years from the commencement of the GWR project, a South African Water Research Commission Reference Group provided advice.
The GWR for toilet flushing sites and systems
As mentioned earlier, a GWR system was implemented at WITS and UJ. On a peak day, the WITS building housed about 300 s taff and students. Although there are 12 toilets in the building, due to limited funding, only 2 toilets (1 male and 1 female) were retrofitted to flush with greywater. The UJ building comprised 2 floors and housed 2 toilets, 1 shower, 1 bathtub and 3 hand basins on each floor. Two toilets (one on each floor) were retrofitted to flush with greywater.
The GWR system, schematically depicted in Fig. 1 (letters given for each component below correspond to labels used in Fig. 1), was implemented at both sites. Greywater is collected from 12 bathroom hand basins (a) at WITS and from 2 showers and 2 baths at UJ (a). The greywater then passes through a chlorinator (b) which disinfects the effluent using chlorine blocks before it passes through two 2-mm sieves (c) in series which are housed within a cylindrical pipe (d). Cistern blocks (e), which provide colour and further disinfection to the grey-water are inserted into one of the 2 mm sieves weekly. The sieved greywater is then stored within a 200 ℓ greywater tank (f) which houses 2 submersible pumps (each pump is connected to a toilet). When pressed, the bell switch (g), which is mounted on the wall close to the toilet cistern, activates its pump within the greywater tank and conveys the sieved greywater into the toilet bowl (h) for flushing. A knob (i), located on the municipal supply into the cistern provides a primary back-up when the greywater system fails. The knob is simply turned to revert to the municipal supply. A tank (j), situated close to the greywater tank, stores municipal potable water at WITS (rainwater at UJ) and provides an additional back-up water supply to the greywa-ter tank when greywater drops below a prescribed level. Several overflow pipes (k, l, m) convey excess greywater to the sewer.
Determination of the attributes of greywater that were important to beneficiaries when reusing greywater and willingness to pay for these attributes
The 4th section of Questionnaire 4 was used to collect the data required for this section (see Table 3). The attributes of greywater investigated were the attributes that respondents highlighted during awareness/questionnaire administration sessions as important to them. The attributes highlighted were colour, smell and greywater tariff, and Table 3 was developed based on the various combinations of these 3 attributes i.e. 2 options for colour (grey or blue) x 2 options for smell (pleasant or unpleasant) x 3 options for tariff (50%, 75% or 100% of the drinking water tariff) = 12 options. Respondents were asked to rate their preference for each combination on a scale of 1 (least desirable) to 12 (most desirable). Interestingly, the attributes highlighted above were the attributes highlighted by respondents in Hurlimann and McKay's (2007) study. Questionnaire 4 was only administered to the UJ respondents because the UJ site is a residence where students are required to pay for services. At WITS, an academic building, this is not the case.
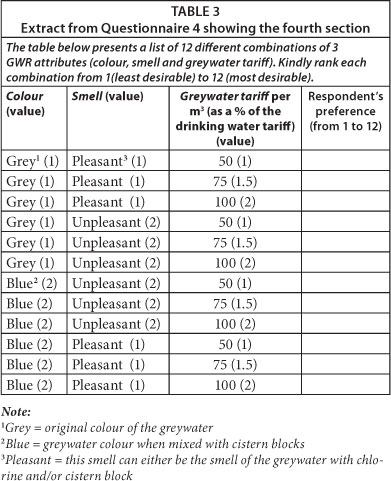
Conjoint analysis (CA) was used to evaluate respondents' preferences for the different attributes of greywater and to estimate willingness to pay for these attributes. SPSS (Statistical Package for the Social Sciences) version 16.0.1 was used in the analysis. An ordinary least squares (OLS) method was used to estimate the coefficients and the statistical significance of the greywater attributes. The objective of an OLS CA is to produce a set of additive regression equations that identify each respondent's preferences amongst different attribute combinations. Hence, the OLS method solves for preferences using a set of dummy independent variables which may take a value between 0 (unimportant attribute) and 1 (important). The model used in this study (after Hurlimann and McKay, 2007) considered the 3 attributes of greywater and is expressed as:

where U is the utility (respondent's preference score) for a particular combination of the 3 attributes. Values for each attribute are presented in Table 3. β1, β2 and β3 are coefficients for colour, smell and tariff, while ej is a constant.
Willingness to pay (WTP) was calculated using Eq. (2) (Hurlimann and McKay, 2007):

where βc represents the coefficient for colour or smell and βy represents the coefficient for greywater tariff.
Economic analysis of the implemented GWR systems
The economic analysis presented below attempted to determine all plausible costs and benefits associated with GWR for toilet flushing at both sites.
Economic costs
The economic costs of the GWR system were the cost of: (i) system design, purchase and installation and (ii) operation and maintenance. The installation costs were dependent on the retrofit requirements at each site. Operation and maintenance costs included costs of (i) energy required for pumping, (ii) maintenance, and (iii) disinfection.
Health risk
The Disability Adjusted Life Year (DALY) index was employed to estimate the number of healthy years that may be lost annually due to diarrhoea caused by GWR for toilet flushing at WITS and UJ. The DALY, which was developed by the World Health Organisation and the World Bank, estimates the impact of life loss caused by death and deformity after disease. One DALY corresponds to one lost year of healthy life (WHO, 2007). Worldwide, unsafe water and lack of hygiene are key risk factors causing diarrhoea, which results in the annual death of 4.9 out of every 1 000 children aged less than 5 years in developing countries (Kosek et al., 2003). In South Africa, diarrhoea accounts for 3.1% of total annual deaths (about 43,000) and is the 8th largest cause of death nationally (Pegram et al., 1998). Among children under 5, diarrhoea constitutes 84% (13 368) of the causes of all deaths attributable to unsafe water, sanitation and hygiene, and 8.8% of the DALY for this age group (Bradshaw et al., 2003). For diarrhoea, Lewin et al. (2007) published a DALY number of 386 160 for South Africa.
The major health risk from GWR for toilet flushing is the ingestion of pathogens from hand to mouth contact after toilet use. In this study, therefore, the DALY due to diarrhoea caused by GWR for toilet flushing at the different sites was calculated using a direct valuation method. The health risk, in terms of cost, was determined by multiplying the DALY number due to diarrhoea caused by the GWR project and the DALY unit cost.
The DALY number due to diarrhoea was calculated based on the most probable pathogenic organism which causes diarrhoea. According to Ottoson and Stenstroem (2003), pathogenic organisms that cause diarrhoea include faecal bacteria, Campylobacter, enteric viruses (especially rotavirus), and protozoa (especially Cryptosporidium). Amongst the four, Campylobacter produced the highest DALY per person per annum due to toilet flushing (Ottoson and Stenstroem, 2003) and presented the highest risk of diarrhoea to the GWR beneficiaries (Olanrewaju, 2013). Therefore, the DALY number per annum due to diarrhoea caused by the WITS GWR project:
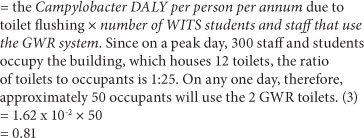
The DALY number per annum due to diarrhoea caused by the UJ GWR project
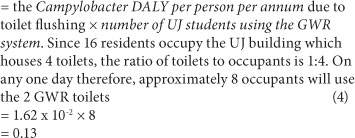
According to Pegram et al. (1998), the total cost of diarrhoea treatment in South Africa was estimated to be R3.375 billion/ year in 1995. With a moderate 5% annual inflationary increase, the cost of treating diarrhoea as at 2009 was estimated in this study to be R6.68 billion. Therefore:
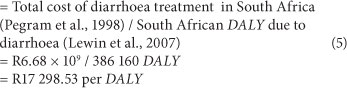
Therefore, the health risk per annum due to diarrhoea caused by GWR for toilet flushing

Economic benefit
The economic benefit of GWR for toilet flushing is the savings in municipal potable water resulting from reuse. This benefit was calculated by multiplying the prevailing water tariff by the potable water saved. The Johannesburg Water 2010 tariff for potable water was R10.58/kℓ and, historically, this tariff has increased between 7 and 14% per annum. Therefore, a 10% increase per annum was employed in this study. Potable water saved was determined by logging demand within each building over similar months before and after GWR implementation and subtracting the 'after' from the 'before' values.
At WITS, the average potable water saved due to GWR in 2 of the 12 toilets amounted to 220 ℓ/day. These savings occurred during the months of November 2009 (before GWR implementation) and November 2010 (after). These months fell within the off-peak months of the WITS academic calendar and, thus, the average potable water saved was multiplied by a factor of 2 to bring the average potable water saved during normal academic months to 440 ℓ/day. The potable water saved at UJ due to GWR in 2 of the 4 toilets amounted to 139 ℓ/day. This savings occurred during the months of August and September 2009 (before GWR implementation) and August and September 2010 (after). Due to the winter-term break which fell within the months of July and August, a factor of 2 was employed to bring the average potable water saved to 278 ℓ/day during normal academic months.
Environmental benefit
The environmental benefit is the savings due to the reduction in sewage to be treated due to GWR for toilet flushing multiplied by the sewage tariff. In essence, the greywater collected resulted in the reduction of sewage being conveyed to the sewage treatment works downstream. From Van Zyl et al. (2006), 83% of potable water demanded in a middle-income area typically becomes sewage. The quantity of sewage not discharged into the sewer due to GWR was therefore estimated to be 83% of the potable water saved.
Benefit-cost ratios, net present values and payback period analysis
Costs and benefits were evaluated using Eqs. (7) and (8). CO represents economic cost and CP represents health risk. BO represents economic benefit while BE, environmental benefit. The annual discount rate employed was 10% over the 20-year GWR design life. If a benefit to cost ratio > 1, then the project is economically feasible.

Net present value (NPV) calculations discount and then aggregate each future cost and benefit to a present value using a discount rate. A positive NPV indicates a net benefit. When evaluating different schemes, those with higher NPV values are more favourable. NPV is computed using Eq. (9):
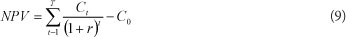
where r is the discount rate, Ct is the net cash flow and T is design life of the system.
Payback period, which is the time taken to gain a financial return equal to the original investment, is determined using Eq. (10):

RESULTS AND DISCUSSION
The description of beneficiaries' perceptions of GWR for toilet flushing
Disgust or 'yuck'
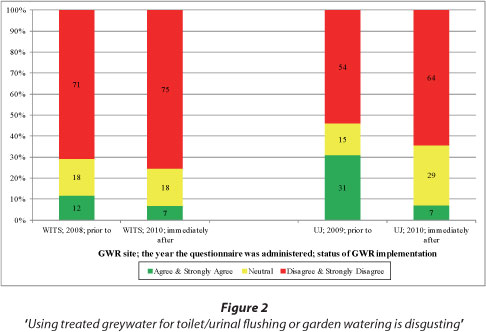
As can be seen in Fig. 2, there was significant disagreement (especially at the WITS site) to Statement 1 of Table 2 (i.e. 'Using treated greywater for toilet/urinal flushing or garden watering is disgusting') prior to and immediately after GWR implementation.
Risks associated with GWR
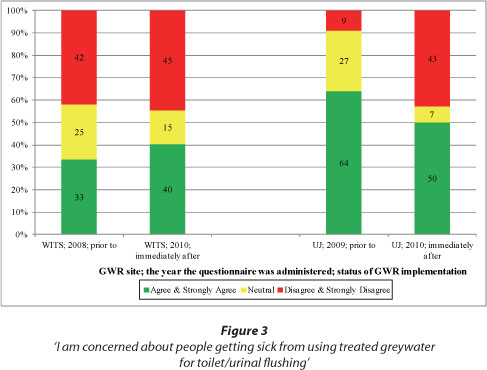
Perceptions of risk are often related to health risks arising from GWR. People may perceive GWR to be risky because (i) the use of the water source is perceived as 'unnatural'; (ii) it may be perceived as harmful to people; (iii) their decision to reuse grey-water may be irreversible; and (iv) the quality and safety of the greywater is not within their control. Responses to Statement 2 in Table 2 (i.e. 'I am concerned about people getting sick from using treated greywater for toilet/urinal flushing') are shown in Fig. 3. From the figure, similar percentages of WITS respondents were concerned about people getting sick from using treated greywater for toilet/urinal flushing in the 2008 and 2010 surveys. At UJ, however, the percentage of respondents who were concerned was much higher in 2009 (64%) than in 2010 (50%). The noticeable drop in the percentage of concerned UJ respondents may be attributed to either or both reasons: an increased level of confidence in the project team which ensured the GWR system was hygienic and optimally functioning; or some 2009 respondents who may have contributed to the percentage of respondents '...concerned about people getting sick...', did not return in 2010 and hence were not part of the 2010 respondents. Also visible in Fig. 3, is the higher percentage of respondents at UJ (the university residential building) '...concerned about people getting sick...' than at WITS (the university academic building).
Uses of greywater
As shown in Fig. 4, large percentages of WITS respondents were comfortable using treated greywater for toilet flushing before and after GWR. At UJ, however, although no respondents disagreed with the statement prior to and immediately after implementation, the percentages of respondents in disagreement with the statement increased subsequently. Some operational issues at UJ (e.g. turbid greywater in the toilet bowls often forming an unsightly ring above the greywater level, and unpleasant smells during flushing resulting from a period of irregular maintenance) were likely to have caused the increase in the percentage of respondents in disagreement with the statement months after implementation. Also visible in Fig. 4, is the higher percentage of respondents at WITS (the university academic building) '...comfortable using treated greywater for toilet/urinal flushing' than at UJ (the university residential building).
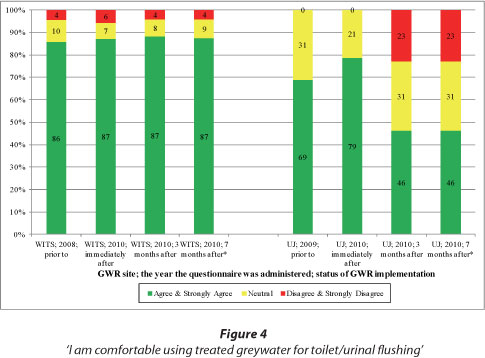
In comparison to garden watering, most WITS and UJ respondents preferred toilet flushing. Some comments to this effect include:
- 'I am a bit reluctant to use it for garden watering as this might have a negative impact on the plants due to the chemicals used during processing. However for toilet flushing, I don't have a problem.'
- 'I am very concerned about using greywater for gardening because sometimes people drink water that they use to water plants, and it will be a little bit unsafe.'
- 'My only concerns are watering vegetable gardens...'
The statement in the questionnaire reads 'I am comfortable using treated greywater originating from the hand basins (WITS) / bath tubs and showers (UJ) within the building for toilet/urinal flushing'.
The issue of choice
A high percentage of WITS respondents (Fig. 5) were prepared to use treated greywater for toilet/urinal flushing or garden watering without the compulsion of a water shortage. At UJ, a similar high percentage of respondents were prepared to use treated greywater for toilet/ urinal flushing or garden watering without the compulsion of a water shortage. Three months after implementation at UJ, there was a notable decrease (from 64% to 39%) in the percentage of respondents making this claim. The operational issues experienced at UJ shortly after GWR implementation, and discussed in the section above, were likely to have caused this decrease. Also visible in Fig. 5, is the higher percentage of respondents at WITS (the university academic building) who disagreed with the statement (i.e. 'I will only be prepared to use treated greywater for toilet/urinal flushing or garden watering during a water shortage') than at UJ (the university residential building).
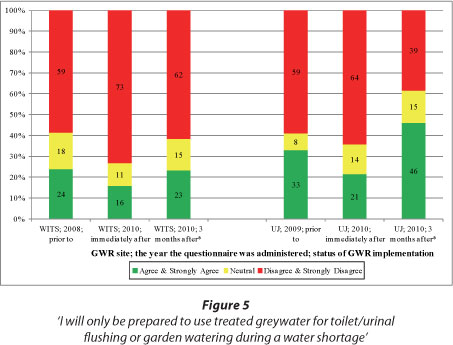
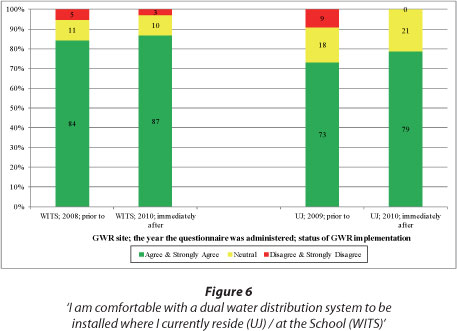
Figure 6 also displays responses to a second issue of choice: a high percentage of WITS and UJ respondents were comfortable for a GWR system to be installed at the School and residence respectively before and after implementation. Although marginal, the results in Fig. 6 show a larger percentage of positive respondents at WITS than at UJ.
Highlights of perceptions expressed above were:
- Amongst the potential uses for greywater presented to respondents (i.e. toilet flushing and irrigation), toilet flushing was preferred. This was due to the perception of possibly less contact with the greywater if used for flushing than if used for irrigation, and the potential harm greywater posed to irrigated plants.
- There was general preference amongst respondents for GWR for toilet flushing at WITS (the university academic building) than at UJ (the university residential building).
- Prior to implementation of the GWR systems, a significant percentage of respondents were comfortable using treated greywater for toilet flushing. After implementation, and the problems and/ or discomforts experienced by the respondents (e.g. turbid greywater in the toilet bowls often forming an unsightly ring above the greywater level, and unpleasant smells during flushing resulting from a period of irregular maintenance), there were less respondents comfortable about using treated greywater for toilet flushing. To rectify this, the project team ensured that respondents' concerns were extensively discussed, the GWR systems which required high maintenance were subsequently regularly maintained, and problems were speedily rectified.
- In Questionnaires 2, 3 and 4, smell, colour and greywater tariff were highlighted by respondents as the attributes of greywater that were important to them.
Attributes of greywater that were important to beneficiaries when reusing greywater and willingness to pay for these attributes
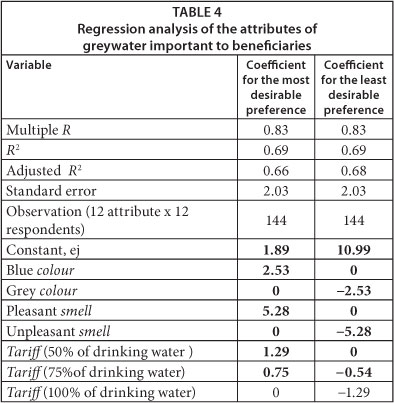
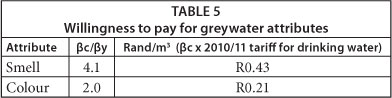
The attributes of greywater investigated were the attributes highlighted by respondents in Questionnaires 2, 3 and 4 as important to them - colour, smell and greywater tariff. Table 4 presents results of the regression analysis carried out using data collected using Table 3. The coefficients indicate the influence of a specific attribute on the overall preference. The more positive or negative the coefficient is, the more influence (positive or negative) that attribute has on overall preference. The coefficient of determination, R2 shows a modest but acceptable fit (0.66-0.69) between the data and the least squares model, as the closer R2 is to 1.00, the better the fit. The largest coefficient (±5.28 for smell) points to the most important attribute of greywater as far as beneficiaries were concerned. Colour was next in importance (±2.53) and then greywater tariff (±1.29). Table 5 shows that respondents were willing to pay twice as much for improving the smell than the colour of the greywater.
Economic analysis of implemented GWR systems
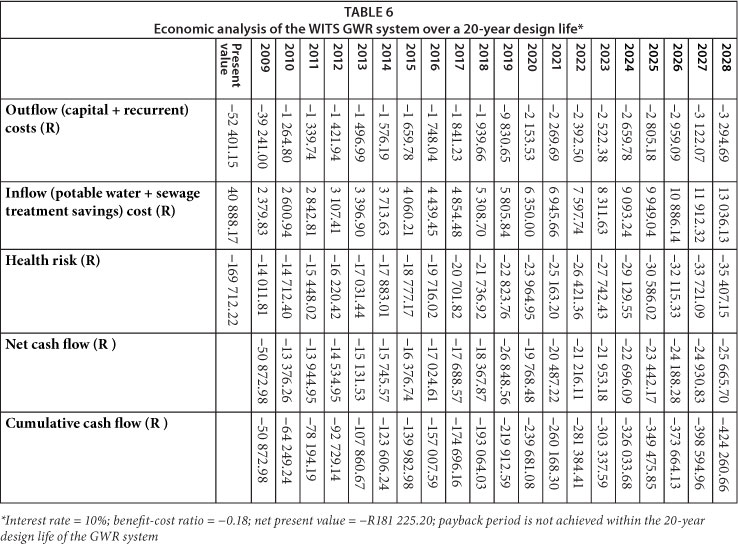
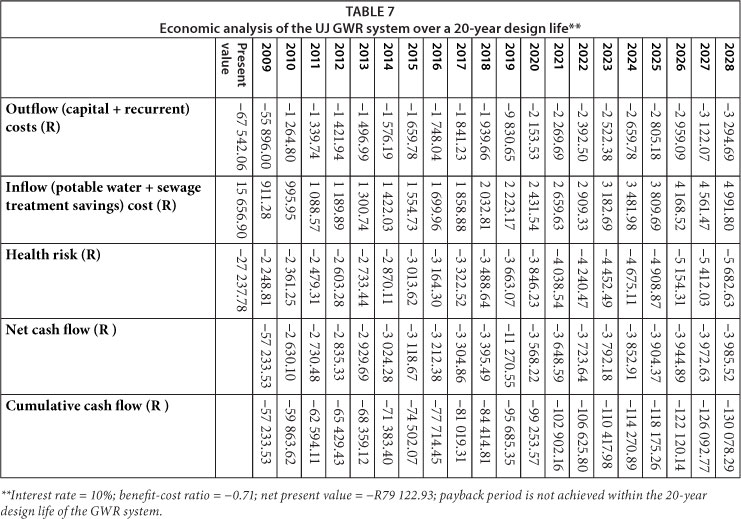
The following represent the figures and assumptions employed in the analysis presented in Tables 6 and 7:
- Capital costs comprised the costs of purchasing and retrofitting the GWR system.
- Recurrent costs comprised the costs of electricity for operating the pumps, cistern and chlorine blocks for colour and disinfection, respectively, and maintenance. Measured electricity consumption at both sites was approx. 2 KWh/ month, which is approx. R3/month. Forty-five cistern blocks (at approximately R8 per block per week) and 80 chlorine blocks (at approximately R10 per block) were required per annum. Maintenance was undertaken by students and hence not billable.
- The estimated GWR system design life was 20 years.
- Pumps are to be replaced every 10 years. The 2009 cost of pumps was R4 000.00.
- Potable water tariffs were estimated to increase at 10% per annum.
- Sewage tariffs were estimated to increase at 8% per annum.
- Electricity tariffs were estimated to increase annually by 30% from 2010 to 2012 and thereafter by 10%.
- The cost of cistern blocks was estimated to increase at 5% per annum.
- The service agreement item was a once-off cost for 12 months after installation.
- Due to the nature of the activities occurring within the different buildings, the WITS GWR system was estimated to be functional for 330 days (i.e. 90% of the year) while the UJ GWR system was estimated to be functional for 200 days (i.e. 55% of the year).
The results of the economic analysis conducted for the WITS and UJ systems are presented in Tables 6 and 7. Of note, payback periods at WITS and UJ were not achieved within the 20-year design life of the GWR systems. Unfortunately, the estimated annual costs of treating diarrhoea in the targeted populations due to GWR (represented by health risk) significantly contributed to the lack of payback within 20 years at both sites. In summary, both systems generated a net loss and were economically unfeasible.
If the health risk costs were excluded from the WITS economic analysis, payback period would be achieved within 16 years, benefit-cost ratio would be -0.78 and NPV would be -R11 512.98. At UJ, payback period would still not be achieved within the 20-year design life of the GWR system, benefit-cost ratio would be -0.23 and NPV would be -R51 885.15. The earlier payback period at WITS (i.e. 16 years) in comparison to UJ resulted from the larger volumes of potable water saved and thus reduced sewage treatment costs, as well as the lower capital cost of the GWR system. To achieve a payback period of 8 years while still excluding the health risk costs, 60% of the capital costs at WITS would have to be subsidised, while at UJ subsidies would have to cater for 98% of the initial capital cost and 100% of the projected 2019 cost of the replacement pumps. Other measures that may reduce the payback period include higher potable water and sewage treatment tariffs, larger savings in potable water volumes, or lower capital costs for the GWR systems.
CONCLUSION
This paper reports on GWR for toilet flushing at a university academic building at the University of the Witwatersrand (WITS) and at a university residential building at the University of Johannesburg (UJ). The objectives of the study were (i) to describe beneficiaries' perceptions of GWR for toilet flushing at the above sites; (ii) to determine the attributes of greywater that were important to beneficiaries when reusing greywater and their willingness to pay for these attributes; and (iii) to analyse the economics (specifically benefits, costs, net present values and payback) of the implemented GWR systems. This study concludes with the following guidance for future GWR:
- The lower the possibility of contact with greywater, the more acceptable GWR is to potential beneficiaries. Hence, the preference expressed by respondents in this study for GWR for toilet flushing instead of GWR for irrigation.
- Non-residential buildings may likely be preferred to residential buildings for GWR. This was highlighted in this study as a higher percentage of respondents were generally in favour of GWR for toilet flushing at the university academic building than at the university residential building.
- Smell, colour and greywater tariff must be satisfactory to GWR beneficiaries. In this study, greywater smell was highlighted by beneficiaries as their most important greywater attribute, followed by colour and, thirdly, greywater tariff.
- To ensure the efficient functioning of GWR systems, it is important that there is regular engagement with beneficiaries, and maintenance and repair activities.
- For GWR to be economically feasible (in terms of payback period, net present value and benefit-cost ratio), initial and recurrent costs must be significantly lower than was experienced in this study.
- A cursory assessment of the above issues could result in GWR failure.
REFERENCES
ADEWUMI JR, ILEMOBADE AA and VAN ZYL JE (2010) Decision support for assessing the feasibility of integrated wastewater reuse projects in South Africa. Water Sci. Technol. Water Supply 10(2) 251-267. [ Links ]
CARDEN K, ARMITAGE N, SICHONE O and WINTER K (2007) The use and disposal of greywater in the non-sewered areas of South Africa: Part 2 - Greywater management options. Water SA 33 (4) 433-442. [ Links ]
BRADSHAW D, GROENEWALD P and LAUBSCHER R (2003) Initial Burden of Disease Estimates for South Africa, 2000. Medical Research Council of South Africa, Cape Town. [ Links ]
FARUQUI N and AL-JAYYOUSI O (2002) Greywater reuse in urban agriculture for poverty alleviation - A case study in Jordan. Water Int. 27(3) 387-394. [ Links ]
GHISI E and FERREIRA DF (2007) Potential for portable water savings by using rainwater and greywater in multi-storey residential buildings in Southern Brazil. Build. Environ. 42 2512-2522. [ Links ]
HURLIMANN AC AND McKAY JM (2007) Urban Australians using recycled water for domestic non-potable use - An evaluation of the attributes price, saltiness, colour and odour using conjoint analysis. J. Environ. Manage. 83 (1) 93-104. [ Links ]
ILEMOBADE AA, ADEWUMI JR and VAN ZYL JE (2009) Framework for assessing the viability of implementing dual water reticulation systems in South Africa. Water SA 35 (2) 216-227. [ Links ]
ILEMOBADE AA, OLANREWAJU OO and GRIFFIOEN ML (2012) Greywater reuse for toilet flushing in high-density urban buildings in South Africa: a pilot study. WRC Report No. 1821/1/11. Water Research Commission, Pretoria. [ Links ]
KOSEK M, BERN C and GUERRANT RL (2003) The global burden of diarrhoeal disease, as estimated from studies published between 1992 and 2000. Bull. World Health Organ. 81 197-204. [ Links ]
LEWIN S, NORMAN R, NANNAN N, THOMAS E and BRADSHAW D (2007) Estimating the burden of disease attributable to unsafe water and lack of sanitation and hygiene in South Africa in 2000. S. Afr. Med. J. 97 (8) 755-762. [ Links ]
LIANG X and VAN DIJK MP (2010) Financial and economic feasibility of decentralized wastewater reuse systems in Beijing. Water Sci. Technol. 61 (8) 1965-1973. [ Links ]
MARCH JG, GUAL M and OROZCO F (2004) Experiences on greywater re-use for toilet flushing in a hotel (Mallorca Island, Spain). Desalination 164 241-247. [ Links ]
MAY-LE NG (2004) Household Greywater Reuse for Garden Irrigation in Perth. Environmental Engineering Project 640.406, Centre for Water Research, University of Western Australia, Perth. [ Links ]
OLANREWAJU OO (2013) Integrated risk management in the implementation of dual grey and potable water reticulation systems in South Africa. PhD thesis, University of the Witwatersrand, Johannesburg. [ Links ]
OTTOSSON J and STENSTROEM TA (2003) Faecal contamination of grey water, and associated microbial risks. Water Res. 37 645-655. [ Links ]
PEGRAM GC, ROLLINS N and ESPEY Q (1998) Estimating the costs of diarrhoea and epidemic dysentery in KwaZulu-Natal and South Africa. Water SA 24 (1). [ Links ]
PO M, KAERCHER JD and NANCARROW BE (2003). Literature review of factors influencing public perceptions of water reuse. Technical Report 54/03. December 2003. CSIRO Land and Water, Victoria, Australia. [ Links ]
RADCLIFFE J (2003) An overview of water recycling in Australia - Results from the recent ATSE study. Proc. Water Recycling Australia 2nd National Conference, 1-2 September 2003, Brisbane. Australian Water Association, Sydney. [ Links ]
RODDA N, CARDEN K and ARMITAGE N (2010) Sustainable use of greywater in small-scale agriculture and gardens in South Africa. WRC Report No. 1639/1/10. Water Research Commission, Pretoria. [ Links ]
SURENDRAN S and WHEATLEY AD (1998) Greywater reclamation for non-potable reuse. Water Environ. J. 12 (6) 406-413. [ Links ]
VAN ZYL HJ, VAN ZYL JE, GEUSTYN L, ILEMOBADE AA and BUCKLE JS (2006) Water consumption levels in selected South African cities. WRC Report No 1536/1/06. Water Research Commission, Pretoria. [ Links ]
WILSON Z and PFAFF B (2008) Religious, philosophical and environmentalist perspectives on potable wastewater reuse in Durban, South Africa. Desalination 228 (2008) 1-9. [ Links ]
WHO, WORLD HEALTH ORGANISATION (2007) Estimating the costs and health benefits of water and sanitation improvements at global level. J. Water Health 5 467. [ Links ]
WORLD BANK (2007) Cost of pollution in china: Economic estimates of physical damages. URL: http://web.worldbank.org/wbsite/external/countries/eastasiapacificext/ exteapregtopenvironment/0,contentmdk:21252897~ pipk:34003707~thesitepk:502886,00.html (Accessed 29 May 2013). [ Links ]
This paper was originally presented at the 2012 Water Institute of Southern Africa (WISA) Biennial Conference, Cape Town, 6-10 May 2012
* To whom all correspondence should be addressed +27 11 717-7153 fax: +27 86 553-5330 e-mail: adesola.ilemobade@wits.ac.za

