


Services on Demand
Article
 English (pdf)
 Article in xml format
 Article references
Indicators

Related links
-
 Cited by Google
 -
 Similars in Google
Share

 Permalink
Water SA
On-line version ISSN 1816-7950
Print version ISSN 0378-4738
Water SA vol.39 n.2 Pretoria Jan. 2013
TECHNICAL NOTE
An inorganic water chemistry dataset (1972-2011) of rivers, dams and lakes in South Africa
Jan Marten HuizengaI, *; Michael SilberbauerII; Rainier DennisIII; Ingrid DennisIII
IDepartment of Geology, Unit for Environmental Sciences and Management, North-West University, Private Bag X6001, Potchefstroom, 2520, South Africa
IIResource Water Quality Services, Department of Water Affairs, South Africa
IIICentre for Water Science and Management, Unit for Environmental Sciences and Management, North-West University, Private Bag X6001, Potchefstroom, 2520, South Africa
ABSTRACT
A national dataset of inorganic chemical data of surface waters (rivers, lakes, and dams) in South Africa is presented and made freely available. The dataset comprises more than 500 000 complete water analyses from 1972 up to 2011, collected from more than 2 000 sample monitoring stations in South Africa. The dataset includes the major ion chemical composition and numerous calculated variables that can, amongst others, be used to determine accuracy of the analysis. The methods described here have potential for improving quality control measures in water chemistry laboratories by detecting anomalous samples. The processed data are available in Excel spreadsheets and can be downloaded from the website of the Centre for Water Science and Management based at the North-West University (www.waterscience.co.za/waterchemistry/data.html).
Keywords: national data set, inorganic water chemistry, South Africa, surface waters
Introduction
The Department of Water Affairs in South Africa has had an extensive water monitoring programme in place since the early 1970s, which includes more than 2 000 monitoring sites in lakes, dams and rivers covering the entire country (Fig. 1). This monitoring programme has resulted in the availability of hundreds of thousands of chemical analyses for the major ions.
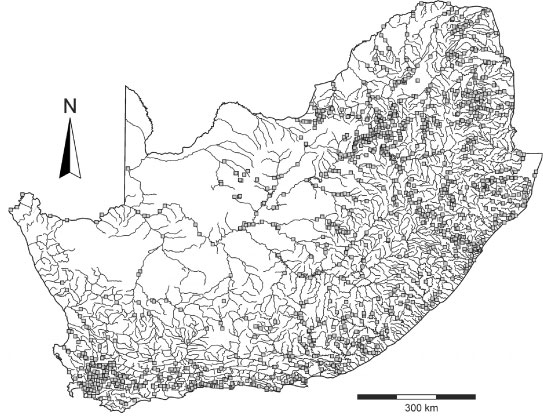
Figure 1
Map of South Africa showing the rivers and Department of Water Affairs sample monitoring stations (grey squares)
Up to now, selected data can only be obtained from the Department of Water Affairs upon request. Further, the dataset includes numerous incomplete analyses (see section 'Modifications of the dataset' for details) and also does not include any variables that can be used to test the accuracy of the analysis. In this paper, we describe how we have modified and reorganised these data addressing the abovementioned issues. The data are freely available in the form of user- friendly Excel spread sheets. We anticipate that the easy access of this dataset will be beneficial towards hydrogeochemical and environmental research in South Africa and will further enhance the South African National Chemical Monitoring Programme (e.g., Van Niekerk et al., 2009).
Water chemistry data of South African surface waters
Inorganic water chemistry data up to 1998 were obtained from the CSIR (Environmentek): the 'Water Quality on Disc, version 1.0'. Data from 1999 up to 2011 were obtained from the Department of Water Affairs as CSV files. Chemical variables that were determined include the following: pH, electrical conductivity (EC, mS/m), total alkalinity (measured as CaCO3 in mg/ℓ), the total dissolved solids (TDS, in mg/ℓ), and the concentrations of the following ions (all in mg/ℓ): sodium (Na+), potassium (K+), calcium (Ca2+), magnesium (Mg2+), ammonium ((NH4)+), silica (Si), fluoride (F), orthophosphate ((PO4)3-), chloride (Cl-), sulphate ((SO4)2-), nitrate and nitrite combined ((NO3)- + (NO2)-). Each individual analysis is characterised by a sample station identification code and/or point identification number, and a sampling date. A separate Excel file is available that comprises a brief description of the sample locality including GPS coordinates, the specific sample taken (e.g., spring, river, treatment works, etc.), total number of samples taken at the locality, and the first and last date of sample collection.
Modifications of the dataset
The original dataset has been extensively modified, which includes the removal of incomplete analyses and the addition of extra chemical variables calculated from concentrations of the major ions (Table 1).
Removal of incomplete analyses
A chemical analysis is considered to be incomplete (though not necessarily incorrect) if one of the following ions was not analysed for: Na+, Ca2+, Mg2+, K+, Cl-, (SO4)2-, and (HCO3)- + (CO3)2-(measured as the total alkalinity). These chemical species are critically important for the calculation of variables that can be used to test the analysis for its accuracy (e.g., charge balance, ionic strength, calculated EC and calculated TDS). Other ions including (NH4)+, Si, F-, (PO4)3-, and ((NO3)-+ (NO2)-) generally occur in such small molar concentrations that they are not essential for the calculation of the abovementioned variables. Further, chemical analyses without a pH were also considered to be incomplete as the pH is essential to calculate the concentrations of (HCO3)- and (CO3)2- from the total alkalinity. Incomplete analyses were removed from the dataset.
After removal of the incomplete analyses, the total number of analyses is 509 919. The relative distribution of number of complete water analyses over the different primary catchment areas is shown in Fig. 2, illustrating that the large majority of the analyses are available from the north-western (Limpopo, Olifants and Vaal catchments) and south-eastern parts of South Africa (Berg and Breede catchments). Most water analyses are available from the late 1970s to the late 1990s; from 2000 onwards there is a significant decline in the amount of water analyses available (Fig. 3).

Figure 2
The primary catchment areas of South Africa, showing the frequency of water chemistry analyses in each catchment as a percentage of the total number of complete analyses in the database as described in the text.
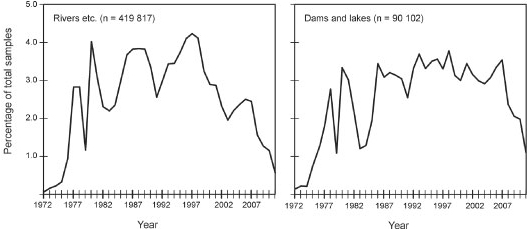
Figure 3
Relative amount of complete water analyses per year (1972-2011) for rivers (left) and dams/ lakes (right)
Addition of chemical variables
We included several chemical and water quality variables (Table 1) that were calculated from the major ions to make the dataset as complete and attractive as possible for any user. The most important additions are listed and described below.
Concentrations of (bi)carbonate
The concentrations of (HCO3)- and (CO3)2- are essential in order to obtain a complete analysis of all the anions present in the solution. These concentrations are required to calculate the electrical conductivity and the ionic strength of the solution, as will be described later. The molar concentrations of (HCO3)-and (CO3)2- are calculated from the molar total alkalinity (TALmolar; TALmolar = TAL (as CaCO3 in mg/ℓ) / molar mass CaCO3) and the pH (e.g., Appelo and Postma, 2005):
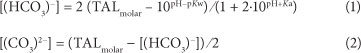
where:
Kw is the dissociation constant for water (1014)
Ka the equilibrium constant (10"10·3) for the reaction
(HCO3)- + H2O (CO3)2" + H3O+.
Stoichiometric charge balance
The stoichiometric charge balance (SCB) is widely used to determine whether a chemical analysis of a water sample is accurate. The SCB can be defined as follows (e.g., Appelo and Postma, 2005):

where:
Σ [cations] and Σ [anions] denote the sum of the charge-corrected cations and anions (meq/ℓ).
The chemical analysis is considered to be accurate if -5% < SCB < +5% (Zhu and Andersen, 2002; Appelo and Postma, 2005). Inaccurate analyses are either due to analytical error or some ions that are presumed to be minor are not included in the chemical analysis (e.g., Appelo and Postma, 2005). For example, it is likely that surface waters affected by acid mine drainage (AMD) will show a negative value for the charge balance because significant amounts of e.g., Fe3+ , Al3+, Mn2+, etc., are present in AMD-affected surface waters (e.g., Lee et al., 2002). These elements are not included in the standard analyses by the Department of Water Affairs.
Ionic strength
The ionic strength (7) is a measure of the effect of the charge of the dissolved ions and is calculated as follows:

where:
mi and z. denote the concentration (mol/ℓ) and charge of ion i, respectively (e.g., Hem, 1985).
The ionic strength is used in the calculation of, e.g., the electrical conductivity (see next section) and the activity of the ions (e.g., Appelo and Postma, 2005).
Calculated electrical conductivity
The electrical conductivity is calculated (ECcalc) using the method described by McCleskey et al. (2012). It is calculated from the chemical composition using the relation:

where:
λi denotes the ionic molal conductivity for ion i.
The ionic molal conductivity can be calculated from the temperature and ionic strength (I) (McCleskey et al., 2012):

where:
AT is a temperature-dependent variable
B a constant, both of which can be found in Table 1 in
McCleskey et al. (2012).
The calculated EC can be compared to the measured EC (ECmeas) (McCleskey et al., 2012):

The following should be noted for EC , in the South African dataset: (i) we used a temperature of 20°C to calculate A and λ° (a 1°C temperature difference results in a change of ECcalc of ~2% if ECcalc is ~500 µS/cm), and (ii) ion pairs were not included in the conductivity calculation as the chemical speciation is not part of the dataset.
Evaluation of δEC of close to 1 800 natural water samples by McCleskey et al. (2012) shows that δEC falls within the range of ±10%. In addition to the SCB, δEC can be used as an accuracy test for water analyses of surface waters. Keeping in mind the limitations (i.e., exclusion of ion pairs and the fixed temperature of 20°C) and the range of natural samples as reported by McCleskey et al. (2012), we suggest that a δEC value between ~+15 and ~-15% is acceptable for routine laboratory analysis of natural surface waters in South Africa.
Calculated total dissolved ions
The calculated total dissolved solids (TDScalc) is the sum of all anions and cations in mg/ℓ. The Si concentration (mg/ℓ) is for this purpose recalculated to the SiO2 concentration according to SiO2 (mg/ℓ) = 2.14 Si (mg/ℓ). In the same way as for EC, the TDScalc can be compared to the measured TDS (TDSmeas):

where:
TDScalc can never exceed TDSmeas (i.e., δTDS < 0). Acceptable values of δTDS for water samples to be accurate are between 0 and -15%.
SA water characterisation parameters
Based on a statistical evaluation, the surface waters in South Africa can be characterised by 3 factors, namely, chemical weathering (reflected in the total alkalinity), chloride salinisation, and sulphate contamination (Huizenga, 2011). These three factors are calculated from the molar concentrations of the relevant chemical species as follows (modified after Huizenga, 2011):
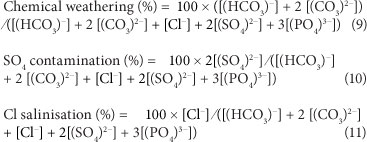
Other characterisations are possible based on different combinations of ions (e.g., Day and King, 1995).
Sodium adsorption ratio (SAR)
The sodium adsorption ratio (SAR) is an index of the suitability of water for irrigation (e.g., Lesch and Suarez, 2009). We have included the SAR in the datasets as irrigation for agricultural purposes is one of the prime uses of natural surface waters in South Africa. The SAR is calculated from the molar concentrations of Na, Ca, and Mg:

The SAR may need to be adjusted if the water has relatively high Ca and bicarbonate concentrations (e.g., Lesch and Suarez, 2009), which is the case in certain areas in South Africa, depending on the geology. In that case the Ca concentration in Eq. (10) must be adjusted for the precipitation of CaCO3. We have adopted the method described by Lesch and Suarez (2009) to calculate the adjusted SAR. This process involves numerous calculation steps, which are not repeated here. A detailed description of the calculation method can be found in the paper by Lesch and Suarez (2009).
Dataset information and availability
The files that are available are shown in Table 2. All Excel files are 'values only' files, i.e. the formulae used to calculate variables listed in Table 1 are not included in this file. A calculation template is, however, available that includes all formulae used. The worksheets in all files are protected with the password 'quality' (in lower case) in order to avoid accidental modifications. Data that are not available or variables that could not be calculated due to missing data are indicated with the cell value '-9999'. It must be noted that during the transfer from the original DWA database, results that were flagged 'below detection limit' may appear as zero mg/ℓ.
All datasets are available free of charge from the Centre for Water Science and Management (North-West University) website: www.waterscience.co.za/waterchemistry/data.html. More information on the analytical methods and detection limits for the different chemical species can be obtained from the Department of Water Affairs website: www.dwa.gov.za/ iwqs/report.aspx. This website also shows the e-mail addresses of the people who should be contacted in order to obtain more recent water quality data. Finally, although care was taken in the water analyses and compiling the datasets, it must be noted that neither the Department of Water Affairs nor the authors can be held responsible for any errors in the dataset provided and any interpretations based thereon.
Conclusion and recommendations
The extensive water chemistry database for South African surface waters is a valuable source of information about the status of water resources and changes during the past 4 decades. However, the dataset contains many inconsistencies in chemical analysis results, which the user needs to take into consideration before using the data for situation or trend analysis. We have included numerous methods to test this consistency in the available dataset.
We recommend that the Department of Water Affairs incorporate the tests proposed in this paper into their laboratory information management system. Flagging of inconsistencies while the original sample is still available for re-analysis would considerably improve the effectiveness of the national monitoring network at minimal extra cost. This approach could result in a more cost-effective workflow and eliminate wasted sampling effort.
Acknowledgements
Comments by two anonymous reviewers improved the manuscript. This project was financially supported by the National Research Foundation. The Department of Water Affairs is gratefully acknowledged for access to their water quality data.
References
APPELO CAJ and POSTMA D (2005) Geochemistry, Groundwater and Pollution (2nd edn). AA Balkema, Rotterdam. 649 pp. [ Links ]
DAY JA and KING JM (1995) Geographical patterns, and their origins, in the dominance of major ions in South African Rivers. S. Afr. J. Sci. 91 299-306. [ Links ]
HEM JD (1985) Study and Interpretation of the Chemical Characteristics of Natural Water (3rd edn.) US Geological Survey Water-Supply Paper 2252. 263 pp. [ Links ]
HUIZENGA JM (2011) Characterisation of the inorganic chemistry of surface waters in South Africa. Water SA 37 401-410. [ Links ]
LESCH SM and SUAREZ DL (2009) A short note on calculating the adjusted SAR index. T. ASABE 52 493-496. [ Links ]
LEE G, BIGHAM JM and FAURE G (2002) Removal of trace metals by coprecipitation with Fe, Al and Mn from natural waters contaminated with acid mine drainage in the Ducktown Mining District, Tennessee. Appl. Geochem. 17 569-581 [ Links ]
McCLESKEY RB, NORDSTROM DK, RYAN JN and BALL JW (2012) A new method of calculating electrical conductivity with applications to natural waters. Geochim. Cosmochim. Acta 77 369-382. [ Links ]
VAN NIEKERK H, SILBERBAUER MJ and HOHLS BC (2009) Monitoring programme revision highlights long-term salinity changes in selected South African rivers and the value of comprehensive long-term datasets. Environ. Monit. Assess. 154 401-411. [ Links ]
ZHU C and ANDERSEN G (2002) Environmental Applications of Geochemical Modelling. Cambridge University Press, London. 284 pp. [ Links ]
Received 25 October 2012
Accepted in revised form 28 March 2013.
* To whom all correspondence should be addressed. +27 18 2992526; fax: +27 18 2992487; e-mail: jan.huizenga@nwu.ac.za

