


Services on Demand
Article
 English (pdf)
 Article in xml format
 Article references
Indicators

Related links
-
 Cited by Google
 -
 Similars in Google
Share

 Permalink
Water SA
On-line version ISSN 1816-7950
Print version ISSN 0378-4738
Water SA vol.39 n.2 Pretoria Jan. 2013
Predicted impacts of land use change on groundwater recharge of the upper Berg catchment, South Africa
M AlbhaisiI; L BrendonckII; O BatelaanI, III, IV, *
IDept. of Hydrology and Hydraulic Engineering, Vrije Universiteit Brussel, Pleinlaan 2, 1050 Brussels, Belgium IILab. of Aquatic Ecology and Evolutionary Biology, KU Leuven, Charles Deberiotstraat 32 - box 2439,3000 Leuven
IIIDept. Earth and Environmental Sciences, KU Leuven, Celestijnenlaan 200E, 3001 Heverlee, Belgium
IVSchool of the Environment, Flinders University, GPO Box 2100, Adelaide SA 5001, Australia
ABSTRACT
Land use change is a major factor influencing catchment hydrology and groundwater resources. In South Africa, the management of scarce water resources is a big concern. The study area, the upper Berg catchment, Western Cape, South Africa, contains strategic water resources. The catchment has undergone many changes in recent years, not least of all the construction of a dam on the upper reach. To reduce water loss due to evapotranspiration, non-native hill slope vegetation upstream of the Berg River Dam was cut down. It was hypothesised that recharge has been increased due to this change in vegetation. The objectives of this study were to determine land use changes in upper Berg catchment using multi-temporal Landsat images from 1984, 1992, 2002, and 2008, and to predict the impact of these land use changes on groundwater recharge. For the simulation of groundwater recharge the distributed hydrological model WetSpa was used. Forest plantations lost 72% (18.8 km2) of their areal extent between 1984 and 2008, due to deforestation as part of a plan to implement the ecological Reserve as required by national water policy; the area of barren land increased by 15.7 km2 in the same period. The high increase in precipitation, especially in the period of 2005-2009, combined with the change in land use in the study area resulted in a highly increased (278%) predicted mean groundwater recharge. Simulated groundwater recharge shows strong spatial differences for each evaluated year. The effect of the rapid clearing of non-native hill slope vegetation upstream of the Berg River Dam for the land use scenario of 2008 was tested to check if clearing is an important factor in the increase of groundwater recharge. Hence, we simulated the whole time-series from 1984-2004 (21 years) with the land use map from 2008 instead of the land use maps for 1984, 1992 and 2002. A systematic increase of about 8% per year for the 21-year period, due to the change in land use from the different years to that of 2008, is predicted , which confirms that the clearing of the non-native hill slope vegetation is of considerable importance for the increase in groundwater recharge.
Keywords: Berg catchment, ecological Reserve, WetSpa, remote sensing
INTRODUCTION
Groundwater is considered to be one of the most important, and in many semi-arid areas one of the most scarce, natural resources. Over the past decade there has been an increasing focus on studies, analyses and exploration of groundwater, for the purpose of sustainable exploitation. Policy intention is to maintain a balance between demand, quantity and quality of groundwater. Land use change is a major factor affecting the groundwater system (Calder, 1993). Through history, intense human activities, including industrialisation, mining, urbanisation, agriculture, damming, etc., have resulted in significant and clear changes in the landscape with impact on the water balance of surface and groundwater systems (Bronstert, 2004).
Collecting accurate and timely information on land use is important for land use change detection (Giri et al., 2005) as a basis for predicting impact on water resources. There are various methods that can be used in the collection of land use data but the use of satellite remote sensing technologies can greatly facilitate the process (Gautam et al., 2003). Compared with traditional ground-based surveys, satellite remote sensing provides greater amounts of information on the geographic distribution of land use in a relatively cost- and time-saving way for- assessments on a regional scale (Kachhwala, 1985, Rogan and Chen, 2004; Yuan et al., 2005). Space-borne remotely sensed data may be particularly useful in developing countries where recent and reliable spatial information is lacking (Dong et al., 1997). Remote sensing technology and geographic information systems (GIS) provide efficient methods for analysis of land use issues and tools for land use planning and modelling (Star et al., 1997; Chilar, 2000). By understanding the driving forces of land use development in the past, managing the current situation with modern GIS tools, and modelling the future, one is able to develop plans for multiple uses of natural resources and nature conservation. Ringrose et al. (2005) stressed the need to map land use and land-cover change in Africa, as, already more than a decade previously, land use change was accelerating and causing widespread environmental problems. This changing pattern of land use and land cover reflects changing economic and social conditions taking place throughout the continent. Monitoring such changes is important for coordinated actions at national and international levels (Bernard et al., 1997).
Different methods have been developed for land use change detection. Yuan et al. (1998) divide the methods for change detection and classification into pre-classification and post-classification techniques. The pre-classification techniques apply various algorithms directly to time-series satellite imageries to generate 'change' versus 'no change' maps. These techniques locate changes but do not provide information on the nature of change (Singh, 1989; Ridd and Liu, 1998; Yuan et al., 1998). On the other hand, post-classification comparison methods use separate classifications of images acquired at different times to produce difference maps from which 'from-to' change information can be generated (Jensen, 2005). Although the accuracy of the change maps is dependent on the accuracy of the individual classifications and is subject to error propagation, the classification of each date of imagery builds a historical series that can be more easily updated and used for applications other than change detection. The post-classification comparison approach also compensates for variation in atmospheric conditions and vegetation phenology between dates, since each classification is independently produced and mapped (Yuan et al., 1998, 2005; Coppin et al., 2004).
In assessing land use, presence, distribution and type of vegetation type play an important role in the estimation of water yield in a catchment. Coniferous forests, for example, consume more water than deciduous forests, while shrubs and grasslands use less water than forests (Bosch and Hewlett, 1982; Brown et al., 2005). Hope et al. (2009) investigated the association between annual river yields and AVHRR remotely-sensed changes in vegetation cover in a large mountainous fynbos catchment for 18 years. From the results it is concluded that the spectral vegetation index NDVI (normalised difference vegetation index) has a negative relationship with the river yield at low altitudes. Depending on climate, vegetation is a strong determining factor for the surface hydrology. For example, Robinson et al. (2003) found no significant effect of a change in forest cover on peaks and low flows for 25 basins across northwestern Europe, while deforestation led to an increase in base flow in more temperate climates (Hornbeck et al., 1993).
Land use change also has a direct influence on the catchment hydrology (Bhaduri et al., 2000; Ott and Uhlenbrook, 2004; Tang et al., 2005). This influence can be either measured as, e.g., a change in river discharge, or predicted by hydrologi-cal model simulations. If a fully distributed model is used and combined with land use change scenarios, it allows for assessing the impact of the change on groundwater recharge, base-flow and total river discharge.
Niehoff et al. (2002) used the land use change modelling kit (LUCK) in conjunction with a modified version of the physically-based hydrological model WaSiM-ETH for flood prediction. Tang et al. (2005) applied the Land Transformation Model (LTM) in combination with the Long-Term Hydrologic Impact Assessment (LTHIA) model (Bhaduri et al., 2000). Lin et al. (2007) tested the generalised watershed loading functions model using predicted land use from the CLUE-S model (Verburg et al., 1999, 2004). McColl and Aggett (2007) tested the hydrological model HEC-HMS together with the land use forecasting model 'What if?'. In these studies land use change models have shown to provide useful information that enables assessment of the impact of future land use on the hydrology.
However, the abovementioned models do not explicitly treat the spatial variability of groundwater recharge but focus on surface hydrological processes. Klöcking and Haberlandt (2002), Batelaan et al. (2003) and Batelaan and De Smedt (2007), on the other hand, investigated impacts of land use changes on groundwater at mesoscale with a fully-distributed hydrologic model. Dams et al. (2008) assessed the impact of future (until 2020) land use change on groundwater systems by coupling a land-use change model (CLUE-S) with a water balance model (WetSpass) and a steady-state groundwater model (MODFLOW).
The objective of this study was to predict the impact of land use change on groundwater recharge using time-series land use data derived from satellite images with a distributed hydrologi-cal model (WetSpa), for the upper Berg catchment, Western Cape, South Africa. The Berg catchment was selected because it has undergone many changes in recent years; a dam was built on the river creating a new ecological system behind it; and non-native hill slope vegetation upstream of the dam was cleared. It was hypothesised that evapotranspiration would be reduced and recharge increased due to this change in land use.
Wetspa model
WetSpa (Water and Energy Transfer between Soil, Plant and Atmosphere) is a grid-based distributed hydrologic model for water and energy transfer between soil, plants and atmosphere. It was originally developed by Wang et al. (1996) and adapted for flood prediction on hourly time steps by De Smedt et al. (2000, 2004) and Liu et al. (2003, 2004, 2005).
For each grid cell, 4 layers are considered in the vertical direction, representing vegetation, root, transmission and saturated zone. The hydrologic processes considered in the model are precipitation, interception, depression storage, surface runoff, infiltration, evapotranspiration, interflow, percolation, groundwater drainage and snowmelt. The model predicts peak discharges and hydrographs, which can be defined for any location in the channel network. Runoff from different cells in the watershed is routed to the watershed outlet depending on flow velocity and wave damping coefficient by using the diffusive wave approximation method. An approximate solution, proposed by Liu et al. (2003) in the form of an instantaneous unit hydrograph (IUH), is used in the model, relating the discharge at the end of a flow path to the available runoff at the start of the flow path as a function of spatial differences of topography, soil and land use along the flow path:
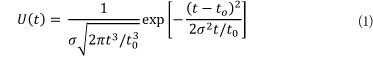
where:
t [T] is time
U(t) [T-] is the flow path unit response function
t0 [T] is the mean flow time
σ [T] is the standard deviation of the flow time.
Parameters t0 and σ are spatially distributed, and can be obtained by integration along the topographically determined flow paths as a function of flow celerity and dispersion.
A mixture of physical and empirical relationships is used to describe the hydrological processes in the model. Interception reduces the precipitation to net precipitation, which on the ground is separated into rainfall excess and infiltration. Rainfall excess is calculated using a moisture-related modified rational method with a potential runoff coefficient depending on land cover, soil type, slope, rainfall intensity, and antecedent moisture content of the soil. The calculated rainfall excess fills the depression storage at the initial stage and runs off the land surface simultaneously as overland flow (Linsley et al., 1982). The infiltrated part of the rainfall stays as soil moisture in the root zone, moves laterally as interflow or percolates as ground-water recharge depending on the moisture content of the soil. Both percolation and interflow are assumed to be gravity-driven in the model. Percolation out of the root zone is determined by the hydraulic conductivity, which is dependent on the moisture content as a function of the soil pore size distribution index. Interflow is assumed to occur in the root zone after percolation and becomes significant only if the soil moisture is higher than field capacity. Darcy's law and a kinematic approximation are used to estimate the amount of interflow generated from each cell, as a function of hydraulic conductivity, moisture content, slope, and root depth. The actual evapotranspira-tion from soil and plants is calculated for each grid cell using the relationship developed by Thornthwaite and Mather (1955), as a function of potential evapotranspiration, vegetation stage, and moisture content in the cell.
The total water balance for a raster cell is composed of the water balance for the vegetated, bare-soil, open water and impervious parts of each grid cell. This allows one to account for the heterogeneity of the land use per cell, which is dependent on the resolution of the raster cell.
For each grid cell, the root zone water balance is simulated by equating inputs and outputs:

where:
D [L] is root depth
θ [L3L-3] is soil moisture
t [T] is time
I [UP1] is initial abstraction including interception and depression losses
V [LT1] is surface runoff or rainfall excess
E [LT1] is evapotranspiration
R [LT1] is percolation out of the root zone
F [LP1] is interflow.
Although the spatial variability of land use, soil and topographic properties within a watershed are considered in the model, the groundwater response is modelled on sub-catchment scale.
WetSpa uses a water balance equation for the saturated zone:

where:
SGs(t) and SGs(t-1) are groundwater storage of the subcatchment at time step t and t-1 (mm)
N is the number of cells in the subwatershed
Ai is the cell area (m2)
As is the subcatchment area (m2)
EG (t) is the average evapotranspiration from groundwater storage of the subcatchment (mm)
QG (t) is the groundwater discharge (m3s-1)
RG.(t) is the percolation out of the root zone over the time interval (mm).
Groundwater or percolation out of the root zone RG.(t) is calculated based on Darcy's law and Brooks and Corey's relationship between hydraulic conductivity and effective saturation (Brooks and Corey, 1966; Eagleson, 1978):
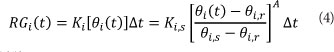
where:
K.[0.(t)] is the effective hydraulic conductivity corresponding to the average soil moisture content at time t (mm-h-1)
Δt is the time interval (h)
K.,s is the cell saturation hydraulic conductivity (mm-h-1)
θ. is the soil porosity (m3m-3)
θ.γ is the cell residual moisture content (m3m-3)
A is the pore disconnectedness index, determined as
A = (2+3B)/B, in which B is the cell pore size distribution index.
Groundwater discharge QGs(t) is calculated based on the simple concept of a non-linear reservoir with a storage exponent of 2 (Wittenberg and Sivapalan, 1999). The general groundwater discharge equation can be expressed as:
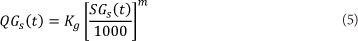
where:
QGJtt) is the average groundwater flow at the subcatchment outlet (m3-s-1)
SGs(t) is the groundwater storage of the subcatchment at time t (mm)
m (-) is an exponent
m = 1 for linear reservoir and m = 2 for non-linear reservoir
Kℓ is a groundwater recession coefficient (s-1), which is dependent upon area, shape, pore volume and transmissiv-ity of the subcatchment, and can be estimated from recession portions of stream flow hydrographs if measurement data at the subcatchment outlet are available.
The WetSpa distributed model potentially involves a large number of model parameters. Most of these parameters can be assessed from field data like hydrometeorological observations, maps of topography, soil type and land use. However, comprehensive field data are seldom available to fully support specification of all model parameters. In addition, some model parameters are of a more conceptual nature and cannot be directly assessed. Hence, some parameters have to be determined through a calibration process. The model parameters that have to be determined through calibration are listed in Table 1 and their role in the different model components of WetSpa is shown in Fig. 1 (Liu et al., 2003; Liu and De Smedt, 2005; Bahremand et al., 2007). All other model parameters, i.e. spatial hydrological properties related to soil type, land use, and topography, are derived from topography or provided via lookup tables for soil and land use maps. Hydrological characteristics such as flow direction, flow accumulation, stream network, stream order, slope of land-river, hydraulic radius and sub-catchments are delineated from DEM.
TABLE 1
Global WetSpa model parameters optimised during calibration: description, symbols, preset feasible range (Shafii and De Smedt, 2009)
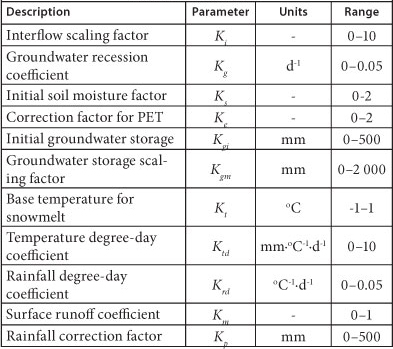
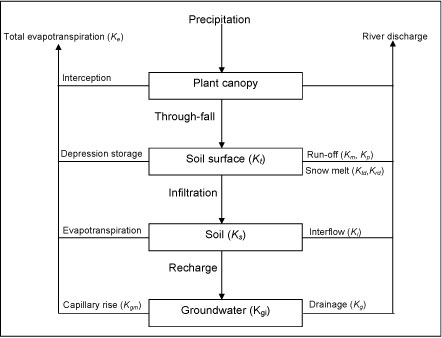
Figure 1
Schematic representation of the general model structure of WetSpa: arrows represent hydrological processes, boxes represent storage zones, and symbols between brackets refer to WetSpa global model parameters to be calibrated as explained in Table 1. From: Shafii and De Smedt (2009).
Beside peak discharges and river flow hydro-graphs, the main outputs of the model are spatially distributed hydrological characteristics, such as soil moisture, infiltration rates, groundwater recharge, surface water retention, runoff, etc.
Methodology
Study area and data
The WetSpa model was applied to the Berg River catchment, Western Cape, South Africa. The Berg catchment comprises 9 000 km2 and is divided into 12 quaternary catchments starting from the source of the Berg River with G10A catchment and ending at the Atlantic Ocean with G10M catchment. G10A has a surface area of 172 km2 of which 7 km2 is occupied by the lake of the Berg River Dam, which started to operate in the last quarter of 2007. The study area is the upper part of the G10A catchment covering 36.3 km2 from the source of the river until the gauging station of G10A just above the dam (Fig. 2). G10A is characterised by a Mediterranean climate with mean annual precipitation of 1 603 mm-yr-1 and mean annual potential evaporation of 1 475 mm-yr-1 (DWAF, 2007). The catchment (G10A) has a relatively high density drainage network with a mean annual runoff of 1 015 mm-yr-1 (DWAF, 2007). The study area (upper G10A) is mountainous and has an elevation ranging between 261 and 1 560 m. In contrast, the more downstream part of the Berg River catchment is relatively flat. The area is dominated by sandy loam soil and the aquifer consists of fractured sandstone (Midgley et al., 1994). Data from two meteorological stations, with daily measurements of precipitation and potential evapotranspiration from 1984 till 2009, were used in the model. The meteorological time series show that the maximum precipitation is observed in June (173 mm) and the lowest in January (3 mm). The potential evapo-transpiration varies from about 0.1 mm in June to 8.6 mm in December with a mean value of 3.2 mm. Figure 3 shows the continuous time series of the precipitation and evapotranspiration data in the catchment. The precipitation shows an increasing trend especially from 2007 until 2009; on the other hand the evapotranspiration shows no significant trend.
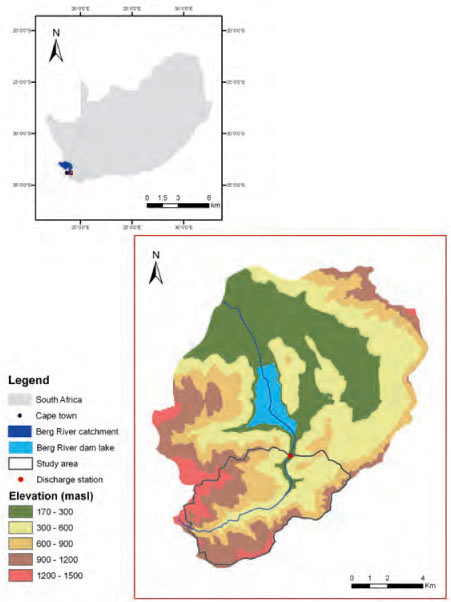
Figure 2
Map of the Berg River Catchment, the area in red box is G10A quaternary catchment including the study area indicated by the grey boarders (from DWAF, 2007)
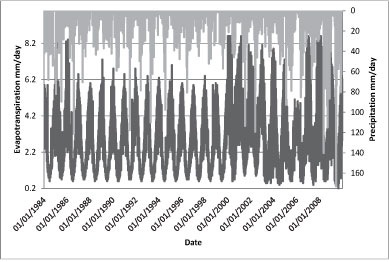
Figure 3
Time series of the precipitation and potential evapotranspiration in the catchment
For the discharge gauging station a continuous daily time series from the middle of March 2008 until end 2009 is available. The highest discharge (about 281 m3-s-1) is observed in September 2009, while the lowest discharge (about 0.09 m3-s-1) is measured in March 2009. Another gauging station, operational from 1979 till 2007, is now located in the middle of the lake of the Berg River Dam. The data from this station were not used as the Berg River was severely modified by abstraction from the river and the release of some 17 MCM-yr-1 for summer irrigation from the Theewaterskloof Dam into the upper Berg River at the Berg River Syphon, upstream of the present dam (DWAF, 2007).
The report of DWAF, 2007 suggested that the two main impacts that could result from the construction of the Berg River Dam are: raising of groundwater levels in the immediate vicinity of the dam (with a potential for waterlogging), and modifying the exchange of water between the river and the groundwater system. The report concluded that the areas directly east and north of the dam may be affected by these two impacts. This leads to ignoring the effect of the dam lake on the recharge of the study area, as the lake is located outside of the borders of the study area.
A digital elevation map (DEM) was extracted from the USGS/NASA Shuttle Radar Topography Mission (SRTM). The International Centre for Tropical Agriculture (CIAT) has processed these data in order to provide seamless continuous topographic surfaces. Areas with regions of no data in the original SRTM data have been filled using interpolation methods described by Reuter et al. (2007). STRM data were evaluated by ground truth elevation data of the study area provided by the South African Department of Land Affairs (DWAF, 2006). Land use maps were extracted from LANDSAT images freely available from the USGS website, (http://glovis.usgs.gov/). The images were stored in the Geographic Tagged Image-File Format (GeoTIFF). This format enables referencing of a raster image to a known geodetic model or map projection. Each band of the LANDSAT data in the GeoTIFF format was delivered as a grey-scale, uncompressed, 8-bit string of unsigned integers. Geographically, the study area is located between latitudes 33º and 34º south and longitudes 18º and 20º east. The images are located on Path Number 175 and Row Number 83. Four images were selected to extract land use maps. The selection of the images is based on the criteria:
• The images had no cloud cover over the study area
• The images were of good quality according to the USGS rating criteria
• The resolutions of the images were similar
• The images cover the same period as the meteorological data time series.
The data used for referencing include:
• Digital elevation map (DEM) from SRTM
• Aerial photos of 2007 showing land use and salient features of the study area
• Land use maps of the years 1977 and 1997 with a scale of 1:50000
• SPOT image obtained from CSIR, South Africa. This image is used to support the land use cover extraction in a combination with DEM, aerial photos and land use maps. The resolution of the image is 10 m by 10 m and date of acquisition is 03 May 2008.
Four land use maps were created by a maximum likelihood classification for the years 1984, 1992, 2002 and 2008.
Model application
The WetSpa simulation was set up with a spatial resolution of 30 m by 30 m. A threshold value of 50 pixels is used for extracting the stream network from the DEM. This threshold results in 241 extracted sub-basins, which have an average sub-basin area of 0.15 km2. For the slope grid a minimum slope of 0.01% is used in order to avoid stagnant water or extreme low velocities for the surface runoff.
Based on the soil type map, physical parameters including saturated hydraulic conductivity, soil porosity, field capacity, residual moisture, pore distribution index, plant wilting point and initial moisture are created based on the soil texture by means of an attribute lookup table. Based on the land use map, root depth, vegetation fraction, interception capacity, leaf area index (LAI) and the Manning's coefficient for different orders of rivers are assigned.
Based on the slope, soil and land use maps, a map with potential runoff coefficients and depression storage capacities is created. The impervious percentage for urban cells is hereby set equal to 70% (Bahremand et al., 2007). Then, the flow routing parameters are calculated, including flow velocity, mean flow travel time and its standard deviation from each cell to the basin outlet and to the sub-basin outlet. The grids for precipitation and potential evapotranspiration are created based on the geographical coordinates of each measuring station and the catchment boundary using the Thiessen polygon extension of the ArcView Spatial Analyst.
Results and discussion
Image classification and land use change detection
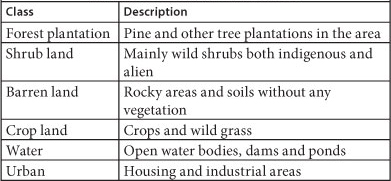
In this study, Landsat data for 4 dates were classified according to land use classes using a maximum likelihood supervised classification methodology. First, training sites, which represent homogeneous examples of prior known land cover types, were located in the images using the training data from a colour composite, normalised difference vegetation index (NDVI), land use maps of 1977 and 1997, the SPOT image and the aerial photos. The spectral characteristics of these training sites are used in the form of multivariate statistical parameters to define the classification signatures. Six classes were defined: water, urban, forest, crop land, shrub land, and barren land. Table 2 gives a description of the different classes. The classification signature files were subsequently used in the maximum likelihood classifier to automatically classify every pixel in the entire image according to land use class, for which it showed the highest likelihood of being a member. The classified images were further smoothed with a majority filter with a 3 x 3 kernel to reduce the number of misclassified pixels (RSI, 2003).
TABLE 2
Description of land use classes of the study area as used in the image classification
The land use maps for 1984, 1992, 2002, and 2008 for the upper G10A catchment are presented in Fig. 4. From the six land use classes, only forest plantation, shrub land, barren land and crop land occur in the study area.
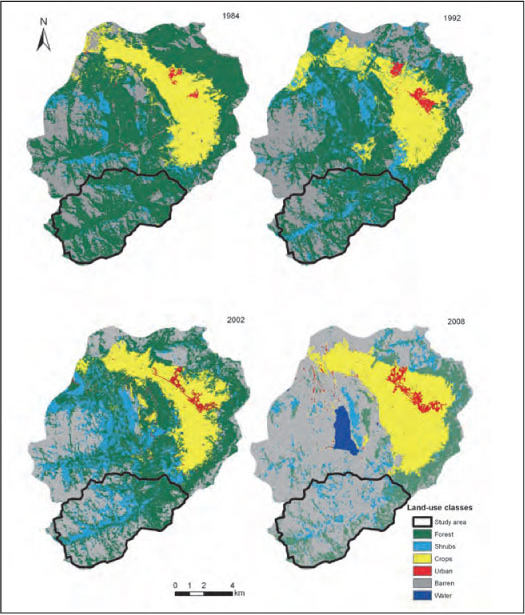
Figure 4
LANDSAT imagery classified land use maps of the catchment for 1984, 1992,2002 and 2008. The black line indicates the study area.
The area and the change in coverage of these four land use classes during the four intervals are presented in Fig. 5. It shows that barren land and crop land area increased while forest and shrub land declined continuously from 1984 till 2008. To further evaluate real losses and gains of the different land use classes, matrices of land use changes from 1984 to 1992, 1992 to 2002, 2002 to 2008, and 1984 to 2008 were established (Table 3).
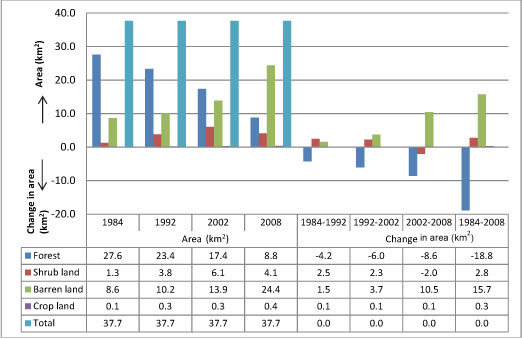
Figure 5
Results of land use classification for 1984, 1992,2002, and 2008; the bar graph shows the area (km2) and change in area (km2) for each class of the study area.
Forest plantation lost 72% (18.82 km2) of its 1984 area (27.62 km2) to other classes during the study period from 1984 to 2008 (Fig. 5). 78% (14.69 km2) changed into barren land, 1% into crop land (0.28 km2) and 21% (3.85 km2) into shrub land (Table 3a-c). The loss of forest area was mainly caused by deforestation as a part of a policy to implement the ecological Reserve as required by the National Water Act (No. 36 of 1998;
RSA, 1998). The ecological Reserve refers to the quantity and quality of water required to protect the aquatic ecosystems of the water resource. The policy aims to replace the pine forest with native vegetation to decrease the evapo-transpiration and increase the recharge (DWAF, 2007). The logging started in 2007 but was not followed by planting of new vegetation; hence this has led to an increase in barren land. Table 3d shows that 8.80 km2 of forest plantations of 1984 remains forest till 2008.
Shrub land lost 81.4% (1.05 km2) of its 1984 area (1.29 km2) and turned into barren land during the study period (Table 3). 317% (4.09 km2) of shrub land class was gained from forest plantation class (Table 3a-c), resulting in a net 2.8 km2 increase in shrub land area (Fig. 5) and 0.24 km2 shrub land of 1984 remained unchanged till 2008.
Figure 5 shows that barren land had an area of 8.63 km2 in 1984, 10.17 km2 in 1992, 13.9 km2 in 2002, and 24.37 km2 in 2008, representing a net increase of 282% (15.74 km2) during the study period. Crop land gained 0.28 km2 which represents a total increase for the period of 19842008 of 245%; this increase is at the cost of forest.
Groundwater recharge determination
Calibration of the WetSpa model resulted in reasonable results for the total discharge and good results for the low flows; details are described in Albhaisi (2012). The WetSpa model was applied for the four different land use maps to predict the impact of land use change on water balance of the catchment. The available 26 years of continuous daily meteorological data, from 1984 until 2009, were split into 4 periods - one for each land use map: (i) 1984-1990 for the land use map of 1984; (ii) 1991-1997 for the land use map of 1992; (iii) 1998-2004 for the land use map of 2002; and (iv) 2005-2009 for the land use map of 2008. Groundwater recharge was summarised for each period as an 'average' map. Discussion of the different groundwater recharge maps corresponding to the different land use conditions is presented in the following paragraphs.
Land use map of the year 1984
A map of average predicted groundwater recharge for 7 years (1984-1990) is presented in Fig. 6a. The predicted yearly recharge in this period varies from 118 to 396 mm-yr1, with a mean of 241.6 mm-yr-1 and standard deviation of 56.5 mm-yr-1. Since the mean precipitation for this period is 861.4 mm-yr-1, the predicted recharge amounts to 30.7% of the precipitation. The areas of forest plantation (72% of the total area of the catchment) have values of groundwater recharge varying from 118 to 159 mm-yr-1. The area of bare land (24% of the total area of the catchment) has predicted values of groundwater recharge varying from 239 to 317 mm-yr-1. Shrub land and cropland areas comprise 4% of the total catchment area; their predicted groundwater recharge varies from 160 to 238 mm-yr-1. The area corresponding to the drainage network has the highest values of groundwater recharge, 318 to 396 mm-yr-1.

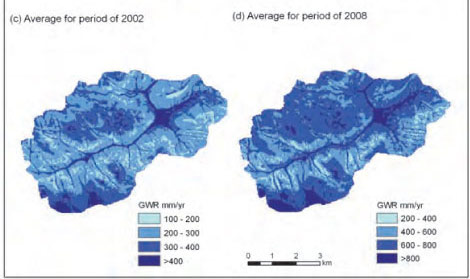
Figure 6
Average of groundwater recharge in mm/yr in the study area of the land use scenarios (a) 1984, (b) 1992, (c) 2002 and (d) 2008; notice the change in scale for the classes in 2008.
Land use map of the year 1992
By the year 1992 the area of forest plantation has decreased by 12% hence barren land and shrub land has increased by 4% and 6.5% respectively, and cropland area has increased by 1%.
Figure 6b shows the average predicted groundwater recharge for the period 1991-1997. The yearly recharge predictions vary from 130 to 504 mm-yr-1 with a mean value of 294 mm-yr-1 and standard deviation of 70 mm-yr-1. Because the mean precipitation for this period is 908.6 mm-yr-1, the predicted recharge amounts to 30.8% of the precipitation. Forest plantation area has low recharge from 130 to 202 mm-yr-1. Bare land groundwater recharge varies from 304 to 403 mm-yr-1. Cropland and shrub land have moderate values varying from 203 to 303 mm-yr-1. The highest values of groundwater recharge appear again in the drainage network areas, with values varying from 404 to 504 mm-yr-1.
Land use map of the year 2002
The area of forest plantation has decreased with 16% between 1992 and 2002 hence barren land and shrub land has increased by 10% and 5.5%, respectively, and cropland area has increased by 0.5%.
Figure 6c shows the predicted average groundwater recharge for the period 1998-2004. The yearly recharge varies between 109 and 421 mm-yr-1 with a mean of 243 mm-yr-1 and standard deviation of 55 mm-yr-1. Since the mean precipitation for this period is 883.8 mm-yr-1, the recharge amounts 25.8% of the precipitation. Forest plantation area has low values, which vary from 109 to 168 mm-yr-1. Bare land has high groundwater recharge varying between 254 to 337 mm-yr-1. Cropland and shrub land have moderate values varying from 169 to 253 mm-yr-1. The highest values of groundwater recharge appear again in the drainage network areas with yearly values between 338 and 421 mm-yr-1.
Although the vegetated area has decreased in 2002 compared to 1992, the decrease in groundwater recharge from 2002 to 1992 can be explained by the decrease of precipitation for the period of the land use scenario of 2002.
Land use map of the year 2008
Rapidly decreasing forest plantation area appears clearly in 2008, with a total loss of 51.5% of forest areas since 1984. On the other hand, during the same period, the area of bare land increased to 65% of the catchment area in 2008. Since 2002, shrub land and cropland decreased by 6% and 0.5%, respectively. Figure 3 shows an increasing precipitation in the period 2007-2009; therefore, the predicted groundwater recharge increases considerably compared with the previous periods and corresponding three land use scenarios.
Figure 6d shows the average yearly groundwater recharge for the period 2005-2009. The yearly recharge varies from 266 to 1 060 mm-yr-1, with mean value of 671 mm-yr-1 and standard deviation of 125 mm-yr-1. Since the mean precipitation for this period is 1 613.7 mm-yr-1, the predicted recharge amounts to 38.3% of the precipitation. Forest plantation areas have low values of predicted groundwater recharge, varying from 266 to 424 mm-yr-1. Barren lands have high values varying from 637 to 848 mm-yr-1. Cropland and shrub land have moderate values varying from 425 to 636 mm-yr-1. The highest values of groundwater recharge appear in the drainage network areas with values varying from 849 to 1 060 mm-yr-1.
What can be noticed from Fig. 6d is that there is a rapid increase in the predicted groundwater recharge for the land use map of 2008, which can be explained by the increase of bare land to 65% of the total area of the catchment, which means more high-potential recharge areas. On the other hand, the period 2007-2009 appears to contain very wet years, as shown by the precipitation time-series of the meteorological stations in the catchment (Fig. 3). The average amount of precipitation in the catchment from 1984 until 2004 is around 890 mm-yr-1; for the period 2005-2009 (time-series of the land use map of 2008) the average precipitation in the catchment is 1 613.7 mm-yr-1, and this can explain the rapid increase of the groundwater recharge in combination with the rapid increase of bare land area in the catchment.
Effect of land use change on groundwater recharge
Figure 7 shows the contribution of the different land use classes for the different land use maps to groundwater storage. The results of groundwater recharge determination for the upper G10A clearly shows the effect of land use change on groundwater storage (Fig. 7). The WetSpa model calculations of the mean annual groundwater recharge of the catchment for the land use maps of the years 1984, 1992, 2002 and 2008 are 241, 294, 243 and 671 mm-yr-1, respectively.
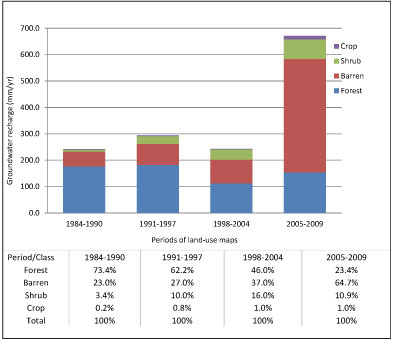
Figure 7
Groundwater recharge in mm/yr and percentage of the contribution of different land use classes for different years of the land use maps.
The contribution of the forest class in groundwater recharge decreased from 73.4% in 1984 to 23.4% by the end of 2009, as a result of deforestation. Bare class contribution increases rapidly from 23% in 1984 to 64.7% in 2008. The relative contributions of shrub land and cropland classes increase at small rates; with values of 3.4% and 0.2% in 1984 and 10.9% and 1% in 2008 for shrub land and cropland, respectively.
Beside the areal coverage and type of land use classes in the catchment, the distribution and location of these classes can affect the groundwater recharge quantity; this is the case for the land use map for the year 2002. Despite the increase in barren land area and decrease in forest area, the values of groundwater recharge have decreased compared with the year 1992. The decrease in groundwater recharge could be a result of the distribution of the shrub lands in the areas of high recharge values; these areas are the low altitude areas close to the Berg River and the areas close to the drainage network in the catchment.
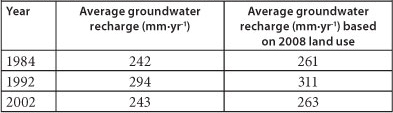
As the precipitation in the period 2005-2009 is very high compared to the previous periods it is important to evaluate if the changed land use of 2008 still has an important contribution to the simulated increased recharge. Therefore, we tested if the cutting of non-native hill slope vegetation upstream of the Berg River Dam contributes significantly to the predicted increase in groundwater recharge. Hence, we simulated the whole time series from 1984-2004 (21 years) with the land use map from 2008 instead of with the land use maps for 1984, 1992 and 2002. Table 4 shows that there is a systematic increase of about 8% per year for the 21-year period, due to the change in land use from the different years to that of 2008, which confirms that the major land use change of 2008 clearly contributes to the increase in recharge.
TABLE 4
Comparison between the average groundwater recharge in the different land use maps with the land use map of 2008
Conclusions
This study predicts the impact of land use change on groundwater recharge in the upper G10A catchment. The WetSpa model was applied for 4 periods each with a different land use map, resulting in mean annual groundwater recharge for the different land use conditions.
The results show considerable spatial recharge differences within the same land use map and within the same land use class. High precipitation in the very wet period of 2005-2009 leads to a very high increase (278%) in mean predicted ground-water recharge, from 242 mm-yr1 in 1984 to 671 mm-yr1 in 2008. Contradictory simulation results occur for the year 2002. Although the area of the barren lands increased compared with the year 1992, the groundwater recharge decreased from 294 mm-yr1 in 1992 to 243.2 mm-yr1 in 2002; this is a result of a combination of a slightly lower precipitation and a considerable increase in shrub land in the area.
The South African Department of Water Affairs and Forestry (DWAF) started to cut down non-native hill slope vegetation upstream of the dam at the end of 2007. It is hypothesised that evapotranspiration will decline and recharge will increase due to this change in land use. A simulation test using the land use map of 2008, instead of the maps for 1984, 1992 and 2002 for the whole 21-year time series from 1984-2004 were done; A systematic increase of about 8% per year for the 21-year period, due to the change in land use from the different years to that of 2008 is predicted, which confirms that the clearing of the non-native hill slope vegetation is of considerable importance for the increase in groundwater recharge. The results- of this study confirm the assumptions underlying the DWAF policy of clearing non-native hill slope vegetation in the Berg River Catchment.
This study should be repeated in other catchments to compare the methodology for other topography, land use, and hydrometeorological conditions, in detecting the effect of land use change on the groundwater recharge. Moreover, extension of this study could take into account the impact of climate change in combination with land use change.
Acknowledgments
This project was supported by the VLIR-UOS IUC project 'Sustainable utilisation of subterranean water resources for improvement of quality of life' (VLIR IUC University of the Western Cape, South Africa) and by the FWO grants G.0443.05 'Impact of hydrology on diversity of aquatic organisms in temporary wetlands in the Cape Region (South Africa)'.
References
ALBHAISI M (2012) Methodology for estimation of the change in the reserve of the upper Berg catchment, Western Cape, South Africa. PhD thesis, Department of Hydrology and Hydraulic Engineering, Vrije Universiteit Brussel, Belgium. [ Links ]
BAHREMAND A, DE SMEDT F, CORLUY J and LIU YB (2007) WetSpa model application for assessing reforestation impacts on floods in Margecany-Hornad Watershed, Slovakia. Water Resour. Manage. 21 1373-1391. [ Links ]
BATELAAN O and DE SMEDT F (2007) GIS-based recharge estimation by coupling surface-subsurface water balances. J. Hydrol. 337 (3-4) 337-355. [ Links ]
BATELAAN O, DE SMEDT F and TRIEST L (2003) Regional ground-water discharge: phreatophyte mapping, groundwater modelling and impact analysis of land-use change. J. Hydrol. 275 (1-2) 86-108. [ Links ]
BERNARD AC, WILKINSON GG and KANELLOPOULOS I (1997) Training strategies for neural network soft classification of remotely sensed imagery. Int. J. Remote Sens. 18 1851-1856. [ Links ]
BHADURI B, HARBOR J, ENGEL BA and GROVE M (2000) Assessing watershed-scale, long-term hydrologic impacts of land use change using a GIS-NPS model. Environ. Manage. 26 (6) 643-658. [ Links ]
BOSCH JM and HEWLETT JD (1982) A review of catchment experiments to determine the effect of vegetation changes on water yield and evapotranspiration. J. Hydrol. 55 (1-4) 3-23. [ Links ]
BRONSTERT A (2004) Rainfall-runoff modeling for assessing impacts of climate and land-use change. Hydrol. Process 18 567-570. [ Links ]
BROOKS RH and COREY AT (1966) Properties of porous media affecting fluid flow. J. Irrig. Drain. Am. Soc. Civ. Eng. IR2 61-88. [ Links ]
BROWN AE, ZHANG L, McMAHON TA, WESTERN AW and VERTESSY RA (2005) A review of paired catchment studies for determining changes in water yield resulting from alterations in vegetation. J. Hydrol. 310 28-61. [ Links ]
CALDER IR (1993) Hydrologic effects of land-use change. In: Maidment DR (ed.) Handbook of Hydrology. McGraw-Hill, New York. 13.1-13.50. [ Links ]
CHILAR J (2000) Land cover mapping of large areas from satellites: status and research priorities. Int. J. Remote Sens. 21 (67) 1093-1114. [ Links ]
COPPIN P, JONCKHEERE I, NACKAERTS K, MUYS B and LAMBIN E (2004) Digital change detection methods in ecosystem monitoring: a review. Int. J. Remote Sens. 25 1565-1596. [ Links ]
DAMS J, WOLDEAMLAK ST and BATELAAN O (2008) Predicting land-use change and its impact on the groundwater system of the Kleine Nete catchment, Belgium. Hydrol. Earth Sys. Sci. 12 1369-1385. [ Links ]
DONG Y, FORSTER B and TICEHURST C (1997) Radar backscat-ter analysis for urban environments. Int. J. Remote Sens. 18 (6) 1351-1364. [ Links ]
DWAF (DEPARTMENT OF WATER AFFAIRS AND FORESTRY, SOUTH AFRICA) (2006) The construction of a hydrologically-correct, annotated 1:500 000 spatial dataset of the rivers of South Africa and contiguous basins. Report no. N/0000/00/REH/0701. DWAF: Resource Quality Services. Pretoria, South Africa. [ Links ]
DWAF (DEPARTMENT OF WATER AFFAIRS AND FORESTRY, SOUTH AFRICA) (2007) Berg River Baseline Monitoring Programme. Final report - Volume1: Introduction to the Berg River Catchment; Groundwater and Hydrology. Ractliffe G (ed.) DWAF Report No. P WMA 19/G10/00.1707. DWAF, Pretoria. [ Links ]
EAGLESON PS (1978) Climate, soil, and vegetation, a simplified model of soil moisture movement in liquid phase. Water Resour. Res. 14 (5) 722-730. [ Links ]
GAUTAM AP, WEBB EL, SHIVAKOTI GP and ZOEBISCH MA (2003) Land use dynamics and landscape change pattern in a mountain watershed in Nepal. Agric. Ecosyst. Environ. 99 83-96. [ Links ]
GIRI C, ZHU Z and REED B (2005) A comparative analysis of the Global Land Cover 2000 and MODIS land cover data sets. Remote Sens. Environ. 94 123-132. [ Links ]
HOPE A, BURVALL A, GERMISHUYSE T and NEWBY T (2009) River flow response to changes in vegetation cover in a South African fynbos catchment. Water SA 35 (1) 55-60. [ Links ]
HORNBECK JW, ADAMS MB, CORBETT ES, VERRY ES and LYNCH JA (1993) Long-term impacts of forest treatments on water yield: a summary for northeastern USA. J. Hydrol. 150 (2-4) 323-344. [ Links ]
JENSEN JR (2005) Introductory Digital Image Processing: A Remote Sensing Perspective (3rd edn.). Prentice-Hall, Englewood Cliffs. [ Links ]
KACHHWALA TS (1985) Temporal monitoring of forest land for change detection and forest cover mapping through satellite remote sensing. Proc. 6th Asian Conf. on Remote Sensing, 21-26 November 1985, Hyderabad. 77-83. [ Links ]
KLOCKING B and HABERLANDT U (2002) Impact of land use changes on water dynamics - a case study in temperate meso and macroscale river basins. Phys. Chem. Earth 27 619-629. [ Links ]
LIN YP, HONG NM and WU PJ (2007) Modeling and assessing land-use and hydrological processes to future land-use and climate change scenarios in watershed land-use planning. Environ. Geol. 52 (3) 623-634. [ Links ]
LINSLEY RKJ, KOHLER MA and PAULHUS JLH (1982) Hydrology for Engineers (3rd edn.). McGraw-Hill, New York. 237 pp. [ Links ]
LIU YB (2004) Development and Application of a GIS-based Hydro- logical Model for Flood Prediction. PhD theseis, Vrije Universiteit Brussel, Brussel, Belgium. 315 pp. [ Links ]
LIU YB and DE SMEDT F (2005) Flood modeling for complex terrain using GIS and remote sensed information. Water Resour. Manage. 19 605-624. [ Links ]
LIU YB, DE SMEDT F and PFISTER L (2002) Flood prediction with the WetSpa model on catchment scale. In: Wu BS, Wang ZY, Wang GQ, Huang GH, Fang HW and Huang JC (eds.) Flood Defence '2002. Science Press, New York. 499-507. [ Links ]
LIU YB, GEBREMESKEL S and DE SMEDT F (2003) A diffusive transport approach for flow routing in GIS-based flood modeling. J. Hydrol. 283 91-106. [ Links ]
MCCOLL C and AGGETT G (2007) Land-use forecasting and hydrologic model integration for improved land-use decision support. J. Environ.Manage. 84 494-512. [ Links ]
MIDGLEY DC, PITMAN WV and MIDDLETON BJ (1994) The Surface Water Resources of South Africa, 1990. Volumes 1 to 6. WRC Report No. 298/1/94.Water Research Commission, Pretoria. [ Links ]
NIEHOFF D, FRITSCH U and BRONSTERT A (2002) Land-use impacts on storm-runoff generation: scenarios of land-use change and simulation of hydrological response in a meso-scale catchment in SW-Germany. J. Hydrol. 267 80-93. [ Links ]
OTT B and UHLENBROOK S (2004) Quantifying the impact of land-use changes at the event and seasonal time scale a process-oriented catchment model. Hydrol. Earth Syst. Sci. 8 62-78. [ Links ]
RSA (REPUBLIC OF SOUTH AFRICA) (1998) National Water Act. Act No. 36 of 1998. Government Gazette no. 19182. [ Links ]
RIDD MK and LIU J (1998) A comparison of four algorithms for change detection in an urban environment. Remote Sens. Environ. 63 95-100. [ Links ]
RINGROSE S, JELLEMA A, HUNSTMAN-MAPILA P, BAKER L and BRUBAKER P (2005) Use of remotely sensed data in the analysis of soil-vegetation changes along a drying gradient peripheral to the Okavango Delta, Botswana. Int. J. Remote Sens. 26 (19) 4293-4319. [ Links ]
ROBINSON M, COGNARD-PLANCQ AL, COSANDEY C, DAVID J, DURAND P, FUHRER HW, HALL R, HENDRIQUES MO, MARC V, MCCARTHY R, MCDONNELL M, MARTIN C, NISBET T, O'DEA TP, RODGERS M and ZOLLNER A (2003) Studies of the impact of forests on peak flows and base flows: A European perspective. For. Ecol. 186 85-97. [ Links ]
ROGAN J and CHEN DM (2004) Remote sensing technology for mapping and monitoring land-cover and land-use change. Prog. Plann. 61 301-325. [ Links ]
SHAFII M and DE SMEDT F (2009) Multi-objective calibration of a distributed hydrological model (WetSpa) using a genetic algorithm. Hydrol. Earth Sys. Sci. 13 2137-2149. [ Links ]
SINGH A (1989) Digital change detection techniques using remotely sensed data. Int. J. Remote Sens. 10 989-1003. [ Links ]
STAR JL, ESTES JE and MCGWIRE KC (1997) Integration of Geographic Information Systems and Remote Sensing. Cambridge University Press, New York. [ Links ]
TANG Z, ENGEL BA, PIJANOWSKI BC and LIM KJ (2005) Forecasting land use change and its environmental impact at a watershed scale. J. Environ. Manage. 76 35-45. [ Links ]
THOMPSON M (1996) A standard land-cover classification for remote-sensing applications in South Africa. S. Afr. J. Sci. 92 34-42. [ Links ]
THORNTHWAITE CW and MATHER JR (1995) The water balance. In: Laboratory of Climatology Publ. No 8. Laboratory of Climatology, Centerton, NJ. [ Links ]
VÁZQUEZ-SUNÉ E, SANCHEZ-VILA X and CARRERA J (2005) Introductory review of specific factors influencing urban ground-water, an emerging branch of hydrogeology, with reference to Barcelona, Spain. J. Hydrol. 13 (3) 522-533. [ Links ]
VERBURG PH, VELDKAMP T, OVERMARS K, LESSCHEN JP and KOK K (2004) Manual for the CLUE-S model. Wageningen University, The Netherlands. URL: http://www.cluemodel.nl. 47 pp. [ Links ]
VERBURG PH, MASTURA SSA, SOEPBOER W, VELDKAMP A, LIMPIADA R and ESPALDON V (1999) Modelling the spatial dynamics of regional land use: the CLUE-S Model. J. Environ. Manage. 30 (3) 391-405. [ Links ]
WANG Z, BATELAAN O and DE SMEDT F (1996) A distributed model for Water and Energy Transfer between Soil, Plants and Atmosphere. Phys. Chem. Earth 21 189-193. [ Links ]
WITTENBERG H and SIVAPALAN M (1999) Watershed groundwater balance estimation using streamflow recession analysis and base-flow separation. J. Hydrol. 219 20-33. [ Links ]
YUAN F, ELVIDGE CD and LUNETTA RS (1998) Survey of multi-spectral methods for land cover change analysis. In: Lunetta RS and Elvidge CD (eds.) Remote Sensing Change Detection: Environmental Monitoring Methods and Applications. Taylor & Francis, London. 21-39. [ Links ]
YUAN, F SAWAYA KE, LOEFFELHOLZ BC and BAUER ME (2005) Land cover classification and change analysis of the Twin Cities (Minnesota) metropolitan area by multitemporal Landsat remote sensing. Remote Sens. Environ. 98 317-328. [ Links ]
Received 13 April 2012
Accepted in revised form 25 March 2013.
* To whom all correspondence should be addressed. +61 8 82012288; E-mail: okke.batelaan@flinders.edu.au

