


Services on Demand
Article
 English (pdf)
 Article in xml format
 Article references
Indicators

Related links
-
 Cited by Google
 -
 Similars in Google
Share

 Permalink
Water SA
On-line version ISSN 1816-7950
Print version ISSN 0378-4738
Water SA vol.39 n.2 Pretoria Jan. 2013
Salinity of irrigation water in the Philippi farming area of the Cape Flats, Cape Town, South Africa
CD Ruben Aza-GnandjiI, II; Yongxin XuI, *; Lincoln RaittIII; Jonathan LevyIV
IDepartment of Earth Sciences, University of the Western Cape, South Africa
IIDepartment of Civil Engineering, University of Abomey-Calavi, Benin
IIIDepartment of BCB, University of the Western Cape, South Africa
IVDepartment of Geology, Miami University, Oxford, OH 45056, USA
ABSTRACT
This paper explores the nature, source and spatial variation of the salinity of water used for irrigation in a coastal urban farming area in Cape Town, South Africa, where water from the Cape Flats aquifer is drawn into storage ponds and used for crop irrigation. Water samples were collected in summer and winter from selected sites across the study area and were analysed for salinity as well as for concentrations of major and minor ions. Each site consists of one borehole and one pond. Isotope analysis was done for the summer samples so as to assess effects of evaporation on water quality and salinity. Descriptive statistics were used to compare the variation in range of concentration of specific ions with the recommended ranges set by the South African Department of Water Affairs and Forestry (DWAF) and the Food and Agriculture Organisation (FAO). Geographical information system (GIS) analysis was used to describe the spatial distribution of salinity across the study area, and hydro-geochemical analysis was used to assess the possibility of seawater intrusion into the aquifer system and to characterise groundwater in the study area. The results of the research showed that the concentrations of chloride, nitrate, potassium and sodium exceeded the target maximum limit according to DWAF and FAO guidelines. Groundwater and pond water were also observed to be brackish in most parts of the research area in terms of total dissolved salts content, and fresh water was only found in the middle section of the research area. It is concluded that the accumulation of salts in groundwater and soil in the study area is mainly due to the agricultural activities and partially due to the natural movement of water through the geological formation of the Cape Flats region. These findings permit the formulation of a conceptual model of the occurrence of the salinization process, which implies that the groundwater and pond water in the study area are generally suitable for irrigation purposes, but need to be used with caution as the vegetables grown are classified as sensitive and moderately sensitive to salt according to DWAF guidelines for irrigation water quality (1996). The research paves a way for possible quantitative simulation of salt mass balance in future.
Keywords: South Africa, Philippi farming area, salinity, groundwater, irrigation water, hydrochemical analysis, isotopic analyses, evaporation, suitability
Introduction
Water salinity forms a major concern for both water supply and irrigation globally. High salinity levels tend to affect soil structure and crop productivity, mainly through limiting the uptake of water by plants (Khodapanah et al., 2009). Salt contamination can result in adverse and permanent environmental impacts to soil and groundwater resources (Todd and Mays, 2005). There might be many causes of the occurrence and accumulation of salt in the environment. Therefore an understanding of the origin of water salinity is prerequisite for management of irrigation water for both crop productivity and land use. The Philippi farming area in the Cape Flats region of Cape Town, South Africa, as shown in Fig. 1, provides a case study area which is often affected by these salinity issues. It is a vegetable-producing area with its crops being intensively irrigated with groundwater drawn from the Cape Flats aquifer. In the past, several studies were performed in the area but little progress has been made in better understanding the salinity of the water used for agricultural purposes. Therefore, the severity of the spatial and temporal distribution of the salinity problem is virtually unknown in the study area. Moreover, recent surveys have shown that the Cape Flats aquifer represents an important resource that could potentially be exploited as a municipal water supply in order to alleviate water shortages frequently experienced by the municipality of Cape Town (Wright and Conrad, 1995; Adelana et al., 2006; Seward et al., 2009). It is therefore important to monitor water resources in the Cape Flats region, especially in the areas where the aquifer system seems vulnerable to any kind of pollution, in order to maintain the water quality of the Cape Flats aquifer within the recommended standard levels for the various water uses. In this paper, the chemical analysis data for major and minor ions were used to investigate the nature, source and extent of the salinity of the water used for irrigation in the Philippi farming area, and to assess the suitability of the water for irrigation activities. To cater for the effect of evaporation on the water resources in the study area, stable isotope data were used to refine a conceptual model. Based on the conceptual model, plausible origins of the salinity problem encountered in the Philippi farming area are discussed and put forward.
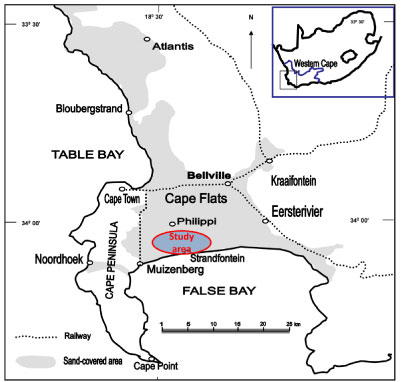
Figure 1
Location of the study area in Cape Flats region, South Africa
Location of the study area and its land use
The Philippi area is situated on the sandy Cape Flats, about 14 km from Cape Town, Western Cape, South Africa (latitudes 34°00'S and 36°00'S, and longitudes 18°31'E and 18°35'E; Fig. 1). It lies within the quaternary catchment area, with a topography typical of coastal plains and dune fields (DWAF, 2007). First settled by German vegetable farmers in the 19th century, the Philippi area is still predominantly used for vegetable farming, although other forms of farming include shrub and flower farming as well as poultry, pig and cattle farming (Meerkotter, 2003). The main vegetable varieties that are grown during both summer and winter seasons include carrots, cabbages, potatoes, lettuce, onions, peppers, beans, cauliflowers, spinaches and broccoli. Although the area receives a significant amou t of rainfall during the winter season, groundwater is often used as the main water source for irrigating the crops. It is pumped and stored into irrigation ponds and later the stored water is re-pumped to irrigate the sub-adjacent cropping areas. These irrigation ponds act as the reservoirs and contain water from boreholes, rainfall and, sometimes, irrigation return flow.
METHODS
Water sampling
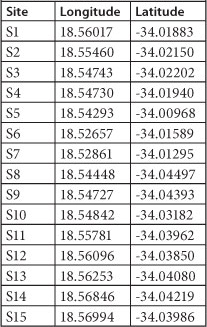
A field survey was conducted to aid with site selection for water sampling purposes. Water samples from boreholes and ponds were collected and analysed on a bi-monthly basis throughout a year cycle in order to assess the seasonal variation of water salinity and quality, to define the hydrochemical nature of the water and to assess its suitability for irrigation use in the study area. Water samples were also analysed for stable environmental isotopes (deuterium and oxygen-18) to investigate the effect of evaporation on borehole and pond water in the study area. Guided by areal distribution and the accessibility granted by the farmers, 15 sites (S1 to S15) were selected as part of the survey, to approximately cover the entire Philippi farming area (Fig. 2). Site geographical location was recorded using a handheld global positioning system (GPS) (Table 1). For each site, a pond water sample was collected, together with its related borehole water sample. Water sampling for the physico-chemical analysis occurred in summer (February and April 2010) and in winter (June and August 2010). Stable environmental isotopes (Deuterium and Oxygen-18) were also analysed in the February 2010 water samples. The water sampling procedure suggested by Weaver et al. (2007) was followed for collecting the samples for Sites S1 to S15. The bottles for isotope analysis were fully filled and their caps were tightly fitted in order to remove entrapped air as much as possible. Borehole water samples were collected at the outlet of the pipe connected to the borehole. To ensure that the samples taken truly represented the water from the bulk aquifer, the electrical conductivity (EC) and temperature were monitored and samples were taken only after EC and temperature stabilised, using the TLC meter well calibrated with the 1 431 µΒ/cm calibration fluid for each field trip. Pond water samples were directly collected from the ponds using a bailer to bring up the water. The bailer was rinsed 2 to 3 times with distilled water after each sample taken.
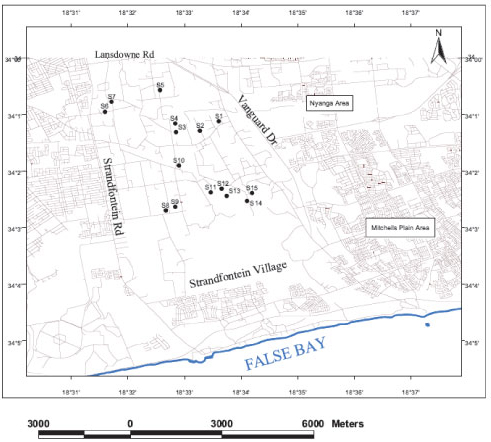
Figure 2
Location of the sampling points
TABLE 1
Geographical coordinates of the sampling points
Results and discussion
Quality control of the chemical analysis of the water
As the water is electrically neutral, a charge balance should be conducted to check the accuracy of the analysis (Cogho et al., 1989). In such an analysis, the sum in milli-equivalents per litre of positively-charged species has to match the sum of negatively-charged species in the given water sample (Younger, 2007). A balance check was made against the analytical results performed by a commercial laboratory by calculating the cation-anion balance (CAB) of each water sample result. Weaver et al. (2007) and Younger (2007) recommend that the CAB should be less than 10% before being sufficiently reliable to justify using the results for further interpretations. For this study, most of the cation-anion balance (CAB) values of the water samples collected were less than 10%. The few values from water sample analysis with a CAB value of greater than 10% were discarded accordingly.
Descriptive statistics
Statistical analysis for the interpretation of large data sets was used to give an overview of the maximum, minimum, and arithmetic mean of the chemical composition of the borehole and pond water collected. The arithmetic mean and ranges of constituent concentrations were compared with the target ranges set by South African irrigation guidelines (DWAF, 1996). An overview of the descriptive statistics for the borehole and pond water for the entire sampling period, along with the recommended ranges set by DWAF (the former Department of Water Affairs and Forestry, South Africa, now the Department of Water Affairs) and FAO (Ayers and Westcot, 1985), is presented in Table 2 (next page).
As can be seen in Table 2, the sampling could not be carried out through the entire hydrological year; a selection was made with February representing dry weather, April and June early wet weather and August typical peak wet weather in the winter rainfall climate of the study area.
Variations of some physico-chemical parameters of groundwater and pond water
Variations in water quality experienced during the survey are discussed below in relation to irrigation water quality guidelines.
Borehole water had pH values ranging between 6.6 and 7.8, indicating the circum-neutral nature of the water (Younger, 2007), and thus meeting the target range for South African irrigation water (pH 6.5-8.4). Most of the pH values of pond water also met this target range. However, several pond water samples had pH values above 8.4, indicating an alkaline nature. The electrical conductivity values ranged between 85 mS/m and 284 mS/m for borehole water and between 99 mS/m and 284 mS/m for pond water, during the sampling period. These values did not meet the target range for South African irrigation water of 0-40 mS/m. Sample temperature in summer varied from 18.2-19.5°C and 18.7-25.6°C for groundwater and pond water, respectively, whereas in winter the temperature ranged from 16.4-18.4°C and 14.0-16.1°C for groundwater and pond water, respectively. Since pond water is an open water body, its temperature is influenced more by the temperature variations induced by the ambient weather than is the case for the temperature of groundwater (Todd and Mays, 2005).
The South African guidelines for irrigation water quality (DWAF, 1996) state that TDS (mg/ℓ) is equal to EC (mS/m) multiplied by a factor of 6.5. Using this relationship, the total dissolved salts (TDS) values were estimated for the collected water samples. Most of the TDS concentration values of both borehole and pond water were greater than 1 000 mg/ℓ and all arithmetic mean values of the TDS concentrations fell in the range 1 000-10 000 mg/ℓ (Table 2). This indicates that in the study area both groundwater and pond water were mostly brackish, according to the water classification by Freeze and Cherry (1979) based on TDS concentration. However, a few places in the study area reported fresh groundwater and pond water with TDS values less than 1 000 mg/ℓ. The maximum concentration values of magnesium, calcium, bicarbonate and sulphate, expressed in milli-equivalents per litre (meq/ℓ), for both borehole and pond water did not exceed the recommended values set by FAO guidelines which are 5 meq/ℓ, 20 meq/ℓ, 10 meq/ℓ and 20 meq/ℓ, respectively (Ayers and Westcot, 1985). Potassium concentrations (in mg/£) were largely outside of the guideline range - for irrigation water of 0-2 mg/£ (Ayers and Westcot, 1985). It was also observed that most of the sodium concentration values for both borehole and pond water were above the target value set by DWAF guidelines for irrigation water (70 mg/ℓ). In low quantities, sodium is beneficial to the growth of some plants. However, at higher concentrations, it is toxic to many plants, especially woody plants (DWAF, 1996). Chloride is an essential plant micronutrient, however it is relatively toxic to most crops at higher concentrations (DWAF, 1996). Most borehole samples had chloride concentrations above the target value of 100 mg/ℓ according to DWAF guidelines for irrigation water. Chloride concentration exceeded the target value for all of the pond samples. Boron is necessary in very small quantities for normal growth of all plants but becomes toxic in larger concentrations (DWAF, 1996; Todd and Mays, 2005). Across the whole survey area, the maximum boron concentrations for both borehole and pond water samples did not exceed the irrigation water target value 0.5 mg/ℓ set by the DWAF guidelines (1996). Nitrate is an essential plant macronutrient (DWAF, 1996). However, in excess it becomes a major concern in irrigation water, because of its stimulatory effect on plant growth and its potential to leach and contaminate groundwater resources (DWAF, 1996). Nitrates (as NO3-) were found in groundwater across the study area, with arithmetic mean concentration values less than the target value recommended by the DWAF guidelines (5 mg/ℓ). However, the arithmetic-mean concentration of nitrate for pond water was above this recommended value throughout the year. The high levels of nitrate observed in the pond water could be related to the fertilisers applied over the cultivated area, which is directed to the ponds through the drainage system by return flows. Manganese is required as an enzyme activator in plants. The maximum value of manganese concentration set by DWAF guidelines (1996) for irrigation water is 0.02 mg/ℓ. In most parts of the study area, manganese concentrations in both borehole and pond water exceeded this target value. Most of the borehole samples had iron concentrations below the target value set by DWAF for irrigation water (5 mg/ℓ), except in summer, when samples from Borehole BH9 on Site S9 had iron concentrations greater than 5 mg/ℓ. The iron concentrations for the pond water all fell into the 0-5 mg/ℓ DWAF target range. The high iron levels observed in groundwater could be related to the piping equipment used to pump out water from the boreholes, as this is sometimes subject to corrosion.
Hydrogeochemical interpretation
To overcome the difficulties of comparing results for large number of samples, graphic representations are useful for emphasizing similarities and differences (Todd and Mays, 2005). Amongst others, the Piper diagram was used for this survey to assess the interactions between the various components that affect the quality of the water, in order to draw out similarities and to characterise the water types encountered in the study area. Patterns of cation and anion concentrations of the groundwater and pond water were represented on Piper diagrams (Figs. 3 and 4). As the study area is a coastal area, the seawater represents an end member for the survey. Its constituent composition is also plotted on the Piper diagrams.
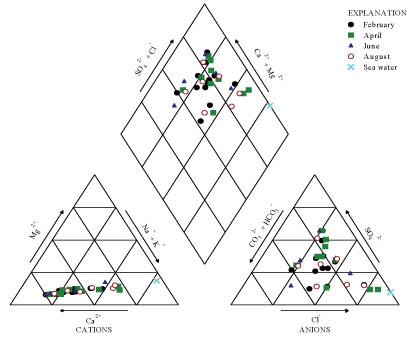
Figure 3
Plot of BH water samples and sea water on Piper diagram
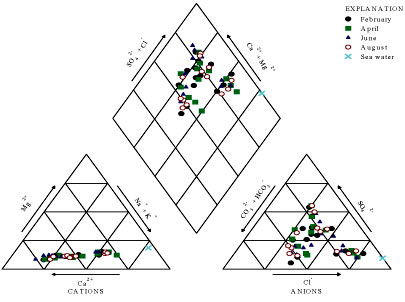
Figure 4
Plot of pond water samples and sea water on Piper diagram
From the Piper diagrams, the following observations may be made:
• The water sampled from both the collected borehole and pond is of mixed origin, as the values for the water fell in the upper part of the diamond field of the Piper diagram.
• Regarding the concept of hydrochemical facies developed to describe cation and anion concentrations based on subdivisions of the Piper diagram (Freeze and Cherry, 1979), groundwater in the study area is characterised either by Ca-Cl, Ca-HCO3, Ca-SO4 and Na-Cl chemical types.
• The plots of borehole data did not fall close to the seawater plot, suggesting that there is no intrusion of seawater into the sediments of the study area.
Suitability for irrigation use
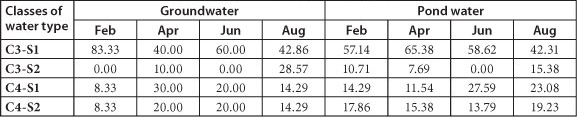
The standard United States (US) salinity diagram developed by Richards (1954) was used to assess the suitability of water for irrigation purposes. In the US salinity diagram, the electrical conductivity (EC) is taken as the salinity hazard and the sodium adsorption ratio (SAR) as the alkalinity hazard (Richards, 1954). The measured values of EC in the study area ranged between 85 mS/m and 284 mS/m and the estimated adjusted SAR values varied from 1.06 to 7.75. The plot of these data on the US salinity diagram shows that the water samples are mostly found confined to 4 water type classes (Figs. 5 and 6). A summary of the percentages of the various water type classes encountered during the survey period is presented in Table 3.
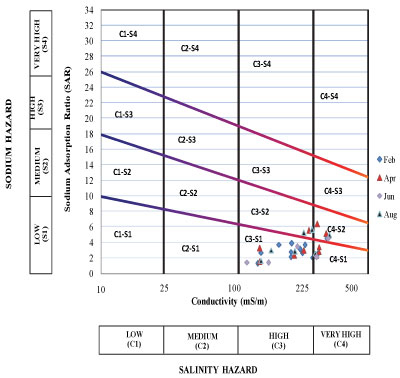
Figure 5
Salinity diagram classification of irrigation water based on Richards, 1954 (BH water during the sampling period)
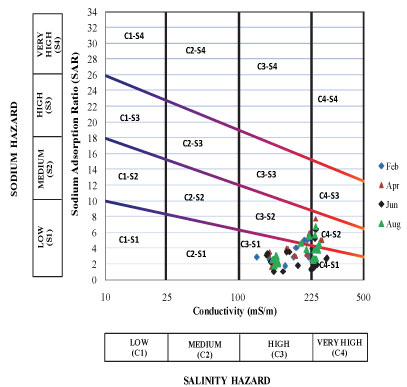
Figure 6
Salinity diagram classification of irrigation water based on Richards, 1954 (Pond water during the sampling period)
TABLE 3
Percentages of the four water type classes encountered during the sampling period (2010)
The specificities of these classes (Kirchner, 1995) are as follows:
• Water of C3-S1 class should only be used on soils which can be leached easily and salinity control must be practiced at all times.
• Water of C3-S2 class should only be used on those soils which have good drainage and only plants having a good salt tolerance should be grown.
• Water of C4-S1 class is generally considered to be poor quality for irrigation but it may be used if all other conditions are favourable such as adequate drainage and application of additional good quality of water, and only crops of the highest salt tolerance should be grown.
• The very high salinity of water of C4-S2 class permits occasional use and then only under favourable soil and plant conditions. Only plants of high salt tolerance should be grown if water of this quality must be used.
It was observed that most water samples from the study area were confined to the C3-S1 class throughout the sampling period. Since most vegetable crops grown in the study area are classified as sensitive and moderately sensitive to salt (DWAF, 1996), the water in the study area needs to be used carefully, and special management practices have to be applied.
Spatial distribution
Table 4 includes the summary of the mean of TDS values per site in summer and winter for borehole and pond water, respectively. Kriging approach was used to infer the distribution pattern of TDS concentration in the study area, for borehole and pond water, respectively, during the entire sampling period (Figs. 7 and 8).
The following observations were made:
• In summer, groundwater was mostly fresh in the western and central parts of the study area. The high TDS values are observed in the south-eastern part of the study area. The same pattern is also observed in winter but ground-water tended to be more brackish in the north-western part of the study area.
• In summer, most of the pond waters were brackish in nature. Fresh pond water is observed only in the middle section of the study area. Pond water with high salinity levels is found in the north-western, eastern and the south-eastern parts, particularly. The same pattern is also observed in winter time but the pond water at most sites was diluted.
• In the north-western and eastern part of the study area, the salinity levels of the pond water were higher than those of the borehole water. This might be due to the evaporation process and to the irrigation return flow process, as some chemical fertilisers go back to the ponds after being spread over the cultivated area.
• The summer pattern sketches had saltier areas than the winter pattern sketches. This might be due to the effect of the evaporation process.
Environmental isotopes
This research looked at the stable isotopes oxygen-18 (18O) and deuterium (2H, or simply D) of the water samples. As water evaporates, the heavier molecules tend to remain; therefore water which has been subject to much evaporation can be expected to contain higher proportions of 18O and 2H than fresh rainwater (Schwartz and Zhang, 2003). Isotope information made it possible to establish physical processes affecting groundwater and pond water in the study area. Results for stable isotopes oxygen-18 and deuterium in the summer water samples were plotted with reference to the global and local meteoric water lines (GMWL and LMWL), whose relations are δ2H = 8 x δ18O + 10 (Craig, 1961; Schwartz and Zhang, 2003) and δ2H = 6.1 x δ18O + 8.6 (Diamond and Harry, 1997) respectively (Table 5 and Fig. 9).
TABLE 5
Results of stable isotope analysis
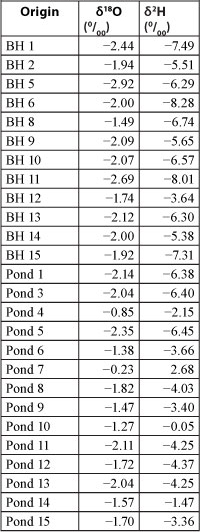
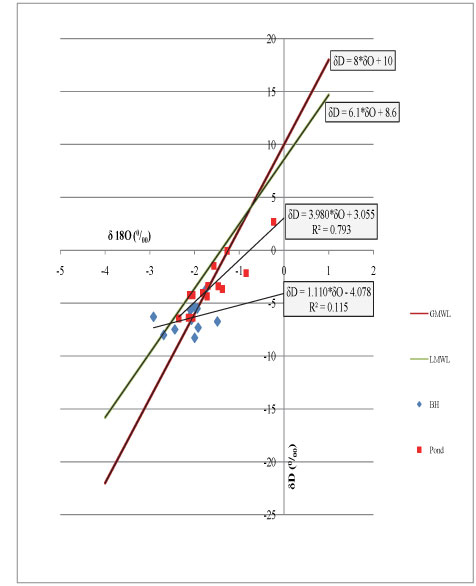
Figure 9
Plot of 18O isotope vs. 2H isotope data
As shown in Fig. 9, the signatures of the stable isotopes of the pond water lie along a correlative line with a slope of 3.980 which is between 1 and 5. This suggests that the oxygen-18 and deuterium data for the pond water followed an evaporation line, according to Schwartz and Zhang (2003). The pond waters were significantly affected by the evaporation processes in the study area. However, the signatures of the stable isotopes of the borehole water did not correlate well and were closer to each other. In contrast to the pond water, borehole water is not affected by evaporation processes in the study area.
Conceptual model of the salinity process in the study area
Based on available data andinformation, it is possible to derive a conceptual model of the salinization process. In the study area, groundwater is pumped from the aquifer and stored in the ponds. While being subj ect to intensive evaporation, as indicated by the isotope analysis, the pond water is re-pumped to irrigate the sub-adjacent crop area. Some water used in irrigating the fields 1s taken up by plants for growth, whereas some is eventually returned to the atmosphere through direct evaporation and plant transpiration. The remaining water infiltrates and percolates deeper to recharge the aquifer. During the rainy season returns in winter, the ponds are directly filled up again, thecrops are directly irrigated and the aquifer is naturally recharged. When the summer dry season arrives, the water is pumped again from the aquifer to fill up the ponds and the same proems continues in a cycle (Fig. 10). The possible scenarios of the occurrence andaccumulation of salt in the environment of the study area can be sketched in Fig. 10.
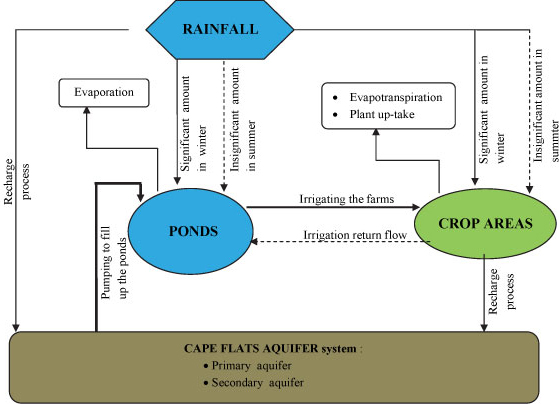
Figure 10
A conceptual diagram showing the circulation of water used for irrigation in the study area
As can be observed in Fig. 10, the pond water is the core of the system. Water from different sources is stored in the ponds and later pumped out for crop irrigation. The sources of the pond water are mainly groundwater which is pumped in summer, and rain, which is significant in winter, and limited return flow water, which depends on the amount of the applied irrigation water,. local geomorphology and the soil's ability to absorb the water. The conceptual model is focused on the quality of- groundwater found in the Cape Flats region, since it is the main source feeding the ponds.
According to Wright and Conrad (1995), groundwater in the main part of the Cape Flats region generally has a fairly low salinity. Increasing salt concentration in groundwater that has been observed in the region could be explained by considering 3 different scenarios (Fig. 11).
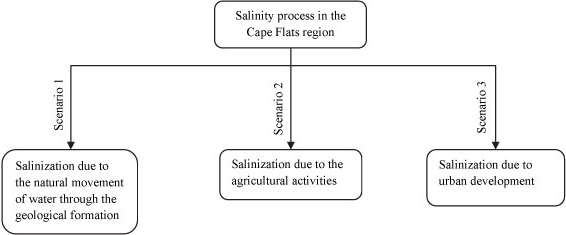
Figure 11
Diagram of possible scenarios
Scenario 1: Salt is building up due to the natural movement of water through the geological formation of the Cape Flats region
According to Wright and Conrad (1995), the geological formation of the Cape Flats region consists on Cenozoic deposits underlain by essentially impervious Malmesbury or Cape Granite, mostly composed of fine to coarse calcareous sands, thin calcareous clay and peat lenses locally. The Cape Flats Aquifer report (DWAF, 2007) indicates that the calcareous character of the porous medium influences the quality of the groundwater found in places on the Cape Flats, and that the mostly alkaline character of groundwater is due to the dissolution of calcrete and carbonate in the aquifer as a result of the effect of rock-water interactions. The Piper diagram geochemical interpretation of the borehole samples suggests that ground-water was subject to ion exchange and dissolution processes. As water and the geological formations through which water flows constitute a complex dynamic system, in which any change of one part of the system is reflected in the other part (Cogho et al., 1989), the natural movement of water through the porous media could be a source that contributed to the load of salt in groundwater found in the Cape Flats region.
Scenario 2: Salt is building up due to the agricultural activities
The agricultural sector is the main water user in the Western Cape (Adelana et al., 2006). Many tonnes of various fertilisers, manures, insecticides and fungicides are applied on the land of the Cape Flats region every year by farmers in order to meet productivity targets. For the Philippi farming area, in particular, about 400 t of fertilisers are applied on farms annually (Wright and Conrad, 1995). Agricultural activities that have been identified as posing the most serious threat to groundwater are: intensive animal feedlots, use of sewage sludge for preparing land for crop production, use of fertilisers, irrigation, and use of pesticides (Tredoux, 1984; Mehlomakulu, 2000). Irrigation could be a source of groundwater salinization in large areas as it induces important quantities of soluble salts of the applied water, as well as applied fertilisers, insecticides and fungicides to reach the water table, when the drainage system of the cultivated area is improperly managed (Kenneth and Neeltje, 2002). In the Philippi area, the accumulation of salts in- the soil and in groundwater due to irrigation practices can be examined in 3 stages:
• Short term: Because of the evaporation process in the entire region, salt can quickly build up in the pond when water is pumped out from the aquifer and stored in the pond before being used for crop irrigation. The interpretation of the stable isotopes of the pond water supports this idea as the pond water has evidently been subject to evaporation processes.
• Medium term: The evaporation of the pond water and the water used for irrigation, and the application of the fertilisers, are the constant factors which could contribute to the accumulation of salts in the study area over time.
• Long term: The long-term farming activities represent a potential source that can increase the load of salt in the study area. Farming has been practiced for more than a century in the Philippi area. Even though the farmers have good drainage facilities and good land management skills, salts often accumulate over time at different stages, for instance during the evaporation process from the ponds, the evaporation process from the aquifer, the repetition of irrigation over the crop area, the application of fertilisers, and the application of insecticides. The groundwater abstraction practice is also a stress-inducing factor on the salinity level observed in the study area. According to the information given by the farmers during the survey, water is pumped from the aquifer for about 12 h on a daily basis (from 6:00 to 18:00) at an average rate of 5 ℓ/s. This amounts to a withdrawal of about 200 m3/day from a single borehole. Considering the many boreholes pumped on a daily basis, the decline in groundwater levels could induce an ingress of saline water from the deep underlying layers.
Scenario 3: Salt is building up due to contamination from urbanisation
This scenario is deduced from the literature search which suggests that urban development can be a significant source of contamination in the case of growing cities on sandy aquifers. The Cape Town Metropolitan region is experiencing significant urban growth with a continual increase in human population. Consequently, both formal and informal settlements in and around the Metropolitan region can result in point-source contamination of the Cape Flats aquifer. Such sources could be industrial and municipal solid and liquid waste plants, tank and pipeline leakage, informal settlement's sewage systems, etc. Wright and Conrad (1995) reported that urban planners totally ignored the Cape Flats aquifer when developing the Cape Flats region, and constructed a solid waste disposal site and waste-water treatment works directly above the most productive part of the aquifer. Two waste disposal sites and sewage works were identified by Tredoux (1984) as three major sources of groundwater pollution in the Cape Flats. In addition to these three sources, impairment of the water quality could also result from the extensive housing schemes being developed in the areas where the aquifer is best suited for groundwater abstraction (Mehlomakulu, 2000). As the Cape Flats region represents a large part of the Cape Town Metropolitan area, its suburbs, residential and commercial developments could impact the quality of the water that recharges the Cape Flats aquifer and contribute to the increase in salt concentration in this shallow groundwater.
Conclusion and recommendations
Regarding the TDS data of the collected samples in the study area, the research suggested that both groundwater and pond water were mostly brackish, and fresh water was only found in the central part of the area, with the eastern parts having high saline water. The detailed comparison of the concentrations of some specific ions with the published guidelines of DWAF and FAO indicated that ions such as chloride, nitrate, potassium and sodium were above the recommended target range in most parts of the study area. The hydrogeochemical information indicated that the waters in the study area are characterised by either Ca-Cl, Ca-HCO3, Ca-SO4 or Na-Cl chemical types. Most of the pond water samples showed the same pattern of composition as their related boreholes throughout the year, and revealed that the main source of the pond water was groundwater. Environmentally stable isotopes indicated that the pond water is significantly affected by evaporation. The results also suggested that evaporation was not a significant process affecting the ion concentrations of groundwater. The research indicated that the accumulation of salts in the study area was mostly due to the agricultural activities, the evaporation process from the open water bodies (pond waters) and, to a lesser extent, the natural movement of groundwater through the geological formation of the area. Urbanisation could also play a role in the accumulation of salts the Cape Flats region. As- the vegetables grown in the study area are sensitive and moderately sensitive to salt, farmers should be encouraged to use the water with caution, and to improve their drainage and land management skills so that salts would be leached out from the root zone and would not affect plant growth. Also, the City of Cape Town should take note of the deteriorating water quality as the municipality often experiences water supply shortages, while this aquifer could be an alternative source of water supply for the city.
Continuous monitoring of water quality in the Philippi area is recommended, as it is an important user of the Cape Flats aquifer. There is also a need to investigate the impact of the various land use activities, including agricultural activities, industrial activities, and informal settlements in and around the whole Cape Flats region, on the water quality of the Cape Flats aquifer, so as to develop an awareness programme to warn the farmers, owners of industries and residents about the relevant hazards of land use on the Cape Flats aquifer. This would help to maintain the water quality of the Cape Flats aquifer within the recommended standard levels for various human uses and to protect the aquifer for future development.
Acknowledgements
The authors wish to thank the members of the steering committee of the project NUFFIC/NPT/151. University of Abomey-Calavi in Benin is acknowledged for its sponsorship for the principal author's research activity in South Africa. Partial financial assistance for some field work rendered by the UWC VLIR Water Project is appreciated. The research team is grateful for permission and cooperation received in the field work from the farmers concerned in the Philippi area.
References
ADELANA SMA, XU Y and ADAMS S (2006) Identifying sources and mechanism of groundwater recharge in the Cape Flats, South Africa: Implications for sustainable resource management. Proc. 34th Congress of the International Association of Hydrogeologists (IAH), 9-13 October 2006, Beijing. [ Links ]
AYERS RS and WESTCOT DW (1985) Water quality for agriculture. FAO Irrigation and Drainage Paper No 29, Rev. 1. Food and Agriculture Organization (FAO) Rome. [ Links ]
COGHO VE, KIRCHNER J and MORRIS JW (1989) A National Groundwater Database for South Africa - Development of the Database. WRC Report No 150/1/89. Water Research Commission, Pretoria. [ Links ]
CRAIG H (1961) Isotopic variation in meteoric water. Science 133 1702-1703. [ Links ]
DWAF (DEPARTMENT OF WATER AFFAIRS AND FORESTRY, SOUTH AFRICA) (2007) The Assessment of Water Availability in the Berg Catchment (WMA 19) by Means of Water Resource Related Models: Groundwater Model Report Volume 5: Cape Flats Aquifer Model. DWAF Report No. P WMA 19/000/00/0407. Department of Water Affairs and Forestry, Pretoria. [ Links ]
DWAF (DEPARTMENT OF WATER AFFAIRS AND FORESTRY, SOUTH AFRICA) (1996) South African Water Quality Guidelines (2nd edn.) Volume 4: Agricultural Water Use: Irrigation. Department of Water Affairs and Forestry, Pretoria. [ Links ]
DIAMOND RE and HARRIS C (1997) Oxygen and hydrogen isotope composition of Western Cape meteoric water. Research letter. S. Afr. J. Sci. 93 371-374. [ Links ]
FREEZE RA and CHERRY JA (1979) Groundwater. Prentice-Hall, Inc. Englewood Cliffs, New Jersey. [ Links ]
KENNETH KT and NEELTJE CK (2002) Agricultural drainage water management in arid and semi-arid areas. Irrigation and Drainage Paper No. 61. Food and Agriculture Organization (FAO), Rome. [ Links ]
KHODAPANAH L, SULAIMAN WNA and KHODAPANAH N (2009) Groundwater quality assessment for different purposes in Eshtehard District, Tehran, Iran. Eur. J. Sci. Res. 36 (4) 543-553. [ Links ]
KIRCHNER JOG (1995) Investigation into the contribution of ground-water to salt load of the Breede River, using natural isotopes and chemical tracers. WRC Report No. 344/1/95. Water Research Commission, Pretoria. [ Links ]
MEERKOTTER M (2003) Heavy metals and vegetable farming in Cape Town. Unpublished Masters thesis, University of the Western Cape. [ Links ]
MEHLOMAKULU M (2000) The influence of urban development on the water chemistry of the Cape Flats aquifer. Unpublished Masters thesis, University of Cape Town, South Africa. [ Links ]
RICHARDS LA (1954) Diagnosis and improvement of saline alkali soils. US Department of Agriculture Handbook No 60. United States Department of Agriculture (USDA), Washington DC. [ Links ]
SEWARD P, MBUNQUKA Z and HOLVEKA H (2009) The Cape Flats aquifer: a neglected resource needing integrated water resource- management. Proc. Biennial Groundwater Conference, 16-18 November 2009, Somerset West. [ Links ]
SCHWARTZ FW and ZHANG H (2003) Fundamentals of Groundwater. John Wiley and Sons, Inc. New York. [ Links ]
TODD DK and MAYS LW (2005) Groundwater Hydrology (3rd edn.) John Wiley and Sons, Inc. New Jersey. [ Links ]
TREDOUX G (1984) The groundwater pollution hazard in the Cape Flats. J. Water Pollut. Control 83 (4) 473-483. [ Links ]
WEAVER JMC, CAVE L and TALMA AS (2007) Groundwater sampling: A comprehensive guide for sampling methods. WRC Report No. TT 303/07. Water Resource Commission, Pretoria. [ Links ]
WRIGHT A and CONRAD J (1995) The Cape Flats aquifer current status. Stellenbosch CSIR Report No 11/95. CSIR, Stellenbosch. [ Links ]
YOUNGER PL (2007) Groundwater in the Environment: An Introduction. Blackwell Publishing Ltd, Oxford, UK & Malden, Massachusetts. [ Links ]
Received 1 March 2012
Accepted in revised form 28 March 2013.
* To whom all correspondence should be addressed. +27 21 959-3882; e-mail: yxu@uwc.ac.za

