


Servicios Personalizados
Articulo
 Inglés (pdf)
 Articulo en XML
 Referencias del artículo
Indicadores

Links relacionados
-
 Citado por Google
 -
 Similares en Google
Compartir

 Permalink
Water SA
versión On-line ISSN 1816-7950
versión impresa ISSN 0378-4738
Water SA vol.39 no.2 Pretoria ene. 2013
Comparison of neutron scattering and DFM capacitance instruments in measuring soil water evaporation
Mussie G ZerizghyI, *; Leon D van RensburgI; Jan J AndersonII
IUniversity of the Free State, PO Box 339, Department of Soil, Crop & Climate Sciences (54), Bloemfontein, South Africa
IIAgricultural Research Council (ARC) - Institute for Soil, Climate and Water, Private Bag X01, Glen 9360, South Africa
ABSTRACT
Soil water evaporation is an important parameter that needs to be accurately measured for the design of water-efficient agricultural systems. With this study, the abilities of the DFM capacitance probes and a neutron water meter (NWM) to measure evaporation from the soil surface were compared. Measured evaporation was compared to the control values measured with mini-lysimeters. Calibration of DFM capacitance probes and the NWM was done in the laboratory using the topsoil of a Bainsvlei soil form. Field measurements of soil water content were done on the same Bainsvlei soil. Calibration results indicated a good correspondence (r2 = 0.99) between the measured values and known volumetric soil water contents. There was no significant difference (p = 95%) between the DFM evaporation measurements and the control, whereas the NWM and control differed significantly. It was concluded that the DFM capacitance probe is a better tool than the NWM in measuring evaporation from the topsoil surface.
Keywords: neutron water meter, capacitance probes, evaporation, soil wetness
INTRODUCTION
In order to use the scarce water resource for agricultural production effectively, it is important that soil water content be measured as accurately as possible. The amount of water in the soil determines how strongly water molecules are retained by the soil matrix. Soil water can range from thin hygroscopic films tightly held around soil particles to saturation, where all of the soil macro-pores are filled with water. The amount of soil water determines the forces that control its movement. These forces in turn determine the availability of soil water for plant use and processes of water movement like evaporation and drainage. Thus, accurate measurement of soil water determines how accurately these components of the water balance can be quantified.
The conventional method of determining soil water content is described by Gardner (1986). With this method, a soil sample is taken and kept in an air-tight container until it is weighed; hereafter it is oven-dried at 105°C for 24 h and weighed again. The difference between the wet and dry mass expressed as a percentage of the dry mass provides the gravimetric soil water content. This method of measurement, although very accurate, is time consuming and costly. Furthermore, since the measurement employs destructive sampling, repeated measurements on the same spot are not possible. To overcome this constraint, indirect methods of soil water content measurement have been developed. One such method is the neutron water meter (NWM). This method was proposed in the 1940s and has been in use since with continual improvement (Bell, 1987). Despite the improvement, the NWM still has some drawbacks. The major concern is the health hazard of exposure to the radioactive source that is needed for neutron scattering. Besides this, although measurements can be done repeatedly, continuous logging of soil water content has not been possible. These drawbacks have been addressed with the introduction of capacitance-based soil water content measurements. The advancement of electronics has enabled capacitance probes to record continuous measurements of soil water content. The ease of use and the relatively cheaper availability of such probes make them a good candidate for use. To capitalise on these advantages due consideration should be given to measurement volumes and installation. Capacitance probes have smaller measurement volumes compared to those of NWM and require careful installation ensuring good contact with the soil.
Measuring the changes in soil water content to quantify evaporation from the soil surface has been done with various instruments. The NWM has been used to measure soil water content at different points in time and, if all the other components of the soil water balance equation are measured, it is possible to calculate the loss of soil water through evaporation from the soil surface (McGowan and Williams, 1980; Bennie et al., 1994; 1998). With the application of the same principle of monitoring change, some studies quantifying evaporation using capacitance probes have also been done (Verhoef et al., 2006; Mounzer et al., 2008). Comparison between the NWM and capacitance probes with regard to measuring soil water accurately has been done (Evett et al., 2002; Heng et al., 2002; Hossain, 2008). However, no comparative studies with regard to the measurement of evaporation have been done. The amount of water lost through evaporation from the top horizon of the soil profile can be considerable, although the change in soil water content induced by evaporation is small when considered on daily time intervals. The comparison with regard to the ability to capture the change in soil water content induced by evaporation is thus crucial.
The objective of this study was to compare the NWM and the DFM capacitance probe to measure evaporation from the soil surface against a control measured with another reliable method.
MATERIALS AND METHODS
Description of the experiment
The field experiment was conducted on the Kenilworth-Bainsvlei ecotope, located in Bloemfontein, South Africa. The soil surface was bare and kept weed-free using herbicide. Soil water measurements were taken on rain-free days. Evaporation was taken as the change in soil water content between consecutive measurements. The micro-lysimeter, DFM capacitance probes and NWM were used to measure the soil water content. For most evaporation studies the micro-lysimeter has been used (Boast and Robertson, 1982; Wythers et al., 1999; Bremer, 2003). Micro-lysimeter measured evaporation served as a control when comparing the evaporation measured by the DFM capacitance probe and NWM (Paruelo et al., 1991).
The comparison of the DFM probe and NWM was done within a larger experiment where evaporation from 11 different sections of the micro-landscape of the in-field rainwater harvesting (IRWH) system was monitored (Zerizghy, 2012). The experiment was repeated in 5 different drying cycles (2009, DOY (day of year) 315-348; 2010, DOY 60-61).
Soil water measurement
DFM capacitance probes
DFM capacitance probes (DFM Software Solutions, South Africa) were used as one of the methods to measure the soil water content. The capacitance-based probes measure soil water by measuring the dielectric constant of the soil (Hossain, 2008). The dielectric constants of various materials differ; specifically, the dielectric constant of water is much higher than that of soil. Thus, depending on the amount of water in the soil the dielectric value changes and this can be quantified by capacitance sensors. The DFM probes (Fig. 1) are multilevel soil water and temperature measuring probes. The probes had a length of 1 200 mm with 6 sensors placed at 200, 400, 600, 800, 1 000 and 1 200 mm. The centre of the first sensor (80 mm in length) was kept 150 mm from the soil surface. The probes can take measurements at intervals set by the user.
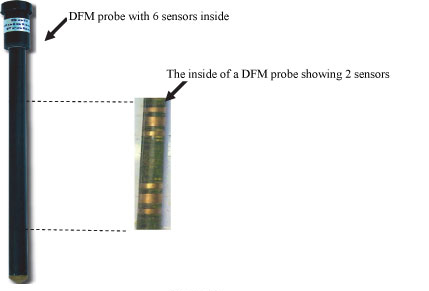
Figure 1
The multi-level water content measuring DFM capacitance probe
Neutron water meter (NWM)
The NWM (Fig. 2) is a reliable method of measuring soil water content. This instrument uses fast neutron scattering to detect the amount of water in the soil. The hydrogen molecule in water slows down the scattering neutrons and results in thermalized neutrons, which are counted by the instrument and related to the water content. To use this instrument at different soil depths, an access tube is inserted into the soil (Fig. 2). A probe which has a source of neutrons and a counter that measures the thermalized neutrons is inserted through this access tube to a pre-determined depth. For this experiment a WaterMan NW (Geoquip, South Africa) was used. The cable clamps of this machine were set to take measurements at soil depths of 150, 450, 750, 1 050, 1 350 and 1 650 mm.

Figure 2
Neutron water meter, access tubes and DFM probes on the experiment field
Micro-lysimeters
The micro-lysimeters (Fig. 3) used were cylinders with a diameter of 70 mm and a length of 300 mm. Hoffman (1997) and Bennie et al. (1998) have used similar micro-lysimeters to measure evaporation. The soil cores in the lysimeters were prepared by pressing the micro-lysimeters into the soil surface. This was done to produce undisturbed soil columns which were representative of the natural packin g.Th e lysimeters were fitted with stoppers to hold the soil column in place. For easy insertion and removal of the micro-lysimeter in the ground hole, where it is installed, a lining tube was put in place (Sharratt and McWilliams, 2005). This lining tube preserved the hole-integrity by protecting the soil wall from collapsing. The evaporative loss was determined by weighing the lysimeters and computing the difference between consecutive weighing.
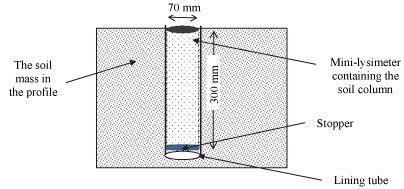
Figure 3
Schematic diagram of micro-lysimeter installation in the soil profile
This gravimetrically determined change in soil water was converted to depth units by dividing it with the surface area of the micro-lysimeters.
Measurement of soil water evaporation
Evaporation of soil water was measured as the difference between measurement days for the three soil water measuring methods. Evaporation measurement by the mini-lysimeter represented the 300 mm depth. The measurements by DFM probes and the NWM were also considered for the top 300 mm. Unrealistic values (resulting from operator error as measured against the background of ETo values for the day considered) were removed from the dataset and values corresponding to the missing values were not used during comparison of the means; hence the effect was not reflected in the statistical results.
Calibration of the soil water measuring instruments
A laboratory calibration of the DFM probes and NWM was done. For this purpose topsoil was collected from a field on a Kenilworth-Bainsvlei ecotope (Chimungu, 2009). The soil was air-dried and 5 samples were taken for determination of gravimetric soil water content. To prepare soil columns of known water content and bulk density the soil was packed into 210 I plastic drums with a diameter of 540 mm and height of 920 mm. The size of the drums was large enough to contain the sphere of influence created by the probes. The largest radius of the sphere of influence is that of NWM in dry soil, which is about 250 mm (Hillel, 2004). These drums were air-tight containers (Fig. 4) with only 2 small openings on the top through which the soil was packed. An access tube was installed in the middle of the drum (Fig. 4) and the opening properly sealed. To provide the dry-end and wet-end of the soil 2 drums were used. The drum representing the dry-end was filled with a known mass of air-dried soil. Drums were well shaken to imitate the natural packing of the soil. The bulk density was determined by taking the mass of soil filled into the drum and the volume contained by the soil. The drums representing the wet-end were prepared in the same way except that water was added to bring the known soil mass to saturation. After adding water to the soil, it was left for a month to equilibrate. The mass of the water added to saturate the soil column was recorded. The volumetric water content of the soil in the drums was calculated by determining the gravimetric water content from the mass of soil and multiplying by the bulk density divided by the density of water.
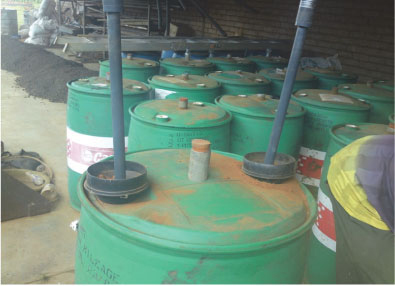
Figure 4
Two 1200 mm DFM probes inserted into a soil-filled drum for calibration
Calibration of DFM capacitance probes
For the calibration of the DFM capacitance probes the probes were installed into the drums by pushing them into the soil column and remained in the soil for at least 6 h. Two probes were installed per drum through the openings on top of the drum (Fig. 4). After the probes were inserted, the holes were sealed using plastic tape to prevent water loss through evaporation. The installed probes measured the soil water content of the drums every 30 min. To provide acceptable replication 31 probes were used for calibration. There were 16 measuring sessions on each drum (2 probes being installed at a time). After each session, the drums were well shaken to minimise the disturbance created by the installation of probes. Due to the limited height of the drums only 3 sensors on each probe recorded the water content. Since the water content of the soil column was homogenous each sensor on a probe was considered individually without any reference to depth. A DFM reading which did not indicate good contact between probe and the soil was discarded and 84 sensor readings from a total of 93 were provided. Split sample procedure of calibration and validation was followed (Chihobvu et al., 2011). The DFM readings were randomly divided into two datasets. Half of the data were used for calibration and the remaining half were used to validate the calibration equation.
Temperature correction for the sensors
It had been observed that readings of capacitance sensors were affected by temperature. Thus correcting for temperature is essential. For this purpose, monitoring of the DFM readings was conducted in a temperature-controlled room. A PVC cylinder filled with de-ionised water provided a homogenous medium into which the DFM probes were immersed. DFM readings were recorded at 5, 15, 25 and 35°C. Each temperature was maintained for a period of 48 h. The slope of the regression between temperature and DFM reading provided the rate of change. The slope was then used to derive a linear correction equation (Eq. (1)) similar to the one reported by Fares et al. (2009). The equation was designed to bring the readings taken at different temperatures to the same temperature of 25°C, a commonly-used standard ambient temperature (Wikipedia contributors, 2012). The equation is given below:

where:
DFMNT = new transformed DFM reading (%)
DFMT = temperature reading from DFM probe (°C)
DFMR = water content reading from DFM probe (%)
S = Slope determined from the relationship betwee temperature and DFM reading
The DFM readings recorded for the soil columns prepared in the drums were temperature corrected using Eq. (1). The slope (S) value found for the DFM probes was 0.04. A linear relationship between DFM readings and soil water content was assumed. The readings of the wet-end and dry-end plotted against their respective soil water contents were used for calibration. A linear regression equation between the DFM readings and known volumetric soil water content was developed.
Calibration of NWM
The same drums that were used for the calibration of the DFM probes were also used to calibrate the NWM. Measurements were taken twice daily at a depth of 300 and 600 mm. Although the water content was homogenous throughout the drum, since NWM readings are affected by depth, calibration is done separately for the two depths. Four randomly-selected readings were used for calibration, while the remaining four were used to validate the calibration equation.
Statistical analysis
SAS software (SAS Institute Inc., 2006) was used to perform the regression for both DFM readings and NWM readings against the measured volumetric soil water content values. Validation of the calibration equation was done by using the model performance parameters suggested by Willmott (1982). These parameters include the index of agreement (D-index), mean absolute error (MAE), root mean square error (RMSE) with its systematic (RMSE) and unsystematic (RMSEJ components, and the coefficient of determination (r2). Willmott (1982) points out that in a 'good' model the RMSEs should approach zero; a large RMSEs indicates bias. The D-index should approach 1 and the RMSE^ should be as close as possible to the RMSE, indicating that the deviations of simulated from measured values are random. SAS software was also used for t-test comparison between evaporation values of the micro-lysimeter and DFM as well as the micro-lysimeter and NWM.
Results and discussion
Calibration results of DFM probes and NWM
A summary of information about the soil and the statistics for the readings from the capacitance probes and NWM probe are given in Table 1. For a given soil water content, the average reading by the DFM probes and the NWM with the observed variation are shown in Table 1. The coefficient of variation (CV) indicated there was much more variation in the readings taken for the dry soil compared to the wet soil. This trend was observed for both the DFM and NWM probes. The CV observed for the NWM readings of the dry topsoil was exceptionally high. There was also variation between readings taken at the two depths.
TABLE 1
Water content and bulk density values of soil in the drum and the corresponding average DFM capacitance probe and neutron water meter (NWM) readings
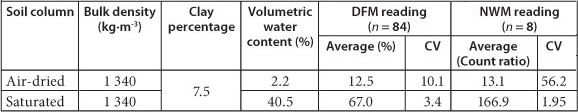
CV = coefficient of variation
The linear regression line indicating the correspondence between DFM reading and volumetric soil water content is presented in Fig. 5. The DFM readings and the volumetric values are expressed as percentages. The regression line and equation are presented on the same figure. The resulting r2 (0.99) indicated that the DFM probe readings strongly correlated with the volumetric soil water content. The linear regression had a prediction interval of 95% which is indicated by the dotted lines- on both sides of the regression line. Most of the measured data points, as well as points predicted by the regression line, fall within this interval.
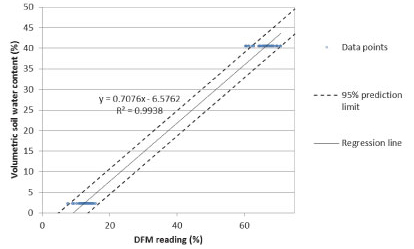
Figure 5
Regression line between DFM readings and volumetric soil water contents for the topsoil of the Kenilworth-Bainsvlei ecotope (n = 84 from 42 sensors)
The linear regression between NWM reading and volumetric soil water content is presented in Fig. 6. An r2 of 0.99 indicated there is a good correlation between the NWM readings and volumetric soil water content. Figure 6 also indicates the good performance of the linear regression fit.

Figure 6
Regression line between neutron water meter (NWM) reading and volumetric soil water content for the topsoil of the Kenilworth-Bainsvlei ecotope (n = 8)
Validation of the calibration equation of the DFM probes and NWM
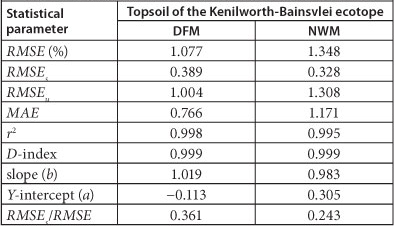
The calibration equation for converting the DFM and NWM readings into volumetric soil water content was validated on separate datasets to those from which they were developed. A summary of the statistical performance of the calibration equations is presented in Table 2. The observed RMSE values were very small for both probes and ranged between 1 and 1.35%. Excellent values for r2 and D-index showed that there was good agreement between the measured and computed values of volumetric soil water contents. This was further confirmed by slopes close to 1 for the regression between measured and computed volumetric soil water contents. The y-intercept values were small values close to zero, indicating good correspondence, even with very low soil water content. The ratio of RMSEs to RMSE for both instruments was not more than 0.36. This indicates that the errors involved in the prediction of water content were random.
TABLE 2
Statistical validation results of the calibration equation of the DFM capacitance probe and neutron water meter
Comparison of DFM probes and NWM for measuring evaporation
The evaporation values computed from observations during rain-free days are presented in Tables 3 to 5. From the 21 measurement days, 5 drying cycles were identified. A drying cycle is a rain-free period of evaporation observation after an initial wetting by rain. The evaporation observation will vary depending on the evaporation measurement interval (daily or after 2 days). The drying cycles contained 8 daily evaporation values and 4 three-day cumulative evaporation values.
The paired t-test comparisons done on the evaporation values measured by DFM probes and NWM versus the control (micro-lysimeter) are presented in Table 6. The results showed that the DFM evaporation values were not significantly different at 95% probability. Contrary to the DFM results, all the comparisons between NWM evaporation and control were significantly different.
The results confirmed that there was good correspondence between the changes in soil water content measured by the micro-lysimeter and the DFM capacitance probes. Since DFM probes are relatively new products in the market, a thorough evaluation of DFM probes with regards to their precision, accuracy and reliability over a wide range of soils is needed. Nevertheless, the performance of other types of capacitance probes can be related to them in measuring evaporation. ECH2O probes were used to measure soil water content of drying coir by Van der Westhuizen and Van Rensburg (2011) and of drying soil cores by Nhlabatsi (2010). Both reported an accuracy of less than 0.005 mm-mm-1. Such good performance in measuring soil water content can explain the sensitivity of- the DFM probes in sensing the small values of daily soil water evaporation.
The results indicated that there was a significant difference between the soil water evaporation measured by micro-lysim-eters and by the NWM. This does not disprove the reliability of NWM in measuring soil water content over the entire root zone. The reliability of the NWM to measure soil water content is undisputed (Evett et al., 2002; Heng et al., 2002; Mounzer et al., 2008). Nevertheless, the use of the NWM to monitor the rather small water content changes in the topsoil is not advised, and the NWM therefore does not appear to be suitable for measuring soil water evaporation. This may be due to one of two reasons. Firstly, the instrument carries about 2% error, arising from random counting error (Bell, 1987). This is an unavoidable error for the NWM and best practice is to keep the error as small as possible. This can hamper the NWM from sensing small changes in soil water content brought about by evaporation from the soil surface. Secondly, the NWM reading errors mostly occur in the top horizon of the soil profile where there is a possibility of radiation escaping through the surface and hence not giving a fully representative reading of the water content (McGowan and Williams, 1980). This failure of the NWM to observe daily change in water content, caused by evaporation from bare soil, is also validated by other data collected by the authors (not reported here). Daily NWM water content measurements done on Glen-Bonheim, Glen-Swartland and Paradys-Tukulu ecotopes in 2008 showed that no reliable daily evaporation measurements could be taken using this method. Hensley et al. (2000) and Botha (2006) have reported evaporation values from the water content monitoring conducted by NWM. However, in their studies they calculated evaporation values from the water balance equation, where all the other variables were known or measured. Their measurements were also done over longer periods and not based on daily water losses due to evaporation.
Various other studies comparing capacitance probes and the NWM have been done (Evett et al., 2002; Heng et al., 2002; Mwale et al., 2005; Mounzer et al., 2008; Vera et al., 2009). These studies confirmed the observation that the capacitance probes are sensitive enough to measure small changes in the soil water content due to water losses through evaporation from the soil surface. However, the presence of air-pockets could result in incorrect readings (Mwale et al., 2005). Thus, to increase the reliability of capacitance probes, there is a need to ensure proper installation of the probes. On the other hand, the abovementioned studies confirmed that the NWM gave consistent readings over a wide range of soil textures and soil water contents. This was attributed to the ability of the NWM to measure larger volumes of soil and its relatively lower sensitivity to soil heterogeneity (Heng et al., 2002; Vera et al., 2009). These studies have also confirmed the accuracy of the NWM in measuring the soil water content of the entire root zone; however, the evaporation-sensitive zone usually forms only a small fraction of the total root zone. Hoffman (1997) computed the evaporation-sensitive zone to generally be the top 300 mm. As discussed above, sensing the soil water content change in the evaporation-sensitive zone of the soil profile can be less accurate with NWM. Mounzer et al. (2008) reported that both capacitance probes and the NWM performed well in measuring the evapotranspiration from a cropped field and that the readings obtained with the capacitance probes correlated better with the values predicted by the FAO methodology.
Conclusions and recommendations
The measurement of soil water evaporation with DFM capacitance probes and NWM was compared. Measurements with the DFM probes and NWM provided good agreement with the gravimetrically determined soil water content. Both instruments can be used to monitor the change in soil water content and the multi-depth measuring capabilities provide a good tool to measure the soil water content of a soil profile. From the results it can be concluded that DFM probes provide more accurate measurements of evaporation from the topsoil than the NWM. Based on the observations made during the study it is recommended that proper care be taken when installing the DFM probes to provide good contact between the probe and the soil.
References
BELL JP (1987) Neutron Probe Practice (3rd edn.). Report 19. Institute of Hydrology, Wallingford, UK. [ Links ]
BENNIE ATP, HOFFMAN JE, COETZEE MJ and VREY HS (1994) Storage and utilization of rainwater in soils for the stabilization of crop production in semiarid zones [in Afrikaans]. WRC Report No. 227/1/94. Water Research Commission, Pretoria. [ Links ]
BENNIE ATP, STRYDOM MG and VREY HS (1998) The application of computer models for agricultural water management on ecotope level [In Afrikaans]. WRC Report No. 625/1//98. Water Research Commission, Pretoria. [ Links ]
BOAST CW and ROBERTSON TM (1982) A "microlysimeter" method for determining evaporation from bare-soil: description and laboratory evaluation. Soil Sci. Soc. Am. J. 46 689-696. [ Links ]
BOTHA JJ (2006) Evaluation of maize and sunflower production in a semi-arid area using in-field rainwater harvesting. Ph.D. thesis, University of the Free State, Bloemfontein, South Africa. [ Links ]
BREMER DJ (2003) Evaluation of microlysimeters used in turfgrass evapotranspiration studies using the dual-probe heat-pulse technique. Agron. J. 95 1625-1632. [ Links ]
CHIHOBVU E, ZHAO B and PULLES W (2011) Geochemical sampling and analyses for environmental risk assessment using the Wits basin as a case study. WRC Report No. 1624/1/10. Water Research Commission, Pretoria. [ Links ]
CHIMUNGU JG (2009) Comparison of field and laboratory measured hydraulic properties of selected diagnostic soil horizons. MSc thesis, University of the Free State, Bloemfontein, South Africa. [ Links ]
EVETT SR, LAURENT JP, CEPUDER P and HIGNETT C (2002) Neutron scattering, capacitance, and TDR soil water content measurements compared on four continents. Paper No. 1021. Proc. 17th World Congress of Soil Science, 14-21 August 2002, Bangkok, Thailand. [ Links ]
FARES A, SAFEEQ M and JENKINS DM (2009) Adjusting temperature and salinity effects on single capacitance sensors. Pedosphere 19 (5) 588-596. [ Links ]
GARDNER WH (1986) Water content. In: Klute A (ed.) Methods of Soil Analysis: Part I Physical and Mineralogical Properties. American Society of Agronomy and Soil Science Society of America, Madison, Wisconsin, USA. 493-544. [ Links ]
HENG LK, CAYCI G, KUTUK C, ARRILLAGA JL and MOUTON-NET P (2002) Comparison of soil moisture sensors between neutron probe, Diviner 2000 and TDR under tomato crops. Paper No. 1532. Proc. 17th World Congress of Soil Science, 14-21 August 2002, Bangkok, Thailand. [ Links ]
HENSLEY M, BOTHA JJ, ANDERSON JJ, VAN STADEN PP and DU TOIT A (2000) Optimizing rainfall efficiency for developing farmers with limited access to irrigation water. WRC Report No. 878/1/00. Water Research Commission, Pretoria. [ Links ]
HILLEL D (2004) Introduction to Environmental Soil Physics. Elsevier Academic Press, Amsterdam. [ Links ]
HOFFMAN JE (1997) Quantifying and prediction of evaporation from the soil surface under dry land crop production [In Afrikaans]. PhD thesis, University of the Free State, Bloemfontein, South Africa. [ Links ]
HOSSAIN MDB (2008) EM38 for measuring and mapping soil moisture in a cracking clay soil. PhD thesis, University of New England, Armidale New South Wales, Australia. [ Links ]
McGOWAN M and WILLIAMS JB (1980) The water balance of an agricultural catchment. 1. Estimation of evaporation from soil water records. J. Soil Sci. 31 217-230. [ Links ]
MOUNZER OH, HERNÁNDEZ RM, VILLENA IA, MUÑOZ JV, RUIZ-SÁNCHEZ MC, VARGAS LMT, ARNALDOS VP and GARCÍA JMA (2008) Estimating evapotranspiration by capacitance and neutron probes in a drip-irrigated apricot orchard. Interciencia 33 (8) 586-590. [ Links ]
MWALE SS, AZAM-ALI SN and SPARKES DL (2005) Can the PR1 capacitance probe replace the neutron probe for routine soil-water measurement? Soil Use Manage. 21 340-347. [ Links ]
NHLABATSI NN (2010) Soil surface evaporation studies on the Glen/Bonheim ecotope. PhD thesis, University of the Free State, Bloemfontein, South Africa. [ Links ]
PARUELO JM, AGUIAR MR and GOLLUSCIO RA (1991) Evaporation estimates in arid environments: an evaluation of some methods for the Patagonian steppe. Agric. For. Meteorol. 55 127-132. [ Links ]
SAS INSTITUTE INC. (2006) Administering SAS' Enterprise Guide 4.1. SAS Institute Inc., Cary, NC. [ Links ]
SHARRATT BS and McWILLIAMS DA (2005) Microclimatic and rooting characteristics of narrow-row versus conventional-row corn. Agron. J. 97 1129-1135. [ Links ]
VAN DER WESTHUIZEN RJ and VAN RENSBURG LD (2011) A laboratory procedure for the calibration of capacitance sensors in coir. Eur. J. Hort. Sci. 76 (4) 151-157. [ Links ]
VERA J, MOUNZER O, RUIZ-SÁNCHEZ MC, ABRISQUETA I, TAPIA LM and ABRISQUETA JM (2009) Soil water balance trial involving capacitance and neutron probe measurements. Agric. Water Manage. 96 905-911. [ Links ]
VERHOEF A, FERNÁNDEZ-GÁLVEZ J, DIAZ-ESPEJO A, MAIN BE and EL-BISHTI M (2006) The diurnal course of soil moisture as measured by various dielectric sensors: Effects of soil temperature and the implications for evaporation estimates. J. Hydrol. 321 147-162. [ Links ]
WIKIPEDIA CONTRIBUTORS (2012) Standard conditions for temperature and pressure. Wikipedia, The Free Encyclopedia. URL: http://en.wikipedia.org/w/index.php?title=Standard_conditions_for_temperature_and_ pressure&oldid= 536641136 (Accessed December 2012). [ Links ]
WILLMOTT CJ (1982) Some comments on the evaluation of model performance. Bull. Am. Meteorol. Soc. 63 1309-1313. [ Links ]
WYTHERS KR, LAUENROTH WK and PARUELO JM (1999) Bare-soil evaporation under semiarid field conditions. Soil Sci. Soc. Am. J. 63 1341-1349. [ Links ]
ZERIZGHY MG (2012) Integrating rainfall runoff and evaporation models for estimating soil water storage during fallow under infield rainwater harvesting. PhD thesis, University of the Free State, Bloemfontein, South Africa. [ Links ]
Received 20 March 2012
Accepted in revised form 20 March 2013.
* To whom all correspondence should be addressed. ffi +27 51 401 9246; fax: ++27 51 401 2212; e-mail: mossesg@yahoo.com

