


Serviços Personalizados
Artigo
 Inglês (pdf)
 Artigo em XML
 Referências do artigo
Indicadores

Links relacionados
-
 Citado por Google
 -
 Similares em Google
Compartilhar

 Permalink
Water SA
versão On-line ISSN 1816-7950
versão impressa ISSN 0378-4738
Water SA vol.39 no.1 Pretoria Jan. 2013
Pedological criteria for estimating the importance of subsurface lateral flow in E horizons in South African soils
JJ van TolI, II, *; M HensleyII; PAL le RouxII
IDepartment of Agronomy, University of Fort Hare, Private bag X1314, King Williamstown Road, Alice 5700, South Africa
IIDepartment Soil, Crop and Climate Sciences, University of the Free State, PO Box 339, Bloemfontein 9300, South Africa
ABSTRACT
E horizons formed in soils by reduction and eluviation are considered to be an indicator of subsurface lateral flow (SLF) between the A and B horizons - a hydrological process important in generating streamflow. There is, however, uncertainty in the interpretation of the hydropedological behaviour of some E horizons. This study used a physical index (SLFI) to estimate the importance of SLF in profiles with E horizons, where SLFI is  Data were obtained from the South African Land Type database. For criteria development, 156 profiles were used and an additional 80 profiles were used to validate the criteria. SLFI values were determined for the 156 profiles and then divided into 3 groups, with high, medium and low values. The basic hypothesis was that the individual quantifiable and qualitative soil and landscape properties influencing the pedogenesis of E horizons, and their integrated pedogenetic expression in soil forms, would be most and least strongly expressed in the profiles of the 'high' and 'low' SLFI groups, respectively. This concept was employed in a unique way to allocate numerical values expressing the estimated importance of the criteria with regard to SLF. In order to validate the pedological criteria the 80 test profiles were subjected to a similar procedure to that used to develop the criteria, resulting in an integrated pedological criterion value for each profile, which was then correlated against its SLFI value. Selected measured properties, i.e. organic matter, Fe, Mn and clay content, of the test profiles were also correlated against their SLFI values in the validation process. The results provide supporting evidence for the validity of the pedological criteria.
Keywords: hydrological behaviour, interflow; Land Type database; PUB; soil properties
Introduction
The identification, definition and quantification of the pathways and residence times of components of flow making up stream discharge need to be captured in hydrological models for accurate water resource predictions; estimating the hydro-logic sensitivity of the land for cultivation, contamination and development; and for quantifying low-flow mechanisms (Uhlenbrook et al., 2005; Lorentz et al., 2007 and Wenninger et al., 2008). These hydrological models can best be developed using measurements of hydrological processes and parameters. Such measurements are however expensive and time consuming, since most hydrological processes are dynamic in nature with strong temporal variation (Park and Van de Giesen, 2004; Ticehurst et al., 2007). The need for predictions of hydrological processes is becoming increasingly important, especially in predictions in ungauged basins (PUB) (Sivapalan 2003; Sivapalan et al., 2003). An 'ungauged basin' is defined as a basin or catchment with inadequate hydrological observations to enable calculation of hydrological variables (water quality and quantity) for spatial and temporal scales at an accuracy acceptable for practical applications (Sivapalan et al., 2003). The reliable interpretation of soil morphological features related to hydrological processes should therefore be of considerable value in PUB activities.
There is an interactive relationship between soil and hydrology. Water is the primary agent in soil genesis, resulting in the formation of soil properties containing unique signatures of the way they formed, and soil influences and governs hydrological processes such as the preferred flow-path and residence times (Park et al., 2001 and Soulsby et al. 2006). Soil properties are in the short term not dynamic in nature and their spatial variation is not random (Webster, 2000). The correct interpretation of spatially-varying soil properties associated with the interactive relationship between soil and hydrology can serve as indicators of the dominant hydrological processes (Ticehurst et al., 2007 and Van Tol et al., 2010), and improve the understanding of the hydrological behaviour of catchments (Lin et al., 2006).
In a vast range of catchments subsurface lateral flow (SLF) is considered a dominant streamflow generation process (Lorentz, 2001; Retter et al., 2006), not only during the recession limb of flow events, but also for peak and low flows (Harr, 1977; Mosley, 1979; Whipkey and Kirkby, 1979). SLF occurs either through the soil matrix (inter-granular pores or small structural voids) or through larger voids (macropores or pipes) (Atkinson, 1979). According to Whipkey (1965), SLF in the matrix occurs especially when 'i) the land is sloping, ii) surface soil is permeable, iii) a water-impeding layer is near the surface, and iv) the soil is saturated'. In support of Atkinson's hypothesis, Hopp and McDonnell (2009) state that the saturated hydraulic conductivity (Ksc) of the conducting layer in relation to K of the impeding layer (anisotropy) plays a first-order control in the generation of SLF. Phillip (1991); McCord, Stephens and Wilson (1991) and Jackson (1992) all report on studies concerned with SLF close to the surface in hillslopes. Their studies show that the hydrologic processes involved are complex; even in the case of deep soils that are vertically isotropic with regard to hydraulic conductivity, SLF can occur. Anisotropy, both vertically and parallel to the surface, is identified as promoting SLF. Macropore flow is, however, not dealt with in the three above studies. Jackson (1992) considers it acceptable to describe vertical anisotropy as the ratio of the two hydraulic conductivity values i.e. Ksc/Ksi. Phillip (1991) describes the influence of the hillslope angle (β) on SLF as 'tan β'.
Based on the findings of all of these researchers it is therefore logical to conclude that the vector of Ks of the conducting layer (Ksc) parallel to the slope with an angle of β needs to greater than the vertical Ks of the impeding layer (Ksi), before any lateral flow can occur in the conducting layer (Jackson, 2005):

The slope angle and the slope length (L) determine the hydraulic head (H) behind the specific point in question. As the slope angle and the length of the slope increase, the hydraulic head increases and there is therefore a greater driving force for generating SLF:

In general, it can therefore be expected that SLF will be generated when infiltrating water flowing vertically in the unsaturated state, driven by gravity, encounters a layer with lower permeability, such as an argillic B horizon or impermeable bedrock. Most studies focus on the latter. Once conditions close to saturation are attained above the impeding layer, and there is a sufficient hydraulic head upslope from the profile in question, SLF will be generated. (Whipkey, 1965; Whipkey et al., 1979; Jackson, 1992; Woods and Rowe, 1996; Jackson, 2005; Kim et al., 2005; Retter et al., 2006). The relative importance of SLF can therefore be expressed mathematically:

E horizons of the following soil forms: Estcourt (Es), Klapmuts (Km), Longlands (Lo), Kroonstad (Kd), Cartref (Cf), Wasbank (Wa), Vilafontes (Vf) and some members of the Shepstone (Sp) and Constantia (Ct) form, have formed through reduction and eluviation (MacVicar et al., 1977; Soil Classification Working Group, 1991). The genesis of E horizons of these soils involves a temporary build-up of water, i.e. perched, on a less permeable B horizon, resulting in anaerobic conditions. Due to the lack of O2, microorganisms reduce colouring agents, Fe3+ and Mn4+, to Fe2+ and Mn2+. The latter are soluble resulting in leaching of these colouring materials. Because of impaired internal drainage in a vertical direction, leaching occurs predominantly in a lateral direction. With enough leaching only the bare grey quartz soil particles remain in the horizon. During the reduction process humus, normally responsible for dark and brown colours, is also broken down, further promoting the grey colour of the eluviated horizon (Soil Classification Working Group, 1991; Le Roux et al., 1999; Schaetzl et al., 2005). Clays in the E horizon are also broken down through a process of ferrolysis, whereby Fe2+ replaces base cations on exchange sites of the clays during anaerobic conditions, resulting in leaching of the base cations. During dry aerobic periods Fe is oxidised producing exchangeable H+ which attacks clay mineral structures causing the release of silica and Al (Brinkman, 1970; Le Roux et al., 2005).
Although the genesis of E horizons by reduction usually involves eluviation of colloidal material in a predominantly lateral direction, vertical eluviation can also play a major role in the formation of E horizons. According to Schaetzl et al. (2005), Albaqualfs (similar to the Kroonstad form) in landscape positions close to streams have formed entirely by intense reduction and breakdown of organic matter followed by vertical eluviation. Jennings et al. (2008) showed that vertical infiltration is impossible during the majority of the year in a Kroonstad soil form in the Weatherley catchment, Eastern Cape, South Africa. This implies that this particular E horizon did not form according to the popular belief of vertical drainage, perching and lateral leaching. The role of SLF in E horizon genesis is also questionable under the following conditions: on gentle slopes where there is an insignificant difference between the hydraulic conductivity between the E and B horizons of the soils (see Eq. (1)); in arid areas where the soils rarely reach field saturation and the related anaerobic conditions.
In hydrological systems the role of E horizons responsible for SLF will differ from those of E horizons caused merely by a vertical water distribution. This poses problems for the interpretation of the hydrology of soils and for estimating the contribution of soils with E horizons to streamflow, groundwater recharge and evapotranspiration, as well as for determining the behaviour of pollutants in these soils. There is therefore a need for criteria to evaluate the importance of interflow in E horizons. In the context of PUB these criteria should be based on easily observable soil and landscape properties. The aim of this study was then to develop such criteria for E horizons in South African soils.
Materials and methods
All soils with E horizons (320 profiles) were selected from the Land Type database (LTD), (Land Type Survey Staff, 1972 - 2006). Poorly-documented profiles, i.e., with descriptions of less than 3 horizons, with no spatial reference or with insufficient chemical and physical data to develop the relevant criteria, as well as soils with podzol B horizons (a different pedogenetic process dominates in soils with podzol B horizons, i.e., not SLF) were not used during the study, leaving data for 236 profiles, all of which were used. The geographic distribution of these profiles is presented in Fig. 2.

Evaluation of interflow in E horizons based on soil and hillslope hydrological properties
The relative importance of SLF in the 247 profiles was estimated by solving Eq. (3) to produce a value which will be termed the SLF index or SLFI. Since no saturated hydraulic conductivity (Ks) data are available from the LTD, these values were calculated using the pedotransfer function (PTF) of Cosby et al. (1984):

where:
Ks is the saturated hydraulic conductivity (cm-day-1)
S is the total sand content (%)
C is the clay content (%)
This PTF was used since it is one of few functions estimating Ks without using bulk density. The latter is not available from the LTD. The PTF was developed from a large database of 1 448 samples. PTFs are normally only reliable for predicting properties of soils in the area in which they were developed. It was therefore necessary to validate the reliability of the PTF to estimate K for South African soils. Measured K values from 45 profiles covering a large geographical area (Van Tol et al., 2012) were compared to Ks values predicted with Eq. (4). To compensate for common underestimations of Ks values when using only texture, since that procedure ignores the influence of macropores, the largest calculated Ks value of the A and E horizons was used to represent Ksc in Eq. (3).
Slope angles (per cent rise) were assembled from digital elevation models (DEM) with a 90 m grid, using ArcGIS 9.3 (ESRI, 2008), and then converted to angles in degrees. This method was used because of its reliability, since it constantly uses 270 m to calculate the slope percentage. The visual estimates obtained from the LTD profile descriptions are subject to considerable human error, and, furthermore, different methodologies would probably have been followed by different individuals. The slope length was determined by converting the 90 DEMs to contours with a 20 m interval, also using ArcGIS 9.3, and then measuring the length from the profile in question to the nearest crest perpendicular to the contours.
Development of the criteria based on pedological properties
Of the 236 soil profiles, 156 were randomly selected and used to develop the pedological criteria. The 156 profiles were divided into 3 groups based on their SLFI values. The groups were designated as having high, intermediate or low SLFI values. The upper and lower boundaries of the groups were selected to split the profiles into groups with roughly the same amount of profiles per group. Group 1 are the profiles with SLFI values of > 200 (i.e. SLF is very likely to occur), Group 2 are profiles with SLFI values of 75-200 (intermediate chance of generating SLF), and Group 3 consists of profiles with SLFI values < 75 (slight chance of interflow generation). Differences in both soil and landscape properties related to pedogenesis between the 'high' (1) and 'low' (3) groups were used to develop the pedological criteria. The 'intermediate' group (2) was considered to be a buffer group, thus avoiding comparisons between profiles with an almost similar interflow index as estimated using Eq. (3).
The qualitative soil or landscape properties investigated include: distinctness of horizon transitions; position of the profile in the landscape; occurrence, size and colour of mottles; yellow colours of E horizon in the moist state; presence of free lime; consistency and structure of the horizon; lithol-ogy of the underlying material. The quantifiable properties included: the difference between colours of the A and E horizons; differences in the estimated clay content; average thickness of the E horizon; the average estimated slope length and angle. Colour differences were calculated using Munsell values for profiles with horizons with a colour of similar hue. The differences in estimated clay content were calculated using the field estimated texture values converted to clay content (%), using the modal clay percentage of the particular texture class obtained from the texture chart (Soil Classification Working Group, 1991). For example: SaClLm is 28% and SiCl is 50%.
Two factors were used to evaluate the importance of pedo-genetic-related soil and landscape properties on SLF. The first was an importance factor, termed the i-factor. An i-factor was determined for each soil or landscape property investigated.
Its value was taken to be equal to the fraction of the total number of soil profiles studied that fell into SLF Groups 1 and 3, which exhibited the particular soil or landscape property being investigated. The advantage of the i-factor is that it prevents attributing large criteria values to soil or landscape properties with only a small number of representative profiles, therefore avoiding bias associated with insufficient data.
The second factor was allotted a value that was determined in different ways for qualitative and quantifiable pedogenetic-related soil or landscape properties. For the former the value was based on the average relative frequency of occurrence, expressed as a fraction, of the particular property over the total number of profiles in Groups 1 and 3, respectively. For the latter the value, expressed as a fraction, was calculated as the average numerical difference allotted to the property over all the profiles studied that fell into Groups 1 and 3, respectively. Examples are presented below to clarify the procedures used to evaluate the different soil and landscape properties.
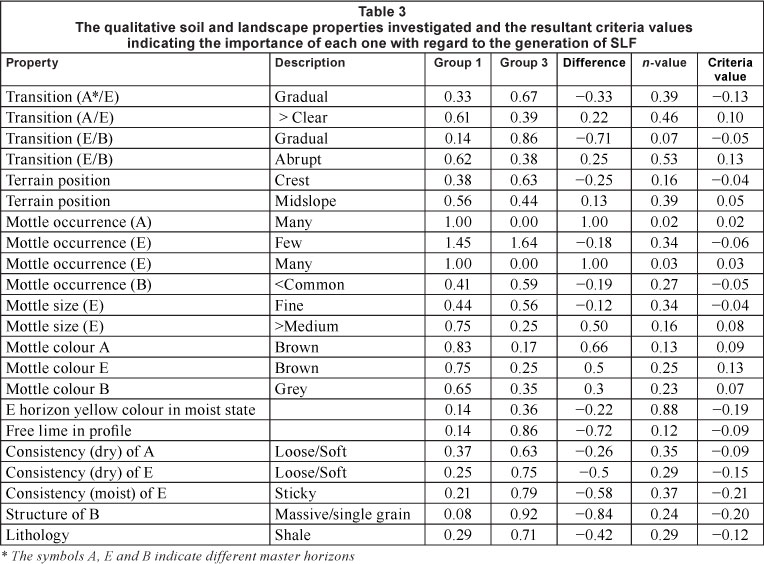
Qualitative properties: Assume that the total number of profiles in SLFI Groups 1 and 3 combined is 100, and that 53 of these have an abrupt transition from the E to the B horizon, i.e. an i-factor of 0.53 (53-100), with 33 in Group 1 and 20 in Group 3, i.e. frequency distributions of 0.62 (or 62%) and 0.38 (or 38%) in the two groups respectively. The frequency distribution difference is therefore 0.24 (0.62 minus 0.38). The relative value of the pedological criterion E/B abrupt transition in this case would be obtained by multiplying the importance factor (i-factor) by the difference in frequency of occurrence between the two groups, i.e. 0.53x0.24 = 0.13.
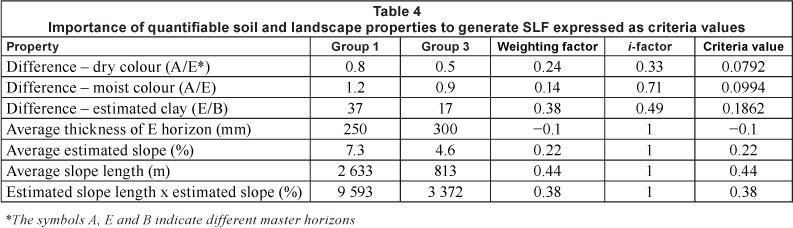
Quantifiable properties: Assuming, as before, that the total number of profiles in Groups 1 and 3 combined is 100, and that 49 of these have data on the difference between the field estimated clay content between E and B horizons; the i-factor is therefore 0.49 (49-100). Assume that the average difference in the estimated clay contents of the two groups is 37% and 17%, respectively, i.e., the average difference is 20%. The appropriate weighting factors relevant to the two groups are therefore 1.85 (37-20) and 0.85 (17-20), respectively. Expressed as a fraction of 1.00 these two values recalculate to 0.69 (1.85-2.7) and 0.31 (0.85-2.7), respectively. The weighting factor for estimated clay content is then 0.38 (0.69 minus 0.31) and the pedological criteria value for estimated clay content would be obtained by multiplying the i-factor with the relevant weighting factor, i.e. 0.49x0.38 = 0.17.
All soil and landscape properties deemed to be relevant to SLF, and which are observable, were investigated during the development of the criteria. Those properties with a frequency or weighting factor difference of less than 0.1 between Groups 1 and 3 were considered to be of insignificant importance and were therefore not used in the criteria.
The distribution of study profiles belonging to different soil forms occurring in SLF Groups 1 and 3 was also determined. Pedological criteria values were determined for each form using the same procedure as described for the qualitative soil and landscape properties.
Validation of the pedological criteria
The criteria were tested on the 80 profiles not used during the development of the criteria. A 'total' criteria value was determined for each test profile by matching its description against the results presented in Tables 2, 3 and 4 and summing the resultant criteria values to produce an integrated pedological criteria value for the profile. Since not all properties are present (or noted) in all profiles, the total criteria value is presented as a percentage of the maximum criteria value, where the maximum criteria value is the maximum value a certain profile can obtain based on the criterion values of Tables 2 to 4. For example, if there are no readings of dry colours of the A or the E horizon for a particular one of the 80 test profiles these properties will be excluded from the calculation of the maximum criterion value. Also, when the criterion value is negative (i.e. the presence of the particular property is an indicator of no or little SLF), the maximum criterion value is not lowered because profiles without the specific property would be benefitted twice, once for not having the property and a second time for the lower maximum criterion value and therefore a higher percentage of the maximum criterion value.
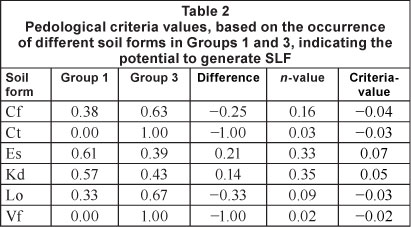
The extent to which the resultant overall pedological criteria for each soil form, presented in Table 2, properly reflect pedogenetic knowledge, tacit knowledge and experience concerning SLF in the E horizons of the different forms was taken as providing support, or lack of support, for validity of pedological criteria. The integrated criteria values expressed as percentages of the maximum criteria were then correlated against the calculated SLFI of each profile, as well as against other measured properties of the different profiles (difference between Fe, Mn, OM and clay contents of different horizons).
Results and discussion
Validation of PTF
Ks values predicted with Eq. (4) correlated against measured Ks values are presented in Fig. 1. The PTF predicted Ks fairly well with a R2 of 0.77. Slight deviation from the 1:1 line was observed. The PTF overestimate Ks for soils with high conductivity and underestimate K for soils with a low hydraulic conductivity.

Profiles with intermediate SLFI values i.e. Group 2, were omitted from criteria development. This 'buffer zone' should absorb small errors in the estimations of Ks with the PTF.
Geographical distribution of the profiles
The geographical location of the profiles used for the study is presented in Fig. 2, overlaid on the aridity index (AI) map of South Africa, using the mean annual rainfall divided by the mean annual potential evaporation (converted from Schulze et al., 2007). Groups 1, 2 and 3 refer to the different groups based on their interflow index. 'Test' refers to the location of the randomly-selected profiles used to test the developed criteria.
From Fig. 2 it is clear that E horizons seldom form at a mean annual AI value < 0.2. E horizons which did form at such AI values either occur in Group 3 (an indication of a low SLF potential) or occur within the winter rainfall region, where the mean annual AI is not reflective of the maximum AI occurring during the rainfall periods. There is an increase in the frequency of the occurrence of E horizons with an increase in AI, indicating that a greater volume of excess water (precipitation - evapotranspiration) favours the development of E horizons formed by reduction and eluviation.
Estimated SLFI values and distribution of profiles in SLFI Groups 1, 2 and 3
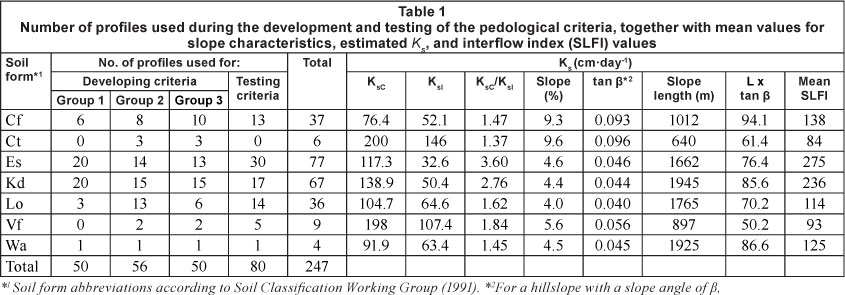
The number of profiles from different soil forms used during the development and testing of the pedological criteria as well as the estimated average saturated hydraulic conductivity (Ks) values (calculated with Eq. (4)), average slope percentages, converted to 'tan β' values, average slope lengths (L) and average SLFI values (calculated with Eq. (3)) are presented in Table 1.
Estimated Ks values ranged between 5.5 and 262 cm-day-1, with the highest values estimated in the coarse sandy E horizon of a Vf soil form and the lowest in the G horizon of Kd soils. There is generally a decrease in the slope length with an increase in the slope angle. The dominant factor determining SLFI is clearly Ksc/Ksi, and, as expected, the ratio is far higher in Es and Kd profiles, confirming current beliefs among South African pedologists.
Soil form criteria values
Results are presented in Table 2. Wasbank (Wa) form is not included, since an equal number of Wa profiles occur in both groups.
Soils of the Cf, Ct, Lo and Vf forms have a negative criteria-value indicating that in the majority of these soils there is a very slim chance of SLF generation (Table 2). In both Cf and Lo soils this might be attributed to the relatively permeable B horizons, but relatively low permeability of the layer below the B horizon. In Cf soils the relatively permeable weathered lithocutanic B horizon grades into unweathered solid rock, which facilitates ponding and formation of a perched water table on the solid rock and not at the A/B horizon interface. During extreme events this water table might reach the A horizon (or even the surface, since Cf profiles are generally shallow), where lateral flow occurs attributable to the higher permeability of the A horizon, probably due to the presence of more macropores as a result of more organic matter and faunal activity. The same mechanism applies to the formation of Lo forms, where the dominance of the lateritisation process serves as indication of relatively impermeable material below the soft plinthic horizon. The soft plinthic horizon is therefore in certain respects a thick E horizon (Le Roux et al., 1999), but with properties associated with E horizons only visible closer to the surface where the OM and microbial activity is more abundant. In soils of the Ct and Vf forms the horizon underlying the E horizon (i.e. yellow-brown apedal and neocutanic, respectively) are seldom considered restrictive to vertical flow. It is hypothesised that, although there is no lateral flow in these soils, build-up of a perched water table might occur during high intensity events due to small differences in Ks values between A/E and B horizons, resulting in reduction and vertical luviation of colloidal material. Soils of the Kd and especially Es forms are considered true SLF soils with lateral flow at the E/B horizon interface (Table 2).
Qualitative soil and landscape properties
Evaluation of the role of soil types on hydrology, especially in poorly researched catchments, requires making the most of morphological soil and landscape properties usually recorded in soil surveys (Table 3). It is logical to conclude that the magnitude of positive criteria values in Table 3 provides an indication of the degree to which a particular property promotes SLF generation. The influence of the properties on SLF generation is discussed in the following paragraphs.
The general interpretation is that the distinctiveness of the transition from the A to the E horizon reflects the impact of luviation and ferrolysis on profile development and the impact of soil morphology on the degree of lateral movement in the E horizon. When this transition is more distinct than 'clear', it indicates that lateral movement occurs predominantly in the E horizon and seldom in both A and E horizons (positive criteria value of 0.1). A more gradual transition indicates that vertical movement through the A and E horizon into the B horizon might be the dominant flow direction (negative criteria value of -0.5). The same principle applies to the nature of the transition from the E to the B horizon. Gradual transitions imply that luviation of (mostly) clay occurred uniformly from A/E to B horizons; whereas abrupt transitions imply that lateral flow above the transition must have played a role in the distinctiveness of the different horizons.
Crest or summit positions (negative criteria values) in the landscape are normally associated with low relief and therefore low potential for the development of hydraulic gradients to drive SLF, whereas midslope positions are associated with steeper slopes which favour the development of a hydraulic gradient, thereby enhancing SLF generation (Table 3).
The occurrence and size of mottles reflects the moisture regime of the soil. Detailed discussions on the formation and type of mottles in relation to water regimes are beyond the scope of this study. Excellent research in this regard includes, inter alia, Veneman et al. (1976) and Verbraskas and Bouma (1976). In general more and larger mottles are associated with longer, and more frequent, saturated conditions and therefore a higher probability to generate SLF, due to more drainable water in the profile. Brown mottles were far more frequent in the A and E horizons of SLFI Group 1 compared to SLFI Group 3, resulting in positive criteria values (Table 3). Grey-coloured mottles are associated with poorly drained conditions. B horizons of Group 1 had far more grey mottles than Group 3, implying longer periods of saturation in these horizons.
When the colour of E horizons satisfies the colour of yellow-brown apedal B horizon in the moist condition it implies an incomplete covering or removal of ferric oxides which cover the mineral soil particles (Soil Classification Working Group, 1991). More E horizons in Group 3 meet the colour requirements of yellow-brown horizons than that of Group 1, indicating that removal of colloidal material is more dominant in the latter (Table 3). Free lime dissolves and leaches with water. The presence of free lime in a profile is an indication that precipitation is more dominant than leaching. That the importance of SLF in such profiles is therefore questionable on pedogentic grounds is supported by the resultant negative criteria values in Table 3.
More E horizons of SLFI Group 3 have a loose or soft consistency in the dry state than Group 1. This is interesting since a loose/soft consistency is generally associated with low clay content and therefore high Ks values. A possible explanation for this is that the stronger consistencies (hard or very hard) favour the formation of structural pores which may considerably alter the hydraulic conductivity. A sticky consistency is however associated with a greater potential for water adsorption and more E horizons of Group 3 had a sticky consistency in the moist state than those of Group 1.
Profiles with a massive or single grain structure in the B horizon were restricted, in this study, to Ct and Cf soils. These structure types are associated with low clay contents and therefore high K values. The difference between K values between A/E and B horizons was low, and consequently the SLF index value was low for these profiles. The only noteworthy difference between lithological layers was that shales generally weather to profiles with a small potential to generate SLF. This might be attributed to the high clay contents and gentle slopes normally associated with shales.
Quantifiable soil and landscape properties
Quantifiable soil and landscape properties used in the development of the pedological criteria (Table 4) were pedological and landscape properties quantified at the profile pit.
Bleaching results in lighter colours. An increase of 1 Munsell colour value compared to the overlying horizon is typical of the degree of bleaching in E horizons (MacVicar et al., 1977). The average difference in Munsell colour value between E and A horizons is however 0.8 in Group 1 and 0.5 in Group 2 in the dry state, and 1.2 in Group 1 and 0.9 in Group 2 in the moist state (Table 4). The higher difference in colour value for the different horizons in Group 1 can be attributed to more bleaching due to more intense reduction and drainable water, and a greater potential to generate SLF.
The importance of clay content on the hydraulic characteristics of profiles has been emphasised. Field-estimated clay contents showed that the average difference between clay contents of E and B horizons in Group 1 is more than double that of Group 3 (Table 4). A larger difference in Ks values between the E and B horizons can therefore be expected in Group 1 compared to Group 3, thereby promoting SLF. This interrelationship of soil properties, developing from the impact of water movement on the soil (duplex) and the impact of the resulting texture gradient on hydrology (SLF), supports the core of the hypothesis.
The thickness of the E horizon is proportional to the volume of water needed to reach saturation in this horizon. Larger rain events are therefore needed to saturate thicker E horizons and the occurrence of SLF in thick E horizons is therefore expected to be less frequent than in thinner horizons. E horizons with an average thickness of around 300 mm are predicted here to have a negative criteria value and there is therefore little chance of SLF in these horizons (Table 4).
The influence of the slope length and angle has already been stressed. For determining the criteria value the field-estimated slope (%) was used and not the slope angle (β) calculated from DEMs and used in Eq. (3). This was done to ensure that the criteria continue to be based on observable properties and accommodate human error. The calculated slope length was, however, used, solely because this easily observable property of the landscape plays a vital role in SLF generation. The product of the slope length and the estimated slope angle was calculated for each profile individually and the result therefore differs from the product of the average estimated slope length and average estimated slope angle in Table 4. Both the slope % and length, and particularly the combination of these two in the last column of Table 4, are predicted by the high criteria values to have a dominating influence on SLF.
Criteria validation
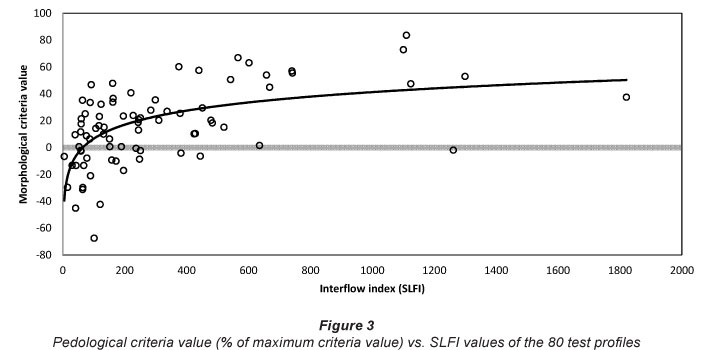
The overall pedological criteria were validated using the calculated SLFI values of the 80 profiles (recorded in Table 1) that were not utilised to develop the criteria (Fig. 3).
The SLFI value increased with an increase in the criteria value. Although the R2 value is relatively low, the results are encouraging. The logarithmic character of the trend line shows sharp increases in the potential to generate SLF with small increases in the criteria value for profile SLFI values approximately less than 200 (Groups 3 and 2). Above SLFI values of 200, small differences in the criteria value are associated with large differences in the interflow index. Dividing the 80 test profiles into the SLFI groups defined during the development of the criteria would result in average criteria values (Fig. 3), of 30.6, 8.2 and -5.7 for SLFI Groups 1, 2 and 3, respectively. This serves as further confirmation of the value of the criteria based on pedological soil and landscape properties to predict the role of interflow in soils with E horizons.
The pedological criteria were also validated using measured soil properties of the 80 test profiles. The properties selected were OM, Fe, Mn and clay content. A decrease in all of these values is expected in E horizons compared to A and B horizons. The results are presented in Figs. 4a-d. The trends in the graphs are all positive, indicating that in E horizons with higher pedological criteria values reduction and eluviation occurs more frequently and more intensely.
It is widely accepted that the OM of E horizons is removed through lateral eluviation (Soil Classification Working Group, 1991). A decrease in the OM content of the E horizon, compared to A and B horizons, is therefore expected to confirm interflow E horizons. The results in Fig. 4a show a tendency for the A-E difference to increase with an increase in the criteria value. A similar tendency is exposed for the B-E difference. The latter difference is smaller, however, and mostly negative compared to the A-E difference. This may be ascribed to the general decrease in OM with depth.
In most soil profiles an increase in the extractable Fe content is expected with an increase in depth. This is mainly due to an increase in clay with depth due to luviation. In E horizons subject to reduction reactions, Fe becomes soluble when perched water tables form and Fe is eluviated in a predominantly lateral direction. A lower Fe content is therefore expected in E horizons compared to A and/or B horizons of soil profiles subject to SLF. This tendency is supported by the results in Fig. 4b, which show a general increase in the difference between Fe content of A and E horizons, and B and E horizons, with an increase in the pedological criteria value (Fig. 4b), thereby confirming the validity of the criteria.
Similar trends to those in Fig. 4b are found when comparing the differences in Mn contents of different horizons in relation to the pedological criteria values (Fig. 4c). The same mechanism causing lower expected Fe contents in the in the E horizon will also cause lower Mn contents.
With increasing criteria values, greater differences in clay contents between B and E horizons were observed when compared with differences in clay contents of A and E horizons, as shown in Fig. 4d. This might be due to the normal increase in clay with depth, which is accentuated when clay is degraded in the E horizon and eluviation occurs laterally in the same horizon. Another reason is that certain morphological properties (such as transition between layers and estimated clay contents) relating to the clay content were used during the development phase of the criteria, resulting in large differences between B and E horizons with high criteria values.
Conclusions
The criteria based on easily observable soil and landscape properties gave a good approximation of the importance of interflow in profiles with E horizons formed by redox and eluviation. The criteria revealed that SLF is most important in Es and Kd soils. Soils with clear transitions between A/E horizons and abrupt transitions between E/B horizons have a higher tendency to generate SLF, similarly to E horizons with many (or more), medium (or larger) mottles. This is an indication that Es and Kd soils with abrupt transitions are in an self-enhancing loop, as both develop from and give rise to interflow in the landscape. An increase in the slope length, slope angle, and the product of these resulted in higher SLF values. An increase in the difference between colours and clay content of A/E horizons also resulted in a higher probability of generating SLF. All of these quantifiable and qualitative properties are in accordance with popular beliefs about the conditions under which SLF is important in E horizons and could also serve as validation of the pedological criteria.
Not only did the criteria result in acceptable predictions of estimated interflow importance, they also followed tendencies in some fundamental attributes of E horizons, such as the decrease from A to E horizons and increase from E to B horizons in organic matter, Fe, Mn and clay contents. Both Fe and Mn react by leaching in solution under reduced, saturated conditions and in soils with significant duration of saturation in the underlying horizon, i.e. Lo and Kd; precipitation under oxidised conditions and capillary rise counterbalance leaching in the E horizon.
The methodologies developed to quantify qualitative pedological properties might serve as a template for further studies relating to the interpretation of properties in terms of the behaviour of soil profiles. Future research should focus on actual measurements of SLF in E horizons over a wide range of SLFI values, for additional validation of the pedological criteria.
Acknowledgements
The authors gratefully acknowledge the Water Research Commission and the Strategic Academic Cluster: Water Management in Water Scarce Areas (UFS) for funding this research. The valuable contributions of two anonymous reviewers are also appreciated.
References
ATKINSON TC (1979) Techniques for measuring subsurface flow on hillslopes. In: Kirkby MJ (ed.) Hillslope Hydrology. Wiley, New York. 73-120. [ Links ]
BRINKMAN R (1970) Ferrolysis. A hydromorphic soil forming process. Geoderma 3 199-206. [ Links ]
COSBY BJ, HOMBERGER GM, CLAPP RB and GINN TR (1984) A statistical exploration of the relationship of soil moisture characteristics to the physical properties of soils. Water Resour. Res. 20 682-690. [ Links ]
ESRI (2008) ArcGIS 9.3. Environmental Systems Research Institute, Inc. Redlands, CA. [ Links ]
HARR RD (1977) Water flux in soil and subsoil on a steep forested slope. J. Hydrol. 33 37-58. [ Links ]
HOPP L and McDONNELL JJ (2009) Connectivity at hillslope scale: Indentifying interactions between storm size, bedrock permeability, slope angle and soil depth. J. Hydrol. 376 378-391. [ Links ]
JENNINGS K, LE ROUX PAL, VAN HUYSSTEEN CW, HENSLEY M and ZERE TB (2008) Redox conditions related to interflow in a soil of the Kroonstad form in the Weatherley catchment. S. Afr. J. Plant Soil 25 204-213. [ Links ]
JENNY H (1941) Factors of Soil Formation: A System of Quantitative Pedology. McGraw-Hill, New York. [ Links ]
JACKSON CR (1992) Characterization of subsurface flow on shallow-soiled hillslopes. PhD dissertation, University of Washington, Seattle, WA. [ Links ]
JACKSON CR (2005) A conceptual model for characterizing hillslope hydrologic behavior between the bookends of 100% vertical percolation and 100% interflow. Poster presented at IAHS SLICE workshop, 25-28 September 2005, H.J. Andrews Experimental Forest, OR. [ Links ]
KIM HY, SIDLE RC and MOORE RD (2005) Shallow lateral flow from a forested hillslope: Influence of antecedent wetness. Geoderma 60 293-306. [ Links ]
LAND TYPE SURVEY STAFF (1972-2006) Land types of South Africa: Digital map (1:250 000 scale) and soil inventory databases. ARC - Institute for Soil, Climate and Water, Pretoria. [ Links ]
LE ROUX PAL, ELLIS F, MERRYWEATHER FR, SCHOEMAN JL, SNYMAN K, VAN DEVENTER PW and VERSTER E (1999) Guidelines for the mapping and interpretation of soils in South Africa. University of the Free State, Bloemfontein. [ Links ]
LE ROUX PAL, DU PREEZ CC and BUHMANN C (2005) Indications of ferrolysis and structure degration in an Estcourt soil and possible relations with plinthite formation. S. Afr. J. Plant Soil 22 199-205. [ Links ]
LIN HS, KOGELMAN W, WALKER C and BRUNS MA (2006) Soil moisture patterns in a forested catchment: A hydropedological perspective. Geoderma 131 345-368. [ Links ]
LORENTZ SA (2001) Hydrological systems modelling research programme: hydrological processes. WRC Report No. 637/1/01. Water Research Commission, Pretoria. [ Links ]
LORENTZ SA, BURSEY K, IDOWU O, PRETORIUS C and NGELEKA K (2007) Definition and upscaling of key hydro-logical processes for application in models. WRC Report No. K5/1320. Water Research Commission, Pretoria. [ Links ]
MACVICAR CN, DE VILLIERS DE, LOXTON RF, VERSTER E, LAMBRECHTS JJN, MERRYWEATHER RF, LE ROUX J, VAN ROOYEN TH and VON M HJ (1977) Soil Classification - a binomial system for South Africa. Dept. Agric. Tech. Serv., Pretoria. [ Links ]
McCORD JT, STEPHENS DB and WILSON JL (1991) Hysteresis and state-dependent anisotropy in modelling unsaturated hillslope hydrologic processes. Water Resour. Res. 27 1501-1518. [ Links ]
MOSLEY MP (1979) Streamflow generation in a forested watershed, New Zealand. J. Hydrol. 15 795-806. [ Links ]
PARK SJ and VAN DE GIESEN N (2004) Soil-landscape delineation to define spatial sampling domains for hillslope hydrology. J. Hydrol. 295 28-46. [ Links ]
PARK SJ, McSWEENEY K and LOWERY B (2001) Identification of the spatial distribution of soils using a process-based terrain characterization. Geoderma 103 249-272. [ Links ]
PHILLIP JR (1991) Hillslope infiltration: planar slopes. Water Resour. Res. 27 109-117. [ Links ]
RETTER M, KIENZLER P and GERMANN PF (2006) Vectors of subsurface stormflow in a layered hillslope during runoff initiation. Hydrol. Earth. Syst. Sci. 10 309-320. [ Links ]
SCHAETZL R and ANDERSON S (2005) Soils: Genesis and Geomorphology. Cambridge University Press, Cambridge, UK. 347-460. [ Links ]
SCHULZE RE (2007) South African atlas of climatology and agrohydrology. WRC Report No. 1489/1/06. Water Research Commission, Pretoria. [ Links ]
SIVAPALAN M, TAKEUCHI K, FRANKS SW, GUPTA VK, KARAMBIRI H, LAKSHMI V, LIANG X, MCDONNELL JJ, MENDIONDO EM, O'CONNELL PE, OKI T, POMEROY JW, SCHERTZER D, UHLEBROOK S and ZEHE E (2003) IAHS decade on prediction in ungauged basins (PUB), 2003-2012: Shaping an exciting future for the hydrological sciences. Hydrol. Sci. J. 48 857-880. [ Links ]
SIVAPALAN M (2003) Prediction in ungauged basins: a grand challenge for theoretical hydrology. Hydrol. Process. 17 3163-3170. [ Links ]
SOIL CLASSIFICATION WORKING GROUP (1991) Soil Classification - A taxonomic system for South Africa. Mem., Agric. Nat . Resour. S. Afr. No. 15. Dept. Agric. Dev., Pretoria. [ Links ]
SOULSBY C, TETZLFF D, RODGERS P, DUNN S and WALDRON S (2006) Runoff processes, stream water residence times and controlling landscape characteristics in a mesoscale catchment: An initial evaluation. J. Hydrol. 325 197-221. [ Links ]
TICEHURST JL, CRESSWELL HP, MCKENZIE NJ and CLOVER MR (2007) Interpreting soil and topographic properties to conceptualise hillslope hydrology. Geoderma 137 279-292. [ Links ]
UHLENBROOK S, WENNINGER J and LORENTZ S (2005) What happens after the catchment caught storm? Hydrological processes at the small, semi-arid Weatherley catchment, South-Africa. Adv. Geosci. 2 237-241. [ Links ]
VAN TOL JJ, LE ROUX PAL, HENSLEY M and LORENTZ SA (2010) Soil as indicator of hillslope hydrological behaviour in the Weatherley catchment, Eastern Cape, South Africa. Water SA 36 513-520. [ Links ]
VAN TOL JJ, HENSLEY M and LE ROUX PAL (2012) Pedotransfer function to determine the water conducting macroporosity in South African soils. Water Sci. Technol. 65 550-557. [ Links ]
VENEMAN PLM, VERPRASKAS, MJ and BOUMA J (1976) The physical significance of soil mottling in a Wisconsin topose-quence. Geoderma 15 103-118. [ Links ]
VERPRASKAS MJ and BOUMA J (1976) Model studies on mottle formation simulating field conditions. Geoderma 15 217-230. [ Links ]
WEBSTER R (2000) Is soil variation random? Geoderma 97 149-163. [ Links ]
WENNINGER J, UHLENBROOK S, LORENTZ S and LEIBUND-GUT C (2008) Identification of runoff generation processes using combined hydrometric, tracer and geophysical methods in a headwater catchment in South Africa. Hydrol. Sci. J. 53 65-80. [ Links ]
WHIPKEY RZ (1965) Subsurface stormflow from forested slopes. Int. Assoc. Sci. Hydrol. Bull. 10 74-85. [ Links ]
WHIPKEY RZ and KIRKBY MJ (1979) Flow within the soil. In: Kirkby MJ (ed.) Hillslope Hydrology. Wiley, New York. 121-143. [ Links ]
WOODS R and ROWE L (1996) The changing spatial variability of subsurface flow across a hillslope. J. Hydrol. 31 49-84. [ Links ]
Received 10 February 2012;
Accepted in revised form 31 October 2012.
* To whom all correspondence should be addressed. ffi +27 40 602 2290; fax: +27 086 244 8998; e-mail: jvantol@ufh.ac.za

