


Servicios Personalizados
Articulo
 Inglés (pdf)
 Articulo en XML
 Referencias del artículo
Indicadores

Links relacionados
-
 Citado por Google
 -
 Similares en Google
Compartir

 Permalink
Water SA
versión On-line ISSN 1816-7950
versión impresa ISSN 0378-4738
Water SA vol.39 no.1 Pretoria ene. 2013
Evaluating 5 and 8 pH-point titrations for measuring VFA in full-scale primary sludge hydrolysate
T HeyI, II, *; D SandstromI; V IbrahimI; JonssonII
IVA SYD, PO Box 191, SE-201 21 Malmo, Sweden
IIWater and Environmental Engineering, Department of Chemical Engineering, Lund University, PO Box 124, SE-211 00 Lund, Sweden
ABSTRACT
An evaluation of 5 and 8 pH-point titrimetric methods for determining volatile fatty acids (VFAs) was conducted, and the results were compared for tap water and primary treated wastewater at the laboratory scale. These techniques were then applied to full-scale primary sludge hydrolysate, and the results were compared with those obtained via gas chromato-graphy. The comparison showed that the VFA concentrations measured with the two titration methods were higher than those obtained via gas chromatography, differing by 9 and 13 mg COD-£-1 for the hydrolysate and by 5 and 6 mg COD-£-1 for the ordinary primary settler effluent. No improvement in the accuracy of VFA concentration measurement was obtained from applying the 8 pH-point titration method instead of the 5 point method. The 5 pH-point method was successfully applied to determine VFA in full-scale primary sludge hydrolysate and was shown to be equally efficient to the methods that are routinely-used for this purpose.
Keywords: Multiple pH-point titration, volatile fatty acids, wastewater, full-scale, primary sludge hydrolysis
Introduction
At wastewater treatment plants (WWTPs), the addition of various external carbon sources to serve as energy source for the denitrifying heterotrophic bacteria, such as ethanol, methanol and acetic acid (AcOH), is used for extended nitrogen removal (Henze et al., 2002). The main advantages of external carbon sources are low sludge production and on-demand accessibility. Despite these advantages, full-scale applications of sludge hydrolysis for the internal production of volatile fatty acids (VFAs), functioning as an alternative carbon and energy source, is of interest, and has been implemented at several WWTPs (Andreasen et al., 1997; Canziani et al., 1995; Johansson et al., 1996; Jonsson et al., 1996; Ucisik et al., 2008). In wastewater terminology, sludge hydrolysis comprises all mechanisms that make slowly biodegradable substrates available for bacterial growth (Gujer et al., 1999).
The production of endogenous carbon sources by the application of sludge hydrolysis is motivated by sound arguments, e.g., independence from fluctuating market prices and the avoidance of transport costs. Furthermore, internally-produced VFAs are natural constituents in wastewater, and, therefore, no microbiological adaptation is required (Nyberg, 1996). Interestingly, Jonsson et al. (2008) calculated a possible decrease of 50% in the amount of external carbon source needed for denitrification resulting from the addition of hydrolysate; this was later confirmed by Hey et al. (2012) through simulations.
The major challenges associated with internal carbon source production are the optimal monitoring, control and distribution of the carbon produced. An overload of produced VFA from the hydrolysate generates increased oxygen demand in the biological process, increased sludge production and, if anaerobic digestion is used, possibly decreased gas production. In contrast, a lack of carbon prevents sufficient nitrogen removal and may cause poor biological phosphorus removal (Henze et al., 2002). The main advantages of external carbon sources are low sludge production and on-demand accessibility. Despite these advantages, full-scale applications of sludge hydrolysis for the internal production of volatile fatty acids (VFAs), functioning as an alternative carbon and energy source, is of interest, and has been implemented at several WWTPs (Andreasen et al., 1997; Canziani et al., 1995; Johansson et al., 1996; Jonsson et al., 1996; Ucisik et al., 2008). In wastewater terminology, sludge hydrolysis comprises all mechanisms that make slowly biodegradable substrates available for bacterial growth (Gujer et al., 1999).
Monitoring alkalinity and VFAs has long been considered a key indicator in evaluating the operation of anaerobic systems, because sudden changes in either parameter can signal process disturbances or even failure (Ahring et al., 1995). Therefore, significant efforts have been directed towards the development of analytical methods for the off- and on-line measurements of VFAs. Among other techniques, gas chromatography (GC), high-pressure liquid chromatography (HPLC), and Fourier transform-infra red spectroscopy (FT-IR) have been reported (Zumbusch et al., 1994; Banister and Pretorius, 1998; Steyer et al., 2002). However, the multiple pH-point titrimetric technique has attracted considerable attention, mainly because of its robustness, wide range of application, cost efficiency and user-friendliness (Moosbrugger et al., 1993; Buchauer, 1998; Lahav et al., 2000, 2002, 2004; Feitkenhauer et al., 2002; Vanrolleghem et al., 2003). Another pronounced advantage of titrations is the potential of simultaneously measuring alkalinity and VFA concentrations. The 5 pH-point method, first proposed by Moosbrugger et al. (1993), was based on choosing the initial pH of the sample in addition to 2 pairs of pH points symmetrically distributed around the dissociation points (pKa) of the carbonate and acetate systems. The 8 and 9 pH-point titration methods were subsequently developed based on the 5 pH-point method but included additional pH points for increased accuracy and precision (Lahav et al., 2002; Ai et al., 2011).
The present study aimed to evaluate the accuracy of the 5 and 8 pH-point titrimetric methods by determining the recovery of VFA in both tap water and primary settler effluent. Furthermore, the precision and applicability of the two selected methods were assessed by measuring the VFA content in hydrolysate obtained from a full-scale hydrolysis of primary sludge. The results from the latter experiment were compared with those obtained via gas chromatography (GC) analysis.
Experimental
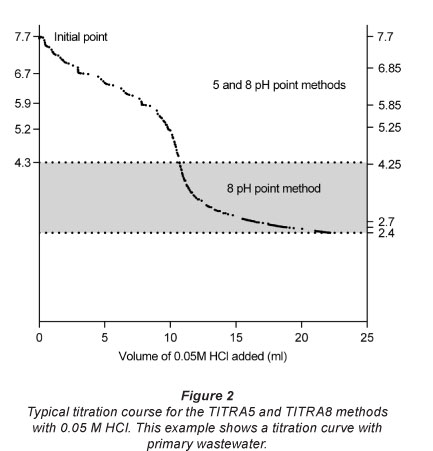
The two titration methods evaluated to determine the alkalinity and VFA measurements have been described by Moosbrugger et al. (1993) and Lahav et al. (2002). The 5 and 8 pH-point titrimetric methods, denoted as TITRA5 and TITRA8, are based on the application of acid titration to 5 and 8 predefined pH points, respectively. The major differences between these two methods are that TITRA8 has 3 additional lower pH points, 2.7 (pH5), 2.55 (chosen in this study to be pH6) and 2.4 (pH7), and requires the measurement of dissolved sulphides.
Chemicals and stock solutions
Hydrochloric acid (HCl) 0.05 M was used as the titrant, and a stock solution of 100 mg£-1AcOH equivalent was prepared by adding 227.75 mg of CH3COONa-3H2O in a 1 I glass flask filled with tap water. All chemicals were obtained from Scharlab, S.L., Spain.
Titration setup and procedure
A multiple pH-point titration was conducted with an autotitra-tor (TitroLine alpha 50 plus) connected to a magnetic stirrer and pH electrode (Blue Line pH 14), and titrant increments of 10 µ£ were chosen, following the recommendation of Buchauer (1998). The appropriate software (Titrisoft 2.6) was used to programme the TITRA5 and TITRA8 protocols. The pH electrode was calibrated with 2 buffer solutions at pH 4 and pH 7 (Hamilton Duracal Buffer, Switzerland), and the observed calibration slopes were > 0.97.
The electrical conductivity (EC, mS-m-1) and temperature (°C) of 100 m£ samples were measured with a handheld conductivity meter (EC 300) prior to starting the titration procedure. All equipment and software were obtained from Schott Instruments, Germany. The titrant volume (VHCl 005 M) was recorded at all predefined pH points, and the initial pH, EC and temperature values were entered into the software for the corresponding titration methods.
VFA recovery experiments
Sample preparation
To test and measure the recovery of different VFA concentrations in tap water, standard solutions of 5, 12.5, 25, 50, 75 and 100 mg£-1 AcOH were prepared from the standard stock solution by proper dilution in tap water. Each AcOH concentration was replicated 6 times.
To assess the VFA recovery in the wastewater matrix, grab samples of primary settled wastewater from the Klagshamn WWTP were collected. Samples were filtered through a cellulose filter (No. 1002, Munktell, Sweden) at a filtering rate of 250 m£ -min-1. The filtrate was analysed for NH4-N, PO4-P, SO42- and SO32- using HACH LANGE's cuvettes (LCK 303, LCK 350, LCK 153 and LCK 653) and spectrophotometer (DR 2800). Thereafter, AcOH was added to 100 m I samples of the filtrate to yield final concentrations of 5, 12.5, 25, 50, 75 and 100 mg£ -1. Subsequently, the EC and temperature were measured before starting the titration procedure. To establish a basis for the VFA calculation, all recorded values for the EC, temperature, initial pH, VHCl 005 M, NH4-N, PO4-P, SO4-S, and SO3-S were entered into the TITRA5 and TITRA8 algorithms. Experiments were replicated 8 times for each AcOH concentration.
Calculation of recovery
The calculation of the VFA recovery by TITRA5 and TITRA8 within the 95% confidence interval (CI) was performed according to Harris (2007). The mean value (x) and standard deviation of each AcOH concentration was measured 6 and 8 times (n = 6; 8) and was calculated, with
The confidence interval (µ) was calculated as  , where t (Student's t) was chosen according to the degrees of freedom (DF = n-1), resulting in t 2.571 and t 2.365.
Full-scale in-line hydrolysis experiment
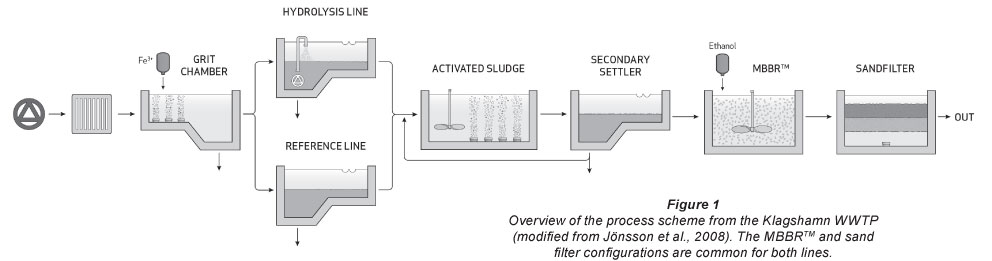
A full-scale in-line primary sludge hydrolysis has been implemented at the Klagshamn WWTP in Sweden, as described by Hey et al. (2012). Figure 1 shows the two primary tanks with a volume of 550 m3; one tank was altered for in-line hydrolysis (hydrolysis line), and another tank was unchanged (reference line). The alteration of the hydrolysis line was achieved by increasing the primary sludge concentration and retention time in the hopper. Furthermore, an adequate pump was installed to pump the sludge from the bottom of the hopper to just below the surface, to wash out the produced hydrolysate containing the VFA with the incoming wastewater flow.
Sample preparation
Grab samples were gathered simultaneously from the outlets of the reference and hydrolysis lines to measure the VFA content using TITRA5, TITRA8 and GC analyses. Similarly to the preparation of wastewater samples, the grab samples were filtered through a cellulose filter and analysed for NH4-N, PO4-P, SO42- and SO32-. Each grab sample was analysed once with TITRA5 and TITRA8, but twice by GC. A pH adjustment prior to titration was unnecessary because the initial pH of all samples was > 6.7.
VFA analysis with gas chromatography
All samples for GC analysis were prepared according to Tykesson et al. (2006). Specifically, 900 µΐ of the filtered sample and 100 µ£ of 10% H3PO4 were pipetted into a 2 mt GC vial to obtain a final pH < 2 (Boe et al., 2007). Samples were analysed for the two major VFAs, acetic acid (AcOH) and propionic acid (PrOH).
The GC analysis was conducted using an Agilent 6850 GC system with flame ionisation detection (FID). A capillary column Agilent HP-FFAP (19095F-123E), 30 m-0.53 mm N.D. coated with a 1 µπι film, was used with nitrogen (N2) as the carrier gas with a flow rate of 20 mt-min-1. The injector and FID temperatures were 180°C and 260°C, respectively. The initial capillary column temperature was 80°C and increased in 20°C steps to 120°C and then increased further by 6.13°Cmin-1 to a final temperature of 130°C. A sample volume of 0.2 µ£ was injected as pulsed splitless mode. Standard solutions of AcOH and PrOH with final chemical oxygen demand (COD) concentrations of 25, 50, 100, 200, 500, 1 000 and 2 000 mg O2t-1 were used. The calibration curves for AcOH and PrOH were obtained using duplicates of each concentration, with squared correlation coefficients (R2) of 0.9989 and 0.9997, respectively.
The primary GC data for AcOH and PrOH were converted into COD units using conversion factors 1.07 and 1.52 g O2g-1 substrate, respectively, according to Henze et al. (2002). Hence, the VFA results obtained from the TITRA5 and TITRA8 protocols were also converted into COD units to facilitate comparison with the GC results.
Results
The titration experiments were conducted to determine the recovery of known VFA concentrations in tap water and primary wastewater. All produced titration curves represented an expected decrease in pH values concomitant with the addition of the titrant. A typical curve is shown in Fig. 2, where the higher part (7.7 > pH > 4.25) is shared by the two titration methods and the highlighted part (4.25 > pH > 2.4) applies exclusively to TITRA8.
VFA recovery in tap water and primary treated wastewater
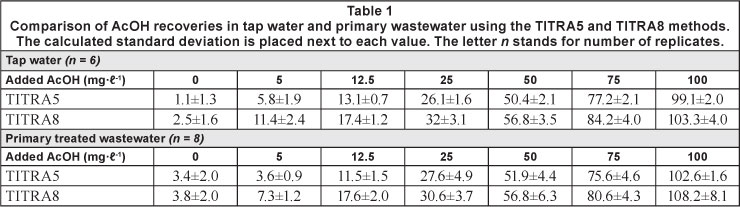
Recovery refers to the amount of analyte measured by the respective methods and is calculated as a percentage of the initial corresponding concentration. In Fig. 3, the presented data points of each AcOH concentration measured by TITRA5 and TITRA8, respectively, are mean values within the 95% CI. The slopes of the linear regression for all recovery curves were 1.0. However, the TITRA8 protocol always produced a higher positive y-intercept (4.0 and 4.5) because of a higher measured AcOH recovery compared with TITRA5 (0.63 and -0.06). In addition, the primary treated wastewater used for VFA recovery did not contain any VFA visible at the y-intercept of TITRA5 in Fig. 3b.
Furthermore, Table 1 shows that the TITRA8 protocol always produced a larger standard deviation in both tap water and primary wastewater, except for the AcOH concentrations of 25 and 75 mgt-1 for samples prepared with wastewater. Nevertheless, the squared correlation coefficient (R2) between the added and recovered amounts of VFA in the two different media, measured with both the TITRA5 and TITRA8 protocols, was always equal to or greater than 0.98.
Full-scale in-line hydrolysis experiment
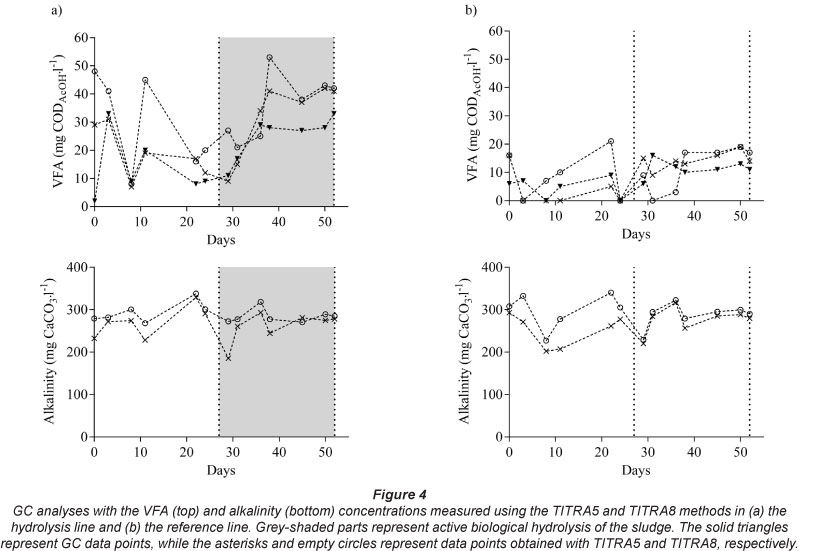
The full-scale experiment showed a higher outlet concentration of VFA in the hydrolysis line than in the reference line, regardless of the analysis method used. Figure 4 shows the measured VFA and alkalinity in the reference and hydrolysis line from over 52 days. From Day 0 until Day 29, the primary sludge outtake from the hydrolysis line was decreased gradually from 7 to 4 min/30 min but was kept constant in the reference line. Starting from Day 29, the VFA concentration at the outlet of the hydrolysis line increased steadily from approximately 10 mg CODAcOH-t-1 to approximately 43 mg CODAcOH-t-1. The latter increase offers clear proof that the biological hydrolysis of sludge occurred (grey shaded parts in Fig. 4a) and reached its steady state on Day 38. The higher VFA concentration in the hydrolysis line was measured until Day 52 to confirm the net production of approximately 20 mg CODAcOH-t-1 relative to the reference line. Thereafter, the primary sludge outtake was reset to 7 min/30 min to restore normal operation at the WWTP.
Each VFA concentration obtained in the full-scale experiment was analysed with 3 methods (TITRA5, TITRA8 and GC), thus often yielding 3 apparently different VFA concentrations (see Table 2). In most cases, the TITRA8 method yielded higher VFA and alkalinity concentrations than the TITRA5 and GC methods, as shown in Table 2. However, the overall trends concerning the VFA concentrations obtained using the TITRA5, TITRA8 and GC methods exhibited approximately identical patterns. Furthermore, the VFA concentrations measured with the TITRA8 method at Days 11, 29 and 38 (shown in parentheses in Table 2) can be considered outliers and attributed to either experimental error during the titration or other factors.

Contrary to the increase in VFA content and to the differences observed between the reference and operating lines, the alkalinity measured with the TITRA5 and TITRA8 methods exhibited similar patterns in the experiment and in both lines, with measured values (fluctuating between 200 and 300 mg CaCO3l-1) reflecting approximately constant behaviour.
Discussion
All titration curves obtained in this study showed a typical smooth acid titration pattern, with a steep slope near the inflection point, similar to the example in Fig. 2, thus confirming the reliability and good performance of the titra-tion procedure.
Selecting a suitable sampling strategy is crucial in any experiment. Considering the full-scale in-line hydrolysis experiment, the daily composite sampling was disregarded because continuous hydrolysis could occur in the sampling container, in which case the reliability of the VFA analysis would be compromised. Therefore, grab samples were collected throughout the full-scale experiment. Despite the uncertainty associated with grab sampling and hydraulic variations, exponential (Day 29 to Day 38) and steady-state (Day 38 to Day 52) patterns were observed for VFA production in the hydrolysis line (Fig. 4a). Therefore, the evaluation of full-scale in-line hydrolysis based on grab samples can be considered satisfactory for monitoring VFA and alkalinity in the hydrolysis process. Furthermore, the concentrations of approximately 10 to 20 mg CODAcOH-t-1 and 200 to 340 mg CaCO3-t-1 found in the reference line (Fig. 4b) are consistent with the typical VFA and alkalinity concentrations measured in municipal wastewater (Henze et al., 2002).
As shown in Table 2, compared with TITRA5, TITRA8 measured higher VFA and alkalinity concentrations. However, the two titration methods consistently showed higher VFA concentrations than the concentrations obtained by GC analysis. The fact that GC has been used as a reference method for comparison with the two titration methods does not insulate it from the limitations and possibilities of measurement errors.
Given that both of the selected titration methods were developed for monitoring anaerobic processes in digesters, these methods were typically designed to measure VFA concentrations in an environment of high alkalinity (1 500 -3 000 mg CaCO3t-1), suitable for the activity of methanogenic bacteria and thus the production of biomethane (Gerardi, 2003). That range of alkalinity is required to neutralise the carbonic acid resulting from dissolved carbon dioxide and to buffer the effect of the different acid components, namely, VFAs, resulting from the hydrolysis of long chain fatty acids and the metab-olisation of sugars. Based on the anticipated range of alkalinity, it was a challenging task to prove the applicability of these methods for analysing samples in which no or low alkalinity (~ 300 mg CaCO3t-1) is encountered.
By applying and comparing the 5 and 8 pH-point titra-tion methods for monitoring the in-line hydrolysis of primary sludge, some minor differences were observed that should be considered with regard to practical applications. The 8-point titration method requires additional sulphide analyses (that could have been ignored or performed less frequently if the concentration was found to be nearly constant) and the titra-tion of 3 lower pH points, thus making it more costly and time consuming than the 5-point titration method. Furthermore, the risk of titrating the last 3 pH points inaccurately in the TITRA8 protocol, resulting in a less accurate determination of the VFA concentration, was found to be more important than the potent for gaining a more accurate analysis relative to the TITRA5 protocol. This risk can be explained by the high buffering capacity of water at a low pH (2.4), which makes the lowest level of inaccuracy in pH measurements produce a rather large inaccuracy in the determination of total alkalinity when the latter is considerably low (< 600 mg CaCO3t-1). However, this impact is less pronounced when the alkalinity is equal to or greater than 1 000 mg CaCO3-£-1. For the same anticipated reasons, TITRA5 is hardly affected by the level of alkalinity because the procedure does not reach low pH values (the lowest pH is 4.3).
Therefore, proceeding from theoretical reasoning and empirical results, the accuracy of TITRA8 is considerably compromised and shown to depend more on the nature of the sample's matrix than does TITRA5. Indeed, although both titrimetric methods showed high reliability and accuracy when used to analyse standard VFA solutions prepared with tap water or wastewater matrices, TITRA5 showed higher credibility than did TITRA8 when analysing hydrolysate samples, thus enabling the practical applicability of TITRA5 for the daily laboratory routine of WWTPs in monitoring primary sludge hydrolysis. However, the supremacy of TITRA5, though demonstrated under tested experimental conditions, cannot be generalised to all types of samples, but is sufficient to promote TITRA5 as one of the preferred analytical tools.
Conclusion
Two titration methods, TITRA5 and TITRA8, measuring VFA concentrations in tap water and primary wastewater containing between 5 and 100 mg AcOHt-1, were tested. Both titration methods showed a reliable VFA recovery within the 95% CI, based on 6 and 8 replicates for each tested concentration.
A full-scale primary sludge hydrolysis experiment was conducted with a net VFA production of 20 mg CODAcOH-t-1. The results indicated a higher amount of VFA measured by titrime-try compared with GC. The alkalinity was unaffected throughout the full-scale experiment. Compared to TITRA8 and GC, the TITRA5 protocol appears sufficient for monitoring and determining VFA and alkalinity in primary-sludge hydrolysate. Although the TITRA8 protocol is typically used to ensure the quality of results obtained with TITRA5 and was performed with the same instruments, its achieved VFA concentrations were less accurate than those measured by TITRA5 and GC, mainly because of its operation under low pH and alkalinity.
Further experiments are required to determine the method detection limit (MDL) and practical quantitation limit (PQL) of VFA measurements by TITRA5 or TITRA8 protocols in waste-water matrices. In addition, the effects of the daily composite sampling, sample treatment and storage of VFA content must also be investigated.
Acknowledgements
The authors acknowledge VA SYD for financing this project and the laboratory staff at Water and Environmental Engineering at the Department of Chemical Engineering, Lund University, for the GC analyses. Ori Lahav is acknowledged for providing the software for the TITRA8 protocol.
References
AHRING B, SANDBERG M and ANGELIDAKI I (1995) Volatile fatty acids as indicators of process imbalance in anaerobic diges-tors. Appl. Microbiol. Biotechnol. 43 (3) 559-565. [ Links ]
AI H, ZHANG D, LU P and HE Q (2011) A nine-point pH titration method to determine low-concentration VFA in municipal waste-water. Water Sci. Technol. 63 (4) 583-589. [ Links ]
ANDREASEN K, PETERSEN G, THOMSEN H and STRUBE R (1997) Reduction of nutrient emission by sludge hydrolysis. Water Sci. Technol. 35 (10) 79-85. [ Links ]
BANISTER SS and PRETORIUS WA (1998) Optimisation of primary sludge acidogenic fermentation for biological nutrient removal. Water SA 24 (1) 35-41. [ Links ]
BUCHAUER K (1998) A comparison of two simple titration procedures to determine volatile fatty acids in influents to waste-water and sludge treatment processes. Water SA 24 (1) 49-56. [ Links ]
BOE K, BATSTONE DJ and ANGELIDAKI I (2007) An innovative online VFA monitoring system for the anaerobic process, based on headspace gas chromatography. Biotechnol. Bioeng. 96 (4) 712-721. [ Links ]
CANZIANI R, POLLICE A and RAGAZZI M (1995) Feasibility of using primary-sludge mesophilic hydrolysis for biological removal of nitrogen and phosphorus from wastewater. Bioresour. Technol. 54 (3) 255-260. [ Links ]
FEITKENHAUER H, VON SACHS E and MEYER U (2002) On-line titration of volatile fatty acids for the process control of anaerobic digestion plants. Water Res. 36 (1) 212-218. [ Links ]
GERARDI M (2003) The Microbiology of Anaerobic Digesters. John Wiley & Sons, Inc., Hoboken, New Jersey. 80 pp. [ Links ]
GUJER W, HENZE M, MINO T and VAN LOOSDRECHT MCM (1999) Activated sludge model No. 3. Water Sci. Technol. 39 (1) 183-193. [ Links ]
HARRIS DC (2007) Quantitative Chemical Analysis. WH Freeman and Company, New York. 53 pp. [ Links ]
HENZE M, HARREMOËS P, JANSEN LA COUR J and ARVIN E (2002) Wastewater Treatment: Biological and Chemical Processes. Springer Verlag, Berlin, Heidelberg, New York. 55 pp. [ Links ]
HEY T, JANSEN LA COUR J and JONSSON K (2012) Full scale in-line hydrolysis and simulation for potential energy and resource savings in activated sludge - A case study. Environ. Technol. 45 (15) 1819-1825. [ Links ]
JOHANSSON P, CARSLSSON H and JONSSON K (1996) Modelling of the anaerobic reactor in a biological phosphate removal process. Water Sci. Technol. 34 (1-2) 49-55. [ Links ]
JONSSON K, JOHANSSON P, CHRISTENSSON M, LEE N, LIE E and WELANDER T (1996) Operational factors affecting enhanced biological phosphorus removal at the wastewater treatment plant in Helsingborg, Sweden. Water Sci. Technol. 34 (1-2) 67-74. [ Links ]
JONSSON K, POTTIER A, DIMITROVA I and NYBERG U (2008) Utilising laboratory experiments as a first step to introduce primary sludge hydrolysis in full-scale. Water Sci. Technol. 57 (9) 1077-1086. [ Links ]
LAHAV O and LOEWENTHAL RE (2000) Measurement of VFA in anaerobic digestion: The five-point titration method revisited. Water SA 26 (3) 389-392. [ Links ]
LAHAV O, MORGAN BE and LOEWENTHAL RE (2002) Rapid, simple, and accurate method for measurement of VFA and carbonate alkalinity in anaerobic reactors. Environ. Sci. Technol. 36 (12) 2736-2741. [ Links ]
LAHAV O and MORGAN BE (2004) Titration methodologies for monitoring of anaerobic digestion in developing countries - a review. J. Chem. Technol. Biotechnol. 79 (17) 1331-1341. [ Links ]
MOOSBRUGGER RE, WENTZEL MC, EKAMA GA and MARAIS GV (1993) A 5 pH point titration method for determining the carbonate and SCFA weak acid bases in anaerobic systems. Water Sci. Technol. 28 (2) 237-245. [ Links ]
NYBERG U, ANDERSSON B and ASPEGREN H (1996) Long-term experiences with external carbon sources for nitrogen removal. Water Sci. Technol. 33 (12) 109-116. [ Links ]
STEYER P, BOUVIER JC, CONTE T, GRAS P, HARMAND J and DELGENES JP (2002) On-line measurements of COD, TOC, VFA, total and partial alkalinity in anaerobic digestion processes using infra-red spectrometry. Water Sci. Technol. 45 (10) 133-138. [ Links ]
TYKESSON E, BLACKALL LL, KONG Y, NIELSEN PH and JANSEN LA COUR J (2006) Applicability of experience from laboratory reactors with biological phosphorus removal in full-scale plants. Water Sci. Technol. 54 (1) 267-275. [ Links ]
UCISIK AS and HENZE M (2008) Biological hydrolysis and acidification of sludge under anaerobic conditions: The effect of sludge type and origin on the production and composition of volatile fatty acids. Water Res. 42 (14) 3729-3738. [ Links ]
VANROLLEGHEM PA and LEE DS (2003) On-line monitoring equipment for wastewater treatment processes: state of the art. Water Sci. Technol. 47 (2) 1-34. [ Links ]
ZUMBUSCH PV, MEYER-JENS T, BRUNNER G and MÁRKL H (1994) On-line monitoring of organic substances with high-pressure liquid chromatography (HPLC) during the anaerobic fermentation of wastewater. Appl. Microbiol. Biotechnol. 42 (1) 140-146. [ Links ]
Received 24 February 2012;
Accepted in revised form 19 November 2012.
* To whom all correspondence should be addressed. ffi +46 406350354; fax: +46 406350060; e-mail: tobias.hey@vasyd.se

