


Services on Demand
Article
 English (pdf)
 Article in xml format
 Article references
Indicators

Related links
-
 Cited by Google
 -
 Similars in Google
Share

 Permalink
Water SA
On-line version ISSN 1816-7950
Print version ISSN 0378-4738
Water SA vol.39 n.1 Pretoria Jan. 2013
Infrasonic backpulsed membrane cleaning of micro- and ultrafiltration membranes fouled with alumina and yeast
EM ShugmanI; C AldrichI; RD SandersonII; DS McLachlanII, *
IDepartment of Process Engineering, University of Stellenbosch, Private Bag X1, Matieland 7602, Stellenbosch, South Africa
IIUNESCO Associated Centre for Macromolecules, Stellenbosch, Private Bag X1, Matieland 7602, Stellenbosch, South Africa
ABSTRACT
Membrane fouling is universally considered to be one of the most critical problems in the wider application of membrane filtration. In this research microfiltration and ultrafiltration membranes were fouled during a cross-flow filtration process, using yeast and alumina suspensions in a flat cell. Infrasonic backpulsing directly into the permeate space was then used to clean the membrane, using both permeate water and soap solutions. Ultrasonic time domain reflectometry (UTDR) was used to detect and measure the growth of fouling on membrane surfaces, during the filtration and cleaning processes. The objective of this work was to examine the efficiency of back-pulse cleaning, using different combinations of membrane materials and foulants, in flat cells. The results show that a flux value of between 60% and 95% of the clean water value can be recovered after cleaning, by using a sequence of three 6.7 Hz backpulses, each pulse being 35 s long with a peak amplitude of about 140 kPa.
Keywords: fouling; microfiltration; ultrafiltration; backpulsing; ultrasonic; membrane cleaning
Introduction
Membrane filtration was not considered to be a technically important separation process until about 25 years ago. Currently, membrane filtration technology can be found in a wide range of applications in many industrial fields. These include the food, beverage and diary industries, as well as biotechnology, metallurgical, pulp and paper, textile, pharmaceutical, and chemical industries. Likewise, membranes have become prominent in water treatment for domestic and industrial water supply, including seawater desalination and also microfiltration of brackish water (Mulder, 1996).
Membrane fouling is a major problem in membrane filtration technology. Fouling is caused by the adsorption of the foulant, not only on the surface of the membrane, but also inside the membrane pores. This reduces both permeate flux and membrane selectivity, and leads to reduced life time and efficiency of the membranes (Zahid, 1993).
Various techniques exist to reduce membrane fouling and to clean membranes, where necessary. These include chemical cleaning, backpulsing, physical brushing, modification of membrane chemistry, feed particle addition, feed pre-treatment and hydrodynamic techniques (such as turbulent flow, air sparging, and adding inserts), periodic pulsation, and increasing the surface roughness to introduce flow instability. Many of these methods can effectively reduce membrane fouling, but do not seem to be sufficiently effective to give a continuously high flux rate. Backpulsing is a cleaning technique that has been shown to continuously remove deposited foulants from the surface of the membrane (Mores and Davis, 2000).
The backpulsing method of cleaning has been studied by several research groups. Rodgers and Sparks (1991, 1992, 1993) and Wilharm and Rodgers (1996) conducted backpulsing ultra-filtration (UF) experiments with dilute protein solutions (bovine serum albumin) as the foulant, and using flat-sheet polymeric membranes. They found that for laminar cross-flow the flux values after backpulse cleaning of the membranes increased by up to 100% of that of a fully-fouled membrane. They concluded that the reason for the flux increase was that the 'drumhead' motion of the membrane, due to the backpulse pressure (which was lower than the feed pressure), was only sufficient to remove the foulant layer.
Redkar and Davis (1995) used continuous backpulsing during the microfiltration (MF) of washed yeast cell suspensions, with flat sheet cellulose acetate membranes, and found that the permeate flux increased 10-fold over that observed without continuous backpulsing. Redkar et al. (1996) used backpulsing for the MF of yeast suspended in deionised water and obtained permeate fluxes that were up to 85% of that of the clean membrane flux.
Various methods, which provide information about the behaviour and progression of membrane fouling, have been used to measure or monitor fouling in both industrial and laboratory membrane applications (Peterson et al., 1998). The non-destructive and non-invasive ultrasonic technique, which is a comparatively inexpensive measurement technique for the investigation of membrane fouling, can successfully monitor the growth of fouling layers and has been used by many groups (Peterson et al., 1998; Mairal et al., 1999; Mairal, 1998; Li et al., 2004; Mairal et al., 2000). Peterson et al. (1998) found that ultrasonic time domain reflectrometry (UTDR) could be utilised for the real-time measurement of the changes in membrane thickness under high-pressure operating conditions. They also found that this technique did not interfere with the collection of standard performance data - for example, the permeate flux.
Recently, Li and coworkers used UTDR to monitor membrane fouling (Li and Sanderson, 2002; Li et al., 2002a,b,c). Li and Sanderson (2000) described the application of the UTDR technique to the continuous visualisation of particle deposition and removal from a nylon membrane during cross-flow MF. Their results showed that UTDR could be used to mon tor the growth of the fouling layer, which provides useful inf rmation on the fouling process. Li et al. (2000b) described the application of UTDR to the measurement of membrane foulin MF system with paper mill effluent from a wastewater treatment plant. All these results showed a correspondence between the UTDR signal response from the membrane and th growth of the fouling layer on the surface of the membrane.
Li et al. (2000a) also used UTDR to measure orga ic fouling during ultrafiltration with polysulphone membran s. Again they found that the ultrasonic signal response could be used to monitor fouling layer formation and growth on the me brane surface. Sanderson et al. (2002) and Sanderson et al. (2005) used UTDR as a technique for visualisation of both membrane fouling and cleaning in a reverse osmosis (RO) system . and showed that the UTDR technique could be used to det ct fouling layer initiation and monitor its growth on the membrane surface.
The main objectives of this research were:
- To ascertain how the foulant layers deposit on membrane surfaces and how efficiently the foulant deposits ran be removed using the backpulsing cleaning technique, with both RO water and a soap solution. To this end, a suspension of an inorganic washed alumina powder was used ith a nylon MF filter and an organic yeast suspension/soluti was used with a UF membrane.
- To use the UTDR to monitor the growth of the fouling layer on the membrane surface.
- To examine both the fouled and cleaned membranes usi g a scanning electron microscope (SEM).
Although it was realised that the fouling would be mainly d e to particle deposition (especially in the case of alumina), it as decided to see if any further improvement could be obtaine if a soap solution was used to backwash the membranes.
Backpulsing theory
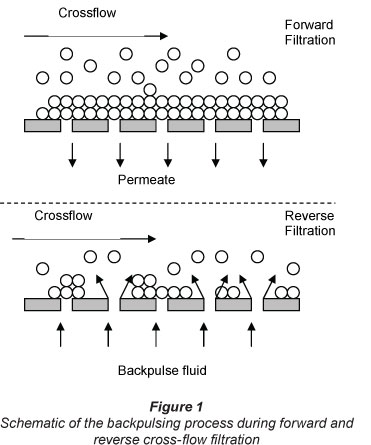
The effect of a negative transmembrane pressure (TMP) backpulsing process, which was used in these experiments, is illustrated in Fig. 1 (Kuberkar et al., 1998). During forward filtration, the applied pressure on the feed side is much greater than the pressure on the permeate side, and hence the feed liquid is forced to flow through the membrane. This causes a fouling layer to build up. When the pressure on the permeate side is higher than the pressure on the feed side (reverse TMP), the permeate liquid is forced back through the membrane to the feed side. The reverse flow dislodges the deposit of rejected foulants from the membrane, and, in some cases, from inside the membrane pores, which is then removed from the membrane module by the cross-flow (Kuberkar et al., 1998; Sondhi et al., 2000). There are several factors affecting the backpuls-ing cleaning method, such as backpulse duration (the period during which the filtration system operates under a negative transmembrane pressure), pulse amplitude (the absolute peak value of the transmembrane pressure during backpulsing), and backpulse interval (the time duration between 2 consecutive pulses) (Sondhi et al., 2000).
Ultrasonic measurements in membrane modules
A cross-section view of a typical crossflow flat sheet membrane cell, showing the principle of UTDR measurement of fouling, is illustrated in Fig. 2. This set-up was first described and used by Li et al. (2000b) and Li et al. (2000c). The cell consists of 2 polymethyl methacrylate (Perspex) plates and the ultrasonic transducer is mounted on top of the cell, as shown in Fig. 2. During the filtration process most of the feed solution flows over the top of the membrane, while the permeate is withdrawn from the bottom of the membrane. When fouling occurs on the membrane surface, the properties of the membrane change due to accumulation of foulants on the surface of the membrane. If a fouling layer with thickness AS is present on the membrane surface, the reflected echoes A, B and C are produced from the different interfaces in the cell. Echo A is associated with the top plate or feed interface and Echo B is associated with the initial feed solution or membrane interface.

If the fouling layer is dense and thick enough to produce a reflected ultrasonic signal, a new echo signal will appear as a consequence of the new feed/fouling interface. The corresponding time-domain response is illustrated in Fig. 3 (Li et al., 2002c). The thickness of the fouling layer (AS) can be determined from the following equation:

where:
c is the ultrasonic velocity in the medium through which the wave travels and
(Δt) is the change in arrival time of the fouling peak.

Experimental
Membranes and feed effluents MF membranes
All MF experiments were carried out using a Biodyne A (amphoteric Nylon 6,6) membranes (Pall Corporation, Pensacola, FL, USA). The membrane had a nominal pore size of 0.2 µιη.
UF membranes
All UF experiments were carried out using flat-sheet polysulphone (PS) membranes (GR40PP Alpha Laval, USA) with 100 000 molecular weight cut-off (MWCO). The support material is a non-woven polypropylene layer with a thickness of approx. 180 mm and the membrane layer is PS with a thickness of approx. 50-60 mm.
Yeast suspension
The effluent suspension was made up of pure water (RO water) with live commercial yeast cells. Before use, the yeast was washed by placing 1 g yeast in 60 mt pure water, shaking well and then centrifuging the suspension in an Eppendorf Centrifuge 5702 at 2 000 r/min for 8 min. The cloudy liquid portion was then removed. This washing/rinsing procedure was repeated 4 times. The correct amount of washed yeast was then used to make yeast suspensions with concentrations of 1 g/t.
Alumina suspension
This suspension was made up of pure water (RO water) and alumina powder. The alumina powder was first washed by placing 1 g alumina in 60 mt pure water, after which the mixture was shaken and centrifuged in an Eppendorf Centrifuge 5702 at 1 500 r/min for 5 min. The cloudy liquid portion was then removed. The remaining mass was dried and used to make alumina suspensions. An alumina suspension with concentration of 1 g/t was used for experiments with MF membranes.
Cleaning solution
The soap solution used in these experiments, which was chosen based on past experience, was made with 1 g ethylene diamine tetraacetic acid (EDTA), 1 g sodium laurel sulphate (SLS) and 1 g calcium hypochloride, all dissolved in 1 t pure water.
Experimental apparatus
Flat-cell filtration system
A schematic of the flat-cell membrane filtration system that was used for the MF and UF experiments is shown in Fig. 4 (Li et al., 2002d and Li et al., 2002e). The module consists of 2 Perspex plates (each 20 mm thick, 200 mm long and 94 mm wide), with a cavity in the top plate (88 mm long, 30 mm wide and 13 mm deep). The membrane, covered by a 'spiral wrap' spacer cloth, was clamped using an O ring between the two plates. The membrane rested on a bronze support set into the lower Perspex plate, below which was a cavity (88 mm long, 30 mm wide and 13 mm deep) to collect the permeate. The membrane has an effective membrane area of 0.0032 m2. The top plate has one inlet for the feed and an outlet for the retentate. The bottom plate has an outlet for the permeate and a separate inlet for backpulsing.

There are 3 pumps in the system (Fig. 4). Two peristaltic pumps (Watson Marlow 323 and 313), both of which have a flow capacity of 0 to 0.86 t/min at 0 to 400 r/min, are connected to a single feed line by a 3-way valve which allows either pure water or effluent into the membrane module. One peristaltic pump was used to feed the flat-sheet membrane cell with pure water, to condition the membrane at constant pressure, and the second peristaltic pump was used to feed the flat-sheet membrane cell with the fouling solution. A diaphragm pulsating pump (West Beach Instruments, Blouberg, RSA) was connected to the permeate side of the flat-cell membrane module. The backpulsing frequency was 6.7 Hz and the permeate tank was used as the feed tank for the pulsating pump.
Experimental procedure
The following procedure was used to obtain results such as those given in Figs. 5 and 6. Initially, in each experiment pure water (RO water) was used as the feed water, at a constant pressure and flow rate for about 15 min, to obtain the pure water permeate flux. Subsequently the feed flow was rapidly changed from pure water to the effluent solution, in order to foul the membrane. The membrane was fouled for 60 min, at which point the membrane had reached a nearly steady-state flux. The membrane was then washed using pure water for 30 min, after which the pulsating pump was switched on for 35 min. Note that permeate was used for the feed into the backpulsing pump. The peak pressure, obtained from an oscilloscope trace, was approximately 140 kPa. During this period the pulsating pump was briefly switched off from time to time to enable the system to measure the true flux; then at the end of the cycle the pulsating pump was switched off for 15 min to measure the new pure water permeate flux. The feed was then changed to the fouling solution and the membrane was fouled for 90 min, after which the feed was switched back to RO or permeate water. The pulsating pump was then switched on again for 35 min, with the same peak pressure, using either pure water or the SES soap solution as the source for the pulsating pump. The pulsating pump was then switched off again from time to time. The pulsating pump was switched off for 15 min to measure the new permeate flux, after each of the 3 cleaning cycles.
The specifics for each particular experiment, together with the results, are given in the next section.
Results and discussion
The experiments described below were all repeated at least 3 times. Despite following the same procedure each time, the plots were found to be only qualitatively reproducible. It could be that the small areas of membrane used in the different experiments were not necessarily representative of a large membrane section. The results selected for presentation below were those considered to be the most representative of a par-tic lar set of experiments.
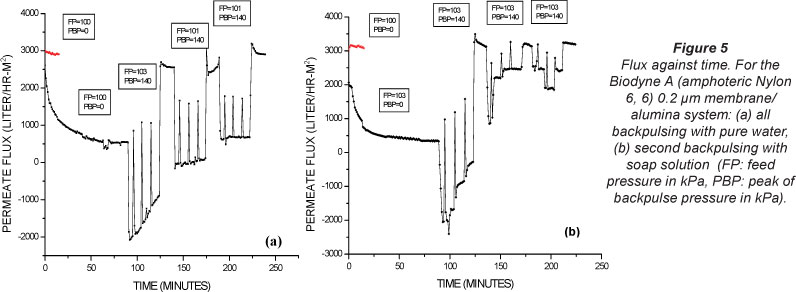
Figure 5(a) shows a plot of flux, as a function of operating time, for a 0.2 mm nylon membrane fouled with alumina. The top 15-min flux-time line (in red) shows the results for pure water prior to the introduction of the fouling solution. The lower plot shows that when the fouling solution is introduced at t = 0, the flux rapidly decreases for the first 20 min of operation followed by a more gradual decrease for the next 40 min. The initial drop is caused by the fast deposition of alumina particles, which block the membrane pores and start to form a cake layer on the membrane surface. The gradual decrease is due to a build-up of the caking layer. The flux remains steady, from 60 to 90 min during a pure water wash. During the first cleaning pulse, starting at 90 min, negative flux values are visible. After the first pulse a new pure water flux value was measured for 15 min, which showed that the first cleaning pulse had cleaned the membrane up to about 87% of the initial flux value. The second cleaning pulse of permeate water shows virtually no negative flux. After this pulse the membrane was found to have a clean water flux of up to 88% of the initial pure water value. The results for the third cleaning pulse were similar to the second but resulted in a flux close to the initial value.
Figure 5(b) shows the plot of flux as a function of operating time for an alumina-fouled 0.2 µιη nylon membrane. The procedure used to obtain this plot was the same as in the experiment shown in Fig. 5(a), except that a soap SES solution was used in the backpulsing pump during the second cleaning pulse. The first permeate water cleaning pulse, at 135 min, was found to have cleaned the membrane to 98% of the initial value. The second cleaning pulse, using the SES solution, cleaned the membrane to 98% of the initial value. The third permeate cleaning pulse cleaned the membrane to 99% of the initial value.
From an examination of all of the results, using alumina and Biodyne membranes, it was concluded that the use of a soap solution did not warrant the extra effort and cost, even though the flux during the second and third cleaning pulses was higher when a soap solution was used (Figs. 5 and 6).
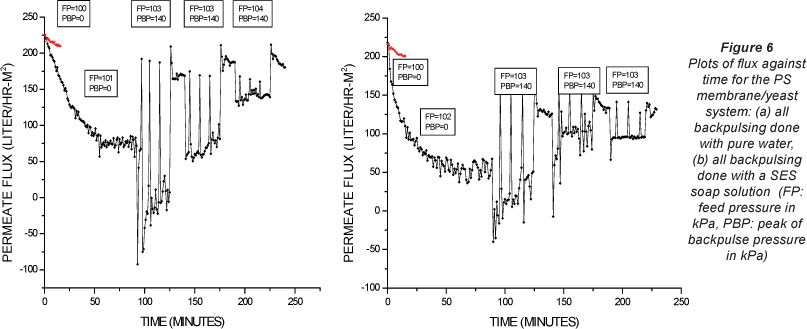
The experiments where yeast was used with the PS membrane are illustrated in Figs. 6(a) and 6(b). The procedure used was the same as that used to obtain Figs. 5(a) and 5(b). Both figures show that the flux values at 60 min ('fully' fouled values) lay at about 25% of the initial pure water flux value, and that at 90 min (washed value) the permeate flux had remained virtually unchanged. This again shows that a pure water wash cannot clean the membrane effectively without backpulsing. In Figs. 6(a) and 6(b) the fluxes after the first, second and third pulses are 77% and 50%, 81% and 61% and 81% and 61%, respectively. The main features the results shown in Figs. 6(a) and (b) are that there is much less reverse flux flow and that the flux is much higher during backpulsing than for the Biodyne A membrane. It would also appear from Figs. 5(b) and 6(b) t at the soap solution is not able to clean the membrane to a be ter flux value than that which is achieved by the first pure wat ;r backpulse. In all 4 cases the reverse flux decreased (nett flux increases) during each of the 3 back pulses. The reverse flow through the membrane caused by the reverse pressure pul es somehow inhibited and then prevented a reverse flow of liq -uid through the membrane. Note that the increased flow rates observed after successive pulses most probably resulted fr m membrane vibration only.
Figure 6(b) is quantitatively similar to Fig. 6(a), excep that the second cleaning backpulse was done using SES soluti n. The RO water flux values after all three cleaning backpul ;s were all clearly lower than in the previous case.
Figure 7 shows the changing amplitude of the reflected pulse recorded as a function of arrival times, for the experiment illustrated in Fig. 5(a). Each signal had a number of defined peaks, which are generated from different interfaces of the ter, fouling layer, membrane and the membrane support aterial. The 0 min signal, which was taken just before switching to the alumina suspension feed, shows the peak near 5.3 ms, which was generated from the pure water/new membrane int rface and internal interfaces in the membrane structure. This in tial signal was used as a reference signal for the subsequent measurements. The height of the first peak in all signals was limited by the fact that there is a very small change in density from ater to membrane or fouling layer. Note that the change over from RO water to the fouling solution, over the membrane, was estimated to take about 20 s. After 10 min of fouling a water/fou ant peak is clearly visible in front of the membrane peak, due to the start of the formation of an alumina layer. This first peak then shifts towards ever-earlier arrival times, up until the final reading at 60 min, at which time the membrane is almost completely fouled. The final fouling signal is due to a gradual increase in both the density and thickness of the cake layer.
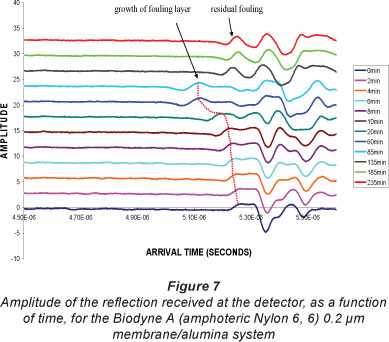
Results from these measurements show that the thickness of the fouling layer was close to 345 mm after 60 min, and that there was no effect on the thickness of the fouling layer after washing with pure water (at 85 min on the trace). The signal reflections at 135, 185 and 235 min, which are after the first, second and third cleaning pulses, respectively, show that the first cleaning pulse removed all or most of the fouling layer. Note that this is the only period during which back flow through the membrane has occurred. From the difference between the initial signal and these three signals, it is evident that the membrane properties on the surface had changed due to some residual particles in and on the surface of the membrane.
Figure 8 shows the thickness of the fouling layer calculated from the results given in Fig. 7. The arrival time for the first peak was 5.23 ms, at time t = 0, and the fouling layer thickness at this point was taken to be zero. As the filtration of the washed yeast suspension began, the thickness of the yeast l yer started to build up in front of the membrane peak, rapidly a first and then more slowly. Saturation was observed at about 60 min, where the membrane reached a near steady-state flux, as the more loosely bound particles in the outer layer were bei g swept away by the moving feed solution, as fast as they wer deposited.
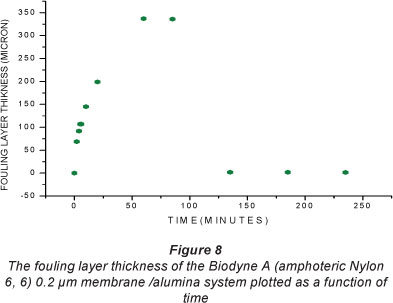
Recall that the fouling peaks (Fig. 8) at the early stages of operation time cannot be clearly seen, because of the sm ll difference in density between the thin alumina layer and th membrane. The results showed that the final thickness of the fouling layer was approximately 340 µηι. The cleaned membrane signal reflections at 135, 185 and 235 min are visibly different from that at 0 min. Note that the peak which lies in front of the 0 min peak indicates a possible residual layer. This layer is probably due to alumina particles still trapped on the cleaned membrane surface. The fact that the next peak differs from the original membrane peak indicates that ultrafine material has been trapped in the pores.
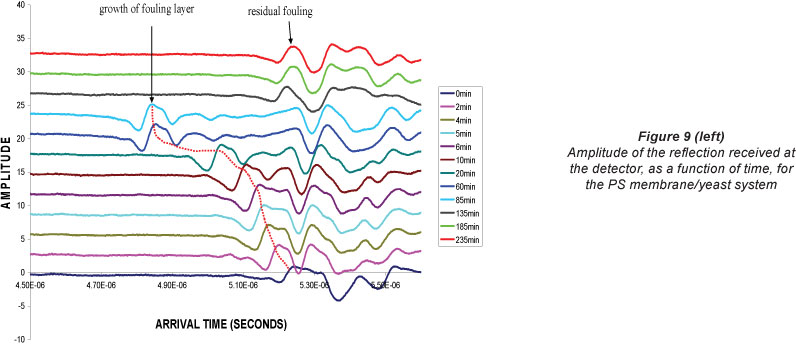
Figure 9 shows the changing amplitude of the reflected pulse, recorded as a function of arrival times, for the experiment illustrated in Fig. 6(a). Again the 0 min signal was used as a reference signal. After 2 min of fouling the shift in the peak has become clearly visible. This first peak continues to be shifted towards earlier arrival times, due to the gradual increase in the density and thickness of the cake layer. At 60 min the membrane was almost completely fouled. Results from these measurements show that the thickness of the fouling layer, after 60 min, was close to 185 mm, and that there was no effect on the thickness of the fouling layer after washing with pure water (85 min trace). The signal reflections at 135, 185 and 235 min, which are after the first, second and third cleaning pulses, respectively, show that the first cleaning pulse had removed all or most of the fouling layer. It is also evident from the reflections at these times that the 'clean' membrane properties had changed due to some residual particles in or on the surface of the membrane. The fact that the first peak becomes significantly sharper and higher during the first 5 min shows a densification of the yeast fouling layer.
Figure 10 shows the thickness of the fouling layer calculated from the results given in Fig. 9. The arrival time for the first peak was 5.23 ms and the fouling layer thickness at this point was taken to be zero. As filtration of the washed yeast suspension began, the thickness of the yeast layer started to build up in front of the membrane peak, rapidly at first and then more slowly. Saturation was observed at 60 min, when the membrane reached a near steady-state flux as the more loosely bound outer layer was being swept away by the moving feed solution.

As was the case with the alumina-fouled membranes, the fouling peaks at the early stages of operation time cannot be clearly seen, because of the small difference in density between the thin yeast layer and the membrane. The results showed that the maximum thickness of the fouling layer was approximately 340 µπι and that the cleaning pulses had removed most of the yeast. The cleaned membrane signal reflections at 135, 185 and 235 min, which occur at about the same time as the 0 min peak, are visibly different from initial peak. This suggests formation of a very thin layer giving rise to reflections at the same time as the f = 0 signal. The change in the shape of the peaks is probably due to yeast particles still on the cleaned membrane surface and in the pores, and a possible distortion of the membrane. Note that ultrafine particles which passed though the membrane could be deposited on the underside of the membrane and in the pores during backwashing.
Figure 11 shows SEM images (magnification 4 000 x) of the fouled and cleaned Nylon 0.2 mm membranes from filtration experiments carried out with the alumina suspension. Figure 11(a) shows a new membrane surface structure, where the pores of the membrane are visible. Figure 11(b) shows an image of a fully-fouled membrane after 60 min of forward cross-flow filtration. As can clearly be seen, the membrane is completely covered by an alumina cake layer. Figure 11(c) and 11(d) show images of different areas of a cleaned membrane after the third cleaning backpulse. These SEMs show that almost complete membrane cleaning was obtained in these experiments, which used the backpulsing cleaning method. For the cleaned surfaces shown in Figs. 11(c) and 11(d), the flux was observed to be slightly lower than the pure water flux.
The surface structure of a new 100 000 MWCO PS membrane is shown in Fig. 12(a). The fouled membrane image, taken after 60 min of fouling with a yeast suspension, shows deposited yeast cells that are congregated around the membrane pores. Note that this structure gives an ultrasonic reflection indistinguishable from a uniform film. Two cleaned membrane images, taken from different areas of the membrane, after the third cleaning pulse, are shown in Figs. 12(c) and 12(d). These figures show that almost complete cleaning of the membrane is obtained by backpulsing, and that almost all of the yeast layer is removed. However, Fig. 12(d) shows there was still minor yeast cell debris that remained on the membrane surface after backpulse cleaning. Recall that this yeast debris gives rise to an apparent residual thickness (Fig. 10). Figures 12(b) and 12(d) show a surface consisting of clumps of yeast, which gives rise to an ultrasound reflection that appears to come from a smooth surface, at the scale of the wavelength of the ultrasound used in these experiments.
Conclusions
The following conclusions can be drawn on the basis of the results of this study:
- Flux values, UTDR measurements and SEM images after each back-pulsing cleaning cycle showed that backpulsing with peak pressure of 140 kPa can clean MF and UF membranes to well over 90% of their original flux values. These results show that the method has commercial possibilities and could be extended to spiral wrap and capillary plants.
- UTDR can measure the rate of cake layer formation on the surface of the membrane to provide information about the changes in the thickness and density of a fouling layer, both during forward and backward (cleaning) filtration.
- SEM measurements showed that the structure of the foulant deposits on membrane surfaces before and after cleaning was in qualitative agreement with the UDTR and flux measurements.
- Excellent correlation was found between the UDTR and flux measurements.
References
KUBERKAR V, CZEKAJ P and DAVIS RH (1998) Flux enhancement for membrane filtration of bacterial suspension using high-frequency backpulsing. Biotechnol. Bioeng. 60 77-87. [ Links ]
LI J and SANDERSON RD (2002) In situ measurement of particle deposition and its removal in microfiltration by ultrasonic time-domain reflectometry. Desalination 146 169-175. [ Links ]
LI J, SANDERSON RD, HALLBAUER DK and HALLBAUER-ZADOROZHNAYA VY (2002a) Measurement and modeling of organic fouling deposition in ultrafiltration by ultrasonic transfer signals and reflections. Desalination. 146 177-185. [ Links ]
LI J, SANDERSON RD and JACOBS EP (2002b) Non-invasive visualization of the fouling of microfiltration membranes by ultrasonic time-domain reflectometry. J. Membr. Sci. 201 17-29. [ Links ]
LI J, HALLBAUER-ZADOROZHNAYA VY, HALLBAUER DK and SANDERSON RD (2002c) Cake-layer deposition, growth and compressibility during microfiltration measured and modeled using a noninvasive ultrasonic technique. Ind. Eng. Chem. 41 4106-4116. [ Links ]
LI J, HALLBAUER DK and SANDERSON RD (2003) Direct monitoring of fouling and cleaning during ultrafiltration using a noninvasive ultrasonic technique. J. Membr. Sci. 215 33- 52. [ Links ]
LI J, SANDERSON RD, HURNDALL MJ, HALLBAUER DK and HALLBAUER-ZADOROZHNAYA VY (2004) Real-time observation of fouling in membrane filtration by non-invasive ultrasonic techniques. WRC Report No. 1166/1/04. Water Research Commission, Pretoria. [ Links ]
MAIRAL AP (1998) Development of novel ultrasonic technique for real-time measurement of membrane fouling in reverse osmosis desalination. PhD thesis, University of Colorado. [ Links ]
MAIRAL AP, KRANTZ WB, GREENBERG AR and BOND LJ (1999) Real-time measurement of inorganic fouling of RO desalination membranes using ultrasonic time-domain reflectometry. J. Membr. Sci. 159 185-196. [ Links ]
MAIRAL AP, GREENBERG AR and KRANTZ WB (2000) Investigation of fouling cleaning using ultrasonic time-domain-reflectometry. Desalination 130 45-60. [ Links ]
MORES W and DAVIS RH (2000) Yeast foulant removal by back-pulses in crossflow microfiltration. J. Membr. Sci. 208 389-404. [ Links ]
MULDER M (1996) Basic Principles of Membrane Technology. Kluwer Academic Publishers, Dordrecht. [ Links ]
PETERSON RA, GREENBERG AR, BOND LJ and KRANTZ WB (1998) Use of ultrasonic TDR for real-time noninvasive meas-urment of compressive strain during membrane compaction. Desalination 116 115-121. [ Links ]
REDKAR SG and DAVIES RH (1995) Crossflow microfiltration with high frequency reverse filtration. Am. Inst. Chem. Eng. J. 41 501-508. [ Links ]
REDKAR SG, KUBERKAR RH and DAVIES RH (1996) Modeling of concentration polarization and depolarization with high frequency backpulsing. J. Membr. Sci. 121 229-242. [ Links ]
RODGERS VGJ and SPARKS RE (1991) Reduction of membrane fouling in the ultrafiltration of binary protein mixtures. Am. Inst. Chem. Eng. J. 37 1517-1528. [ Links ]
RODGERS VGJ and SPARKS RE (1992) Effect of transmembrane pressure pulsing on concentration polarization. J. Membr. Sci. 68 149-168. [ Links ]
RODGERS VGJ and SPARKS RE (1993) Effects of solution properties on polarization redevelopment and flux in pressure pulsed ultrafiltration. J. Membr. Sci. 78 163-171. [ Links ]
SANDERSON RD, LI J, KOEN LJ and LORENZEN L (2002) Ultrasonic time-domain reflectometry as a non-destructive instrumental visualization technique to monitor inorganic fouling and cleaning on reverse osmosis membranes. J. Membr. Sci. 207 105-117. [ Links ]
SANDERSON RD, LI J, HALLBAUER DK and SIKDAR SK (2005) Fourier wavelets from ultrasonic spectra: a new approach for detecting the onset of fouling during microfiltration of paper mill effluent. Environ. Sci. Technol. 39 7299-7305. [ Links ]
SONDI R, LIN YS and ALVAREZ F (2000) Crossflow filtration of chromium hydroxide suspension by ceramic membranes: fouling and its minimization by backpulsing. J. Membr. Sci. 174 111-122. [ Links ]
WILHARM C and RODGERS VGJ (1996) Significance of duration and amplitude in transmembrane pressure pulsed ultrafiltration of binary protein mixture. J. Membr. Sci. 121 217-228. [ Links ]
ZALID A (1993) Reverse Osmosis Membrane Technology, Water Chemistry and Industrial Applications. Van Nostrand Reinhold, London. [ Links ]
Received 29 August 2011;
Accepted in revised form 21 November 2012.
* To whom all correspondence should be addressed. ffi +27 21 808 3905; fax: +27 21 808 4967; e-mail: davidsm@sun.ac.za

