


Servicios Personalizados
Articulo
 Inglés (pdf)
 Articulo en XML
 Referencias del artículo
Indicadores

Links relacionados
-
 Citado por Google
 -
 Similares en Google
Compartir

 Permalink
Water SA
versión On-line ISSN 1816-7950
versión impresa ISSN 0378-4738
Water SA vol.39 no.1 Pretoria ene. 2013
Trihalomethanes in drinking water: effect of natural organic matter distribution
Shakhawat Chowdhury*
Department of Civil and Environmental Engineering, King Fahd University of Petroleum and Minerals (KFUPM), Dhahran, Saudi Arabia
ABSTRACT
Effects of distribution of natural organic matter (NOM) on formation and distribution of trihalomethanes (THMs) in municipal water were investigated. Water samples were fractionated using serial ultrafiltration with membranes of molecular weight cut-off (MWCO) values of 500, 1 000 and 3 000 Da. The resulting 4 fractions of water with NOM of (i) < 500 Da; (ii) 500 Da - 1 kDa; (iii) 1 kDa - 3 kDa; and (iv) > 3 kDa were separated. Variable amounts of bromide ion (0, 40, 80, 120 and 200 µg/l were added to these samples. The samples were chlorinated at pH of 6 and 8.5 and held at 20°C for various reaction periods (3, 8, 28, 48 and 96 h). The results demonstrate that the higher molecular weight NOM is strongly correlated with UV254 and specific ultraviolet absorbance (SUVA), while the lower molecular weight NOM is weakly correlated with UV254 and SUVA. Increase in bromide ion concentration increases total THM formation. Fractions of brominated THMs decrease with increasing NOM molecular size. Lower molecular weight NOM forms more brominated THMs than the corresponding higher molecular weight NOM. Increase of bromide to chlorine ratio decreases chloroform and increases brominated THMs. Increase in pH increases chloroform and decreases brominated THMs. This study demonstrates that the distribution of NOM and bromide ion can have important role on the distribution of THMs in drinking water.
Keywords: bromide ion, molecular weight distribution, natural organic matter, trihalomethane distribution
Introduction
The natural organic matter (NOM) and/or other inorganic substances in water react with chlorine and other disinfectants to produce disinfection byproducts (DBPs) in drinking water. Since their discovery in 1974, a number of DBPs, including trihalomethanes (THMs), haloacetic acids (HAAs), halo-acetonitriles (HANs), haloketones (HKs), nitrosamines and iodo-THMs have been investigated. DBPs are of potential concern as some have been noted to have associated cancer risks, as well as other acute and chronic effects on human health (Richardson et al., 2007, 2008; King et al., 2004; Health Canada, 2008; USEPA, 2006, 2009; Krasner et al., 2006). The regulated THMs consist of 4 compounds: chloroform (CHCl3), bromodichloromethane (BDCM), dibromochloromethane (DBCM) and bromoform (CHBr3), some of which might be possible/probable human carcinogens (USEPA, 2009). However, in recent years, non-regulated THMs (e.g., iodo-THMs) have been reported in drinking water. Epidemiological studies have reported that brominated THMs in drinking water have a stronger association with stillbirths, low birth weights and neural tube defects than the chlorinated THMs (King et al., 2000, Dodds and King, 2001). Toxicological studies have characterised brominated THMs as more toxic than their chlorinated counterparts (USEPA, 2009). The brominated THMs, specifically, BDCM, target human placental trophoblasts that produce a hormone, which is required during pregnancy. A decrease in bioactive levels of this hormone can lead to adverse effects during pregnancy (Health Canada, 2007). THMs are regulated in many countries around the world (USEPA, 2006; Health Canada, 2008; WHO, 2008).
NOM is considered to be the main precursor for THM formation, with the molecular weight of NOM in source water typically varying between 500 Da and 5.5 kDa (MWH, 2005). Past studies have reported that differences in molecular weight of NOM can affect the type and distribution of THMs (Liang and singer, 2003; Chowdhury et al., 2010). NOM particles with higher molecular weight are hydrophobic and composed of activated aromatic rings, phenolic hydroxyl groups and conjugated double bonds, while lower molecular weight NOM particles are hydrophilic and composed of aliphatic ketones and alcohols (Liang and Singer, 2003; Hellur-Grossman et al., 2001). The hydrophobic fractions of NOM exhibit higher specific ultraviolet absorbance (SUVA, defined as: 100xUV254/DOC); while the hydrophilic fractions of NOM exhibit lower SUVA (Liang and Singer, 2003; Hellur-Grossman et al., 2001; Chowdhury et al., 2010). The nature and molecular weight distributions of NOM largely depend on the sources and biogeochemical processes associated with carbon recycling in terrestrial and aquatic systems (Uyak and Toroz, 2007). Past studies have reported that NOM with higher molecular weight might be more reactive with chlorine, while NOM with lower molecular weight may be more reactive with bromide (Liang and Singer, 2003).
Natural water often contains bromide ions, while chlorina-tion of bromide-containing waters can alter the reaction process and increases the fractions of brominated THMs in drinking water (Liang and Singer, 2003; Hellur-Grossman et al., 2001). An increase in brominated THMs can be attributed to the reactions of HOBr with lower molecular weight NOM and/ or a shift of chlorinated THMs to brominated THMs (Uyak and Toroz, 2007; Chowdhury et al., 2010). Several factors, including bromide to chlorine ratio, pH, temperature and relative distribution of lower and hi her molecular weight NOM, can influence THM formation (Sohn et al., 2006). However, a small fraction of bromide ions (typically 18-28%) are converted to brominated THMs during water treatment and disinfection process (Sohn et al., 2006). This partial conversion of bromide into brominated THMs adds further difficulties to assessing THM distribution in bromide-rich source water. Further to this, it has been reported that complete removal of low molecular weight NOM through available treatment processes is rarely possible (Liang and singer, 2003). Consequently, low molecular weight NOM tends to remain in finished water. As such, it is likely that brominated THMs will be present in the bromide-rich water. In this study, effects of different fractions of NOM on THM distributions were investigated. Implications of bromide ions and different fractions of NOM on THM distributions were explained. Relationships between DOC, UV254 and SUVA were investigated for various fractions of NOM. Conversion of bromide to brominated THMs was investigated.
Experimental methods
Experiments were conducted on synthetic water prepared in the laboratory using the Suwannee River humic acid (HA). Concentrated stock solution was prepared by dissolving HA into 0.1 N NaOH solutions. The stock solution was used in deionised water to generate water samples with dissolved organic carbon (DOC) concentrations of 2.0, 4.0 and 6.0 mg/l. Samples were filtered using 0.45 µπι filter paper (Aldrich Z277347) to remove suspended particulates. This water was subjected to serial ultrafiltration using membranes of molecular weight cut-off (MWCO) values of 3 kDa, 1 kDa and 500 Da. (Sigma-Aldrich Cellulosic disk: MWCO: 500 Da, 1 kDa and 3 kDa; parts number Z368024, Z355119, Z355143). The schematic of NOM separation is presented in Fig. 1. The resulting 3 retentates (molecular weight > 3 kDa, 1 kDa - 3 kDa, and 500 Da - 1 kDa) were isolated and dissolved separately in the same amount of deionised water that was used for the ultrafiltration experiments (Fig. 1). Including the 4th fraction (molecular weight < 500 Da in Fig. 1), a total of 4 types of water samples were generated (molecular weight < 500 Da, 500 Da - 1 kDa, 1 kDa - 3 kDa, and molecular weight > 3 kDa). The DOC and ultraviolet absorbance (UV254) were measured using Standard Method 5310B (APHA, 1995) and a Biochrom Ultrospec 1000 UV/Visible Spectrophotometer, respectively. The specific ultraviolet absorbance (SUVA) was calculated as: 100 µg/l DOC. The pH of the water samples were adjusted to 6 and 8.5. Variable amounts of bromide ions (0, 40, 80, 120 and 200 µg/l) were added to these samples. Bromide ion stock solution of 100 µg/mt was prepared by diluting Sigma-Aldrich bromide standard (Catalog no. 17355) with deionised water. A fixed dose of chlorine (2.0 mg/l) was applied to each of the fractionated and pH-adjusted samples. Chlorine stock solution of 5 mg Cl2/mt was prepared using a 5% aqueous sodium hypochlorite solution following Standard Method 5710B (APHA, 1995). All stock solutions were stored in a refrigerator at 2 ± 0.1°C and discarded after 7 days. Reactions were performed in a water bath at 20°C, for various reaction times (3, 8, 28, 48 and 96 h). Free residual chlorine (FRC) and total chlorine (TC) were measured for these samples after their corresponding reaction periods. The FRC were obtained in the range of 0.15-1.6 mg/l for these samples, indicating that all samples had adequate FRC to form THMs till the end of their reaction periods. THMs were measured using GC/MS (Varian chromatograph, model 3900 equipped with quadrupole mass spectrometer) following USEPA 524.2 method (USEPA, 1992). The calibration standards and quality control samples were used in each group of samples to confirm the analytical results. Samples were analysed in duplicate and results within 10% variability were accepted. The detection limit of the GC/MS was 2 µg/l at 95% probability of detection.
Results and discussion
Distribution of DOC, UV254 and SUVA
To assess the relative distributions of molecular weight of NOM, 3 types of samples were prepared, with DOC of 2.0, 4.0 and 6.0 mg/l, replicating the typical ranges of DOC found in the source water (MOE, 2007; WHO, 2004; USEPA, 2006). Relative distributions of DOC corresponding to the fractions of NOM are shown in Table 1.
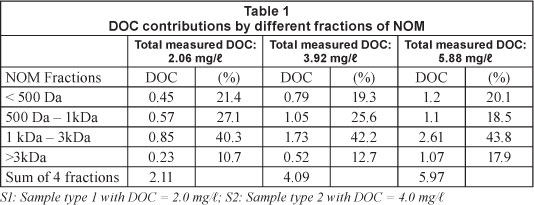
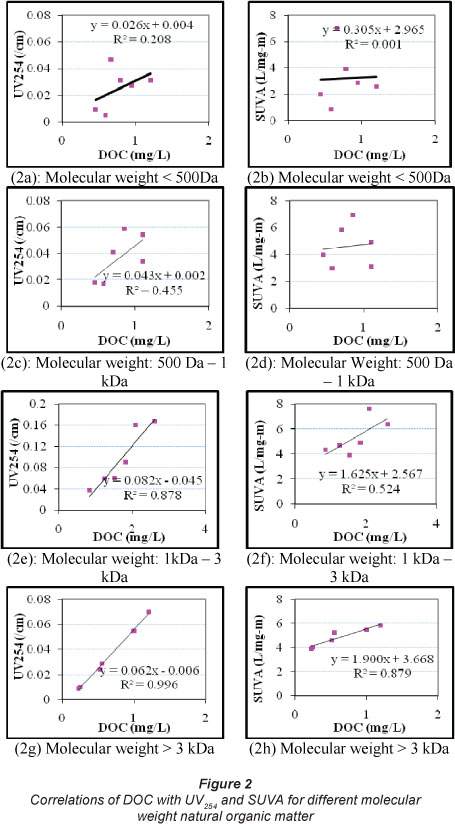
Approximately 10.7-17.9% of DOC is attributed to NOM with molecular weight of > 3 kDa. The largest fraction of DOC was associated with 1 kDa - 3 kDa molecular weight NOM (40.3-43.8%) followed by 500 Da - 1 kDa molecular weight (18.5-27.1%). NOM with a molecular weight of less than 500 Da contributed 19.3-21.4% of the total DOC. Based on the experiments, 38.6-48.5% of the DOC was contributed by the NOM having molecular weight < 1 kDa (Table 1). The correlations between DOC, UV254 and SUVA for different fractions of NOM are presented in Fig. 2. Strong correlations between DOC and UV254 were observed for molecular weight > 1 kDa (R2 = 0.88 and 0.996), while weak correlations (R2 = 0.21 and 0.46) were observed for molecular weight < 1 kDa (Fig. 2). The weakest correlation was observed for molecular weight < 500 Da (R2 = 0.21), while the best correlation was found for molecular weight > 3 kDa (R2 = 0.996). Similar correlations (strong correlation for molecular weight > 1 kDa and weak correlation for molecular weight < 1 kDa) between DOC and SUVA were observed. For example, the weakest correlation between DOC and SUVA was observed for molecular weight < 500 Da (R2 = 0.001), while the strongest correlation was found for molecular weight > 3 kDa (R2 = 0.88). In both UV254 and SUVA, R2 values increased with the increase in the molecular weight of NOM (Fig. 2). The findings demonstrate that UV254 or SUVA may not effectively characterise DOC associated with low molecular weight NOM, while a significant fraction of DOC (38.6-48.5%) can be contributed by the low molecular weight NOM (molecular weight < 1kDa) in these samples.
Effects of molecular weight distribution on brominated THM formation
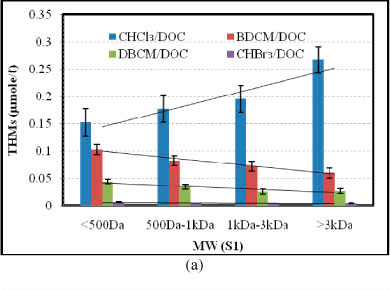
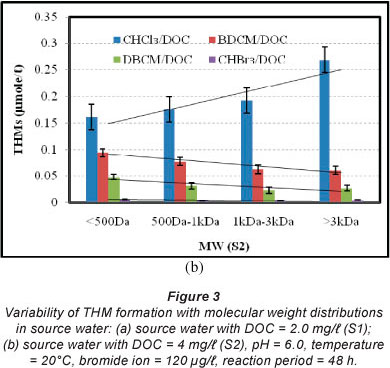
The rate of THM formation (CHCl3, BDCM, DBCM and CHBr3) was investigated for S1 (samples with total DOC of 2.0 mg/l) and S2 (samples with total DOC of 4.0 mg/l) with varying concentrations of bromide ion (0, 40, 80, 120 and 200 µg/l) for different reaction periods (3, 8, 28, 48 and 96 h). Figure 3 shows the formation rates of CHCl3, BDCM, DBCM and CHBr3 per unit of DOC for S1 and S2 samples with 120 µg/l bromide ion for a reaction period of 48 h. Formation of CHCl3 increases with the increase in molecular weight of NOM. The higher molecular weight NOM (molecular weight > 3 kDa) formed approximately 67-75% more CHCl3 than the lower molecular weight NOM (molecular weight < 500 Da) (Fig. 3). For example, in the case of S1, 0.153 µmol/lCHCl3 was formed per unit of DOC for molecular weight < 500 Da, while 0.178, 0.195 and 0.267 µmol/l CHCl3 was formed per unit of DOC for molecular weights of 500 Da - 1 kDa, 1 kDa - 3 kDa and > 3 kDa, respectively (Fig. 3a). However, a different pattern was observed in the formation of brominated THMs, more specifically, in BDCM and DBCM formation. Formation rates of BDCM decreased with the increase in molecular weight of NOM. The NOM with molecular weight > 3 kDa formed approximately 35-42% and 40-43% less BDCM and DBCM, respectively, than the NOM with molecular weight < 500 Da in S1 and S2 samples (Fig. 3). For example, in S2, 0.094 µmol/l BDCM was formed per unit of DOC at molecular weight < 500 Da, while 0.077, 0.063 and 0.061 µmol/l BDCM was formed per unit of DOC at molecular weight of 500 Da - 1 kDa, 1 kDa - 3 kDa and > 3 kDa, respectively (Fig. 3b). In the case of DBCM, 0.048 µmol/l was formed per unit of DOC for molecular weight < 500 Da, while 0.031, 0.023 and 0.027 µmol/l was formed per unit of DOC for molecular weight of 500 Da - 1 kDa, 1 kDa - 3 kDa and > 3 kDa, respectively (Fig. 3b). This phenomenon might be explained by the higher reactivity of lower molecular weight NOM with bromide ions than the corresponding chloride ions. Overall, the sum of CHCl3, BDCM, DBCM and CHBr3 was higher for the higher molecular weight NOM than the lower molecular weight NOM. For example, 0.305 and 0.310 µmol/l THMs were formed in the S1 and S2 samples with molecular weight < 500 Da. For the S1 and S2 samples with molecular weight > 3 kDa, the total concentration of THMs formed was 0.357 and 0.362 µmol/l, respectively. The increase in total THMs was mainly due to higher rates of CHCl3 formation with the increase in molecular weight compared to the corresponding decrease in the formation of bromi- nated THMs.
Effects of pH on THM formation for different fractions of NOM
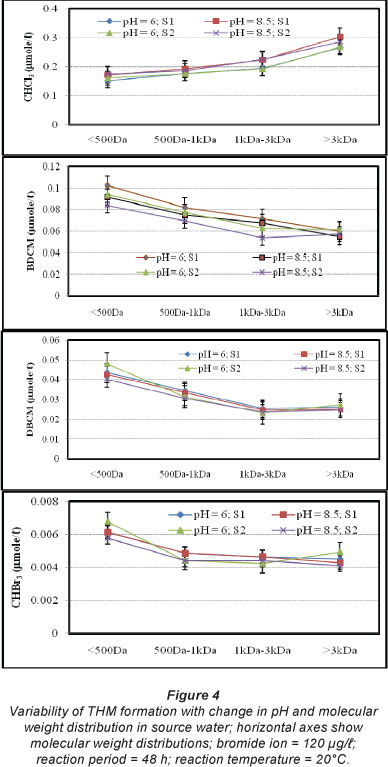
The effects of pH on CHCl3, BDCM, DBCM and CHBr3 formation were investigated for S1 and S2 using 2 pH values (6.0 and 8.5) for various reaction periods and bromide ion concentrations. Formation of CHCl3 was increased with the increase in pH for different molecular weights of NOM. For S1 with molecular weight < 500 Da, CHCl3 formation increased from 0.153 µmol/l to 0.172 µmol/l when pH was increased from 6 to 8.5 (Fig. 4). Similar trends were observed for the higher molecular weight NOM (e.g., in S1 with molecular weight > 3 kDa, CHCl3 formation increased from 0.267 µmol/l to 0.304 µ when pH was increased from 6 to 8.5). Rate of CHCl3 formation was higher for higher molecular weight NOM than the lower molecular weight NOM (e.g., in S2 at pH 6, rate of CHCl3 formation per unit DOC was increased from 0.161 µmol/l to 0.267 µmol/l due to the change in molecular weight from < 500 Da to molecular weight > 3 kDa (Fig. 4). However, formation of brominated THMs (BDCM, DBCM and CHBr3) showed a different pattern with the increase in pH. BDCM, DBCM and CHBr3 were found to decrease with an increase in pH value from 6.0 to 8.5. For S2 with molecular weight < 500 Da, BDCM formation decreased from 0.094 µmol/l to 0.084 µmol/l when pH was increased from 6 to 8.5 (Fig. 4). Similar trends were observed for the higher molecular weight NOM as well (e.g., in S2 with molecular weight > 3 kDa, BDCM formation decreased from 0.061 µmol/l to 0.057 µmol/l when pH was increased from 6 to 8.5). At the same pH, decreased formation of BDCM was observed for the higher molecular weight NOM (e.g., in S2 at pH 6, rate of BDCM formation per unit DOC was decreased from 0.094 µmol/l to 0.061 µmol/l due to the change in molecular weight from < 500 Da to molecular weight > 3 kDa) (Fig. 4). Rate of formation of DBCM was also found to decrease when pH was increased from 6.0 to 8.5. For S2 with molecular weight < 500 Da, DBCM formation decreased from 0.048 µmol/l to 0.041 µmol/l when pH was increased from 6 to 8.5 (Fig. 4). Similar results were observed for the other molecular weight fractions of of NOM (Fig. 4). Further to this, increase in molecular weight resulted in a reduced rate of DBCM formation in most of the samples (Fig. 4). A consistent trend was observed for CHBr3 formation (Fig. 4). Past studies have reported variability in brominated THM formation with increase in pH (Chowdhury et al., 2010). Overall, rate of formation of CHCl3 increased with an increase in pH and molecular weight of NOM, while the rates of formation of brominated THMs (BDCM, DBCM and CHBr3) decreased with an increase in pH and molecular weight of NOM.
Effects of bromide ion to chlorine ratio (r) on THM formation
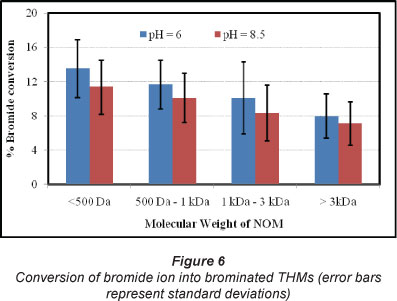
Effects of bromide ion to chlorine ratio were investigated for the reaction periods of 3, 8, 28, 48 and 96 h, for all molecular weight fractions of NOM. Various concentrations of bromide ion (0, 40, 80, 120 and 200 µg/l) were used, while a fixed amount of chlorine (2.0 mg/l) was applied to each sample. Figure 5 shows the effects for the reaction periods of 28 and 96 h (Figs. 5a and 5b, respectively) for NOM with molecular weight 1-3 kDa. Formation of THMs (sum of CHCl3, BDCM, DBCM and CHBr3) increases with the increase in bromide ion to chlorine ratio (r). In the 28-h reaction period, the sum of the molar concentration of THMs increased from 0.194 µmol/l to 0.236 µmol/l when r was increased from 0 to 100. Under the same conditions, the 96-h reaction period gave similar results (the sum of the molar concentration of THMs increased from 0.218 µmol/l to 0.271 µmol/l). The increase in the sum of the molar concentration of THMs due to the increase in bromide ion to chlorine ratio indicates that there might be additional reactions in addition to the substitution of chloride (lighter atom) by the bromide ion (heavier atom). Chowdhury et al. (2010) reported that reaction of bromide ions with the lower molecular weight NOM might be a potential pathway for producing such additional molar concentration of THMs. However, further study is warranted to enable better understanding of the combined effects of molecular fractions of NOM and bromide to chlorine ratio.
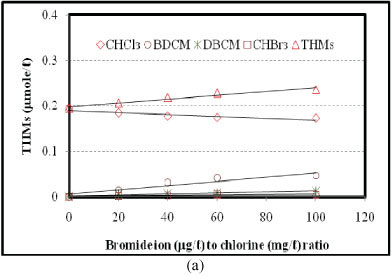
Formation of CHCl3 decreases with the increase in r. In the 28-h reaction period, CHCl3 formation decreased from 0.194 µmol/l to 0.172 µmol/l (11.2%) while r was increased from 0 to 100. In the case of the 96-h reaction period, CHCl3 formation was decreased from 0.218 µmol/l to 0.191 µmol/l (12.1%) under similar conditions. For 3, 8 and 48 h reaction periods, the rates of decrease of CHCl3 formation were 9.4%, 8.0% and 12.4%, respectively, under similar conditions. Formation of BDCM increases with an increase in r. For the 28-h reaction period, BDCM formation was increased from 0.015 µmol/l to 0.047 µmol/l when r was increased from 20 to 100. For the 96-h reaction period, BDCM formation was increased from 0.024 µmol/l to 0.058 µmol/l. In the 3-, 8- and 48-h reaction periods, formation of BDCM was also increased (not shown), under similar conditions. Formation of DBCM increases with an increase in r. For the 28-h reaction period, DBCM formation was increased from 0.0054 µmol/l to 0.012 µmol/l when r was increased from 20 to 100. For the 96-h reaction period, DBCM formation was increased from 0.008 µmol/l to 0.0153 µmol/l. For the 3-, 8- and 48-h reaction periods, formation of DBCM was also increased (not shown) under similar conditions. A similar trend was observed in the formation of CHBr3 (Fig. 5). Overall, an increase in the ratio of bromide ion to chlorine decreases CHCl3 and increases BDCM, DBCM and CHBr3. Total THMs was also increased, possibly due to higher rates of reactions with the lower molecular weight NOM.
Conversion of bromide ion to brominated THMs
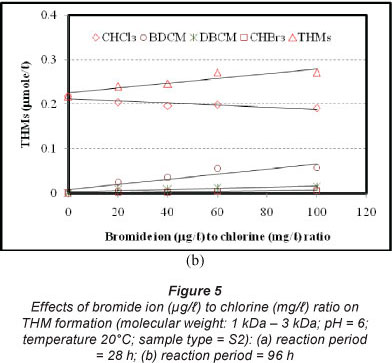
Conversion of bromide ion to brominated THMs (BDCM, DBCM and CHBr3) was investigated for different fractions of NOM. Figure 6 shows the average percentage of bromide ions converted to brominated THMs. For the samples with low molecular weight (molecular weight < 500 Da) and pH of 6, 13.6% (range: 6.7-19.8%) of bromide ions were converted to brominated THMs, while decreased rates of conversion were observed with an increase in the molecular weight of NOM (Fig. 6). For NOM with high molecular weight (molecular weight > 3 kDa) at pH 6, 8.1°% of the bromide ions were converted to brominated THMs. Increase in pH reduced the conversion of bromide ions. For the samples with low molecular weight (molecular weight < 500 Da) and pH of 8.5, 11.4% (range: 5.4-15.6%) of the bromide ion was converted into brominated THMs. On average, increasing pH from 6.0 to 8.5 reduced the conversion of bromide ion by 11.1-17.8% (Fig. 6). It should be noted that the rate of conversion of bromide ions to brominated THMs were not significantly different between the consecutive groups (Mann-Whitney test; p > 0.10). However, when the first group (mo1ecu1ar weight < 500 Da) was compared to the last group (molecular weight > 3 kDa), the differences were found to be significant (Mann-Whitney test; p < 0.05) for both pH values (Fig. 6). Past studies have reported that the conversion of bromide ion to brominated THMs depends on pH and temperature (Sohn et al., 2006; Liang and Singer, 2003). Sohn et al. (2006) reported 18%-28% conversion of bromide ion to brominated THMs, which is higher than that observed in this study. This may be due to differences in the distribution of NOM in the source water. Further to this, the water samples used by Sohn et al. (2006) had very high DOC values in comparison to the current study, which may also have affected the conversion of bromide ions. Based on the findings of this study, it can be argued that only a small fraction of the available bromide ions will be converted into brominated THMs during the treatment and disinfection process. The role of the remaining fraction of bromide ions needs to be investigated further in future research.
This study demonstrates that low molecular weight NOM (molecular weight < 500 Da) may contribute significant fractions of DOC, but may not be adequately represented by UV254 or SUVA values. Hellur-Grossman et al. (2001) reported similar findings from the Sea of Galilee in Israel where UV254 and SUVA values could not effectively be employed to characterise the hydrophilic fractions of NOM. The reactivity of low molecular weight NOM with bromide was found to be relatively higher than for high molecular weight NOM. Some previous studies have demonstrated similar findings (Hellur-Grossman et al., 2001; Uyak and Toroz, 2007). Employment of UV254 or SUVA for predicting the occurrence of brominated THMs in water with hydrophilic NOM may require further attention. Increase in bromide ion to chlorine ratio increases brominated and total THMs and decreases CHCl3 on both a molecular and mass basis. The increase in molecular terms might be due to higher reactivity of bromide ion with the lower molecular weight NOM (Chowdhury et al., 2010). In addition, an increased bromide to chlorine ratio increases hypobromous acid (HOBr) formation, which is more reactive with NOM than the hypochlorous acid (HOCl) in chlorinated water. Increase in bromide ion causes a gradual shift from chlorinated THMs to mixed bromochloro THMs (Uyak and Toroz, 2007). Regulatory agencies around the world limit the sum of 4 THMs (CHCl3, BDCM, DBCM and CHBr3) in drinking water (e.g., USEPA: 80 µg/l; Hearth Canada: 100 µg/l). Managers of water supply systems might consider reducing pH to reduce CHCl3. However, this must be carefully attended for water with high levels of bromide ion. Further investigation may be required to understand the implications of altering pH on different species of THMs, HAAs and other DBPs, for source water containing bromide ions. A1ternatively, additiona! regu!ation on specific DBPs might provide better protection of human health. This study also demonstrated that only a fraction of available bromide ion is converted into brominated THMs. The highest fractions (13.6%) of bromide ions was converted into brominated THMs in the low molecular weight NOM (molecular weight < 500 Da) samples. In case of higher molecular weight NOM, this conversion was much lower (8.0%). Increasing pH decreased the conversion of bromide ion into brominated THMs significantly (11%-18%), resulting in tower formation of brominated THMs.
Conclusions
This study investigated the effects of molecular weight distributions of NOM in source water, bromide ion, pH, bromide to chlorine ratio and conversion of bromide ion into brominated THMs on the formation and distribution of THMs in municipal supply water. The findings provide an understanding of the complexity of the formation and distribution of THMs in source waters containing bromide ions. As such, effects of some factors were explained without the influence of external factors. However, the findings of this study are limited, as this was not a field study, where different factors (e.g., pH, temperature, DOC, etc.) can vary simultaneously resulting in interaction effects. Future studies should look at the interaction effects of these factors. The effects of pH on the formation and distribution of different species of DBPs requires further investigation. Despite the limitations, this study provides insights into the formation and distribution of brominated THMs in bromide-rich source water, which can be beneficial in controlling the formation of brominated DBPs in drinking water.
Acknowledgments
The author would like to acknowledge the support provided by King Abdulaziz City for Science and Technology (KACST) through the Science & Technology Unit at King Fahd University of Petroleum & Minerals (KFUPM), funding this work through Project No. 10-WAT1398-04 as part of the National Science, Technology and Innovation Plan
References
APHA (AMERICAN PUBLIC HEALTH ASSOCIATION), AWWA (AMERICAN WATER WORKS ASSOCIATION) and WEF (WATER ENVIRONMENT FEDERATION) (1995) Standard Methods for the Examination of Water and Wastewater (19th edn.). APHA, Washington DC. [ Links ]
CHOWDHURY S, CHAMPAGNE P and McLELLAN PJ (2010) Investigating effects of bromide ions on trihalomethanes and developing model for predicting bromodichloromethane in drinking water. Water Res. 44 (7) 2349-2359. [ Links ]
DODDS L and KING WD (2001) Relation between trihalomethane compounds and birth defects. Occup. Environ. Med. 58 443-446. [ Links ]
HEALTH CANADA (2007) Guidelines for Canadian Drinking Water Quality. Prepared by the Federal-Provincial-Territorial Committee on Health and the Environment, March 2007. Health Canada, Ottawa. [ Links ]
HEALTH CANADA (2008) Guidelines for Canadian Drinking Water Quality. Prepared by the Federal-Provincial-Territorial Committee on Health and the Environment, March 2008. Health Canada, Ottawa. [ Links ]
HELLUR-GROSSMAN L, MANKA J, LAMONI-RELIS B and REBHUN M (2001) THM, haloacetic acids and other organic DBPs formation in disinfect ion of bromide rich Sea of Galilee (Lake Kinneret) water. Water Sci. Technol.: Water Supply 1 (2) 259-266. [ Links ]
KING WD, DODDS L and ALLEN AC (2000) Relation between stillbirths and specific ch1orinated byproducts in pub1ic water supp1ies. Environ. Health Perspect. 108 (9) 883-886. [ Links ]
KING WD, DODDS L and ARMSON BA (2004) Exposure assessment in epidemiologic studies of adverse pregnancy outcomes and disinfection byproducts. J. Exp. Anal. Environ. Epidemiol. 14 466-472. [ Links ]
KRASNER SW, WEINBERG HS, RICHARDSON SD, PASTOR SJ, CHINN R, SCLIMENTI MJ, ONSTAD GD and THRUSTON AD JR (2006) Occurrences of a new generation of disinfection byproducts. Environ. Sci. Technol. 40 (23) 7175-7185. [ Links ]
LIANG L and SINGER PC (2003) Factors influencing the formation and relative distribution of haloacetic acids and trihalomethanes in drinking waters. Environ. Sci. Technol. 37 2920-2928. [ Links ]
MOE (MINISTRY OF ENVIRONMENT, ONTARIO, CANADA) (2007) Drinking Water Surveillance Program (DWSP) monitoring data for 2000-2004 on 179 municipal water supply systems in Ontario, 2006. URL: http://www.ene.gov.on.ca/envision/water/dwsp/0002/index.htm. (Accessed March 2007). [ Links ]
MOLECULAR WEIGHTS (MONTGOMERY WATSON HARZA) (2005) Water Treatment: Principles and Design. John Wiley & Sons, NJ. [ Links ]
RICHARDSON SD, PLEWA MJ, WAGNER ED, SCHOENY R and DEMARINI DM (2007) Occurrence, genotoxicity, and carcino-genicity of regulated and emerging disinfection by-products in drinking water: A review and roadmap for research. Mutat. Res. 636 178-242. [ Links ]
RICHARDSON SD, FASANO F, ELLINGTON JJ, CRUMLEY FG, BUETTNER KM, EVANS JJ, BLOUNT BC, SILVA LK, WAITE TJ, LUTHER GW, MCKAGUE AB, MILTNER RJ, WAGNER ED and PLEWA PJ (2008) Occurrences and mammalian cell toxicity of iodinated disinfection byproducts in drinking water. Environ. Sci. Technol. 42 (22) 8330-8338. [ Links ]
SOHN J, AMY G, CHO J and YOON Y (2006) Bromide ion incorporation into brominated disinfection by-products. Water Air Soil Pollut. 174 265-277. [ Links ]
USEPA (UNITED STATES ENVIRONMENTAL PROTECTION AGENCY) (1992) Method 524.2: Measurement of purgeable organic compounds in water by capillary column gas chromatog-raphy/mass spectrometry. Revision 4.0. USEPA, Cincinnati, Ohio, USA. [ Links ]
USEPA (UNITED STATES ENVIRONMENTAL PROTECTION AGENCY) (2006) National Primary Drinking Water Regulations: Stage 2 Disinfectants and Disinfection Byproducts Rule: Final Rule. Federal Register 71 (2) Jan. 4. [ Links ]
USEPA (US ENVIRONMENTAL PROTECTION AGENCY) (2009) IRIS (Integrated Risk Information System). Online database. URL: http://www.epa.gov/iris/subst/index.html. (Accessed 18 December 2009). USEPA, Washington DC. [ Links ]
UYAK V and TOROZ I (2007) Investigation of bromide ion effects on disinfection by-products formation and speciation in an Istanbul water supply. J. Hazardous Mater. 149 445-451. [ Links ]
WHO (WORLD HEALTH ORGANIZATION) (2008) Guidelines for Drinking-Water Quality (3rd edn.) Vol. 1. WHO, Geneva. [ Links ]
Received 23 February 2012;
Accepted in revised form 12 November 2012.
* To whom all correspondence should be addressed. ffi +966-3-860-2560; fax: +966-3-860-2879; e-mail: SChowdhury@kfupm.edu.sa

