


Services on Demand
Article
 English (pdf)
 Article in xml format
 Article references
Indicators

Related links
-
 Cited by Google
 -
 Similars in Google
Share

 Permalink
Water SA
On-line version ISSN 1816-7950
Print version ISSN 0378-4738
Water SA vol.38 n.5 Pretoria Jan. 2012
SHORT COMMUNICATION
Rapid in vitro tests to determine the toxicity of raw wastewater and treated sewage effluents
Rahzia Hendricks; Edmund John Pool*
Department of Medical Bioscience, University of the Western Cape, Private Bag X 17, Bellville, 7535, Republic of South Africa
ABSTRACT
Wastewater consists of a complex mixture of substances. During wastewater treatment these harmful substances can be eliminated or degraded. However, persistent compounds released with the treated sewage effluents enter the environment and pose a risk to animal and human life. To determine the potential risks involved, screening tests are needed to monitor wastewater for potential toxic contaminants. The aim of this study was to validate and use screening tests to determine the toxicity of raw wastewater and treated sewage effluents from 3 sewage treatment plants in the Western Cape, South Africa. Raw wastewater and treated sewage effluents were screened for cytotoxicity using lactate dehydrogenase (LDH) release from cells as biomarker, for neurotoxicity using acetylcholinesterase (AChE) inhibition and for genotoxicity using the Save Our Soul (SOS) test. Results showed no cytotoxicity for both raw wastewater and treated sewage effluents from all sewage treatment plants. Raw wastewater from all sewage treatment plants contained AChE inhibitors and sewage treatment processes were not effective at eliminating these AChE inhibitors. Raw wastewater from all sewage treatment plants tested positive for genotoxicity. Treated sewage effluents from all three sewage treatment plants displayed no genotoxicity indicating effective removal of genotoxins by all three sewage treatment plants investigated.
Keywords: Lactate dehydrogenase, acetylcholinesterase, toxicity, genotoxicity, sewage effluents, biomarker
Introduction
Pollutants and untreated industrial effluents can pose a major risk to the environment and aquatic life. Many of these pollutants are persistent in the environment and are not readily biodegraded (Wepener et al., 2001; Yadav et al., 2009).
Lactate dehydrogenase (LDH) release from cells is extensively used as a biomarker for necrosis or oncotic cell death (Kendig and Tarloff, 2007; Valentovic and Ball, 1998). Upon toxic injury to cells, the membrane integrity is impaired. Intracellular LDH then leaches into the incubation medium and can be monitored as a biomarker of cell damage (Sepp et al., 1996; Kendig and Tarloff, 2007). Several studies have used LDH release as a method to determine cytotoxicity of chlorinated drinking water and treated sewage effluents.
Acetylcholinesterase (AChE) has been used as a biomarker to determine neurotoxic contaminants in the aquatic environment (Yadav et al., 2009). AChE is the enzyme that catalyses the hydrolysis of the neurotransmitter acetylcholine, to form choline and acetic acid (Sakar et al., 2006). Many natural toxins and man-made poisons play a part in neurotoxicity by inhibiting the enzyme AChE (Yadav et al., 2009). These pollutants include organophosphates, heavy metals and carbamate insecticides. The inhibition of AChE has been extensively used to determine exposure to anticholinesterase agents (Menezes et al., 2009). AChE activity has been assessed in various aquatic organisms exposed to fertiliser industry effluents and secondary treated industrial effluents (Ghedira et al., 2009; Wepener et al., 2005; Yadav et al., 2009).
Contaminants in wastewater can potentially be genotoxic and can have adverse effects on human health (Zegura et al., 2009). Genotoxic substances induce deoxyribonucleic acid (DNA) damage and mutations. A set of responses from a group of genes known as the SOS (save our soul) genes has been used to determine genotoxicity (Quillardet and Hofnung, 1985). The SOS chromotest is based on the detection of DNA-damaging agents. It involves incubation of a specially developed Escherichia coli (E. coli) strain (PQ37) with the test substance of concern. If a SOS response occurs, lacZ operon is expressed and is measured photometrically by measuring β-galactosidase (Sundermann et al., 1996). The SOS chromotest has been used to determine the genotoxicity of a variety of chemicals, metal compounds, hospital effluents, and complex environmental extracts (Jolibois et al., 2003; Lantzsch and Gebel, 1997; Mersch-Sundermann et al., 1996; White et al., 1996).
Wastewater consists of a complex mixture of substances. Sewage treatment plant processes are inefficient at eliminating all contaminants from treated effluents. To determine the potential risks to humans and animals, screening tests are needed to monitor wastewater for potential toxic contaminants. Particularly, these have to be easy to use and should not require highly skilled staff. The tests have to be reproducible, cheap and should be able to examine large numbers of samples with the use of minimal reagents (Fuerhacker et al., 2005). The aim of this study was to validate and use screening tests to determine the toxicity of raw wastewater and treated sewage effluents from 3 sewage treatment plants in the Western Cape, South Africa. Toxicity was investigated using LDH inhibition as biomarker for cytotoxicity, AChE inhibition as biomarker for neurotoxicity, and β-galactosidase as biomarker for genotoxicity.
Experimental
Site description and water collection
Raw wastewater and treated sewage effluents were collected from 3 sewage treatment plants in the Western Cape, South Africa. The treatment plants investigated are located on the same river system. Sewage Treatment Plants 1 and 2 use older technologies to treat wastewater. Sewage Treatment Plant 3 has been upgraded and new technologies have been incorporated in the treatment processes. Sewage Treatment Plants 2 and 3 receive domestic effluents only. However, Sewage Treatment Plant 1 receives both domestic (85% flow intake) and industrial raw wastewater (15% flow intake).
A detailed description of sewage treatment technologies for the different sewage treatment plants are as follows. The older technologies used at the sewage treatment plants can be divided into 3 processes, namely:
Primary treatment which includes pre-treatment of raw wastewater by coarse and fine screens for grit removal. This process includes sedimentation tanks to allow the heavier organic particles to settle.
Secondary treatment of raw wastewater using activated sludge. This process involves using aerated biological digestion by bacteria to remove remaining suspended and dissolved material. In addition, nitrification and de-nitrification of wastewater are also used as treatment processes within the sewage treatment plants. Thereafter, the wastewater enters the secondary sedimentation tank to allow separation of the liquid and solid phase. After secondary sedimentation the wastewater enters maturation ponds for further pathogen removal.
Tertiary treatment is the final step in the conventional activated sludge system used by Sewage Treatment Plants 1 and 2. Ultraviolet light (used only at Sewage Treatment Plant 1) or chlorine (used only at Sewage Treatment Plant 2) are the disinfection processes used before the treated sewage effluent enters the receiving waters.
Sewage Treatment Plant 3 uses an additional membrane bio-reactor concurrently with conventional or older treatment technologies. The membrane bioreactor technology consists of microporous membranes. These micro-filtration and ultrafiltration membranes separate liquid and solids.
Water collected from the Eerste River in Jonkershoek, Stellenbosch, South Africa was used as a reference control. This site is situated in the Stellenbosch Mountains and there is no human activity upstream of this site.
Samples were collected in pre-cleaned plastic bottles (1 l) and transported to the laboratory in a portable ice chest at 4°C.
Collection of blood for LDH and AChE assays
Blood was collected from consenting healthy male subjects (20-26 years of age) in line with the South African Ethical Advisory Council. Criteria for blood collection were that donors were not on medication for the month prior to blood collection. Blood was collected by venipuncture using endotoxin-free evacuated blood collection tubes (Greiner Bio One GmBH) containing sodium citrate (3.2%).
Solid phase extraction of raw wastewater and treated sewage effluents for assays
Samples were filtered with filter paper (Munktell, 15 μm, 240 mm) (Lasec, SA) before extraction. Water samples were then subjected to solid phase extractions (SPE) using C-18 columns (Sigma, Aldrich). The SPE columns were conditioned with 2 m£ of Phase B mixture (45% methanol, 40% hexane and 15% propanol), then 2 ml ethanol and lastly 4 ml distilled water. After the washing step, 100 ml of water sample was allowed to run through the columns, respectively. The columns were then dried using a vacuum pump (PALL vacuum pump, LifeSciences, 60 Hz, 1.92 Amperes, 220-240 Volts). The hydrophobic molecules attached to the resin were eluted with 2 m£ of Phase B mixture and dried under a stream of air. The dried eluate was reconstituted with dimethyl sulphoxide (DMSO) to make a 1 000 times concentrated sample stock solution.
Lactate dehydrogenase assay to determine cellular cytotoxicity of raw wastewater and treated sewage effluents
All experiments were performed under sterile conditions in a laminar flow cabinet. For the assay, aliquots (n=8) of raw wastewater and treated sewage effluents were sterilised using a 0.45 μΜ sterile filter (Lasec, S.A.). Samples and controls were added to Eppendorfs (100 μΙ/Eppendorf). Blood was diluted 1:9 with Roswell Park Memorial Institute 1640 (RPMI-1640) medium. The diluted blood was added to samples (900 μl/ Eppendorf). Samples were incubated at 37°C for 24 h. LDH from blood cells released into culture medium was used as a biomarker for cellular toxicity. LDH was measured using a commercially available kit (Biovision, USA). The assay was performed according to the manufacturer's instructions. Briefly, cell-free culture supernatants (10 μl) were transferred into 96-well microtiter plates (Nunc, Apogent, Denmark). For the 100% cytotoxicity standard, a control blood sample cell was lysed with 2 μl of TritonX-100 detergent. Addition of the detergent results in immediate lysis of the blood cells. The sample was mixed and an aliquot of the lysate was diluted with 0.9% saline at a ratio of 1:9. This lysate was used as the 10% cytotoxicity control. A standard curve was constructed using dilutions of this sample. Thereafter, LDH reaction mixture was prepared and 100 μ£ added to all cell free supernatants and standards. The mixture was incubated for 1 h. Optical densities were read at 492 nm at time-zero and after 1 h, using a microtiter plate reader (Thermo Electron, Original Multiskan Ex). Optical densities for the standards were used to construct a standard curve. The cytotoxicity of the samples was read off this curve. Cytotoxicity is expressed as % LDH released ± standard error of the mean (% LDH ± SEM).
Optimisation of the AChE inhibition assay
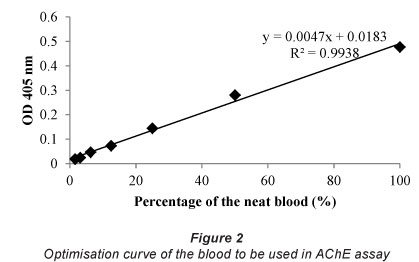
The Ellman method (1961) was validated for the determination of neurotoxicity of sewage effluents. AChE was extracted from human blood. Assays were conducted in 96-well microtiter plates (Nalge Nunc International, Thermo Fisher Scientific, NY, U.S.A.). Freshly-collected blood was diluted with distilled water (1:3) to lyse blood. Thereafter, doubling dilutions of the lysed blood were performed in assay buffer (0.1 mol/l sodium phosphate buffer) and added to all wells of the microplate (50 μl/well). This was followed by the addition of substrate mixture to all wells (50 μΐ/well). The substrate mixture contained 0.075 mol/l Acetylthiocholine iodide (ATI) and 0.01 mol/l 5,5'-Dithio-bis-2-nitrobenzoic acid (DTNB) in assay buffer. The plate was then incubated away from light for 1 h. Optical densities were measured at 405 nm at 5 min intervals during the 1 h incubation period using a microplate reader (Thermo Electron, Original Multiskan Ex). A curve was drawn from the optical densities obtained and the optimal dilution factor of blood to be used in the AChE assay was read off this curve.
Optimisation of positive control (chlorpyrifos) for use in the AChE inhibition assay
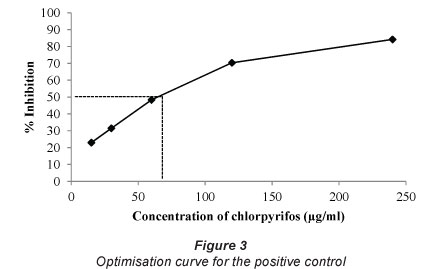
Chlorpyrifos (Efekto, reg. no. L5676) is an organophosphate insecticide that inhibits acetylcholinesterase and was therefore used as a positive control. For the assay, 96-well microtiter plates (Nalge Nunc International, Thermo Fisher Scientific, NY, U.S.A.) were used. The initial concentration of the chlorpyrifos used in the assay was 960 μg/m£. A dilution series of this concentration of chlorpyrifos was prepared in distilled water and then applied to all of the wells (50 μl/well). After this, 25 μl of lysed blood, diluted 1 in 40 in assay buffer, was added to all wells. This was followed by addition of the substrate mixture to all wells (50 μl/well). Optical densities were measured at 405 nm at 5 min intervals during the 1 h incubation period using a microplate reader (Thermo Electron, Original Multiskan Ex). The optical densities were plotted and the curve was used to determine the concentration of chlorpyrifos that should be used in the AChE assay.
Screening of raw wastewater and treated sewage effluents for AChE inhibitors using the validated AChE assay
All assays were performed in 96-well microtiter plates (Nalge Nunc International, Thermo Fisher Scientific, NY, U.S.A.). As a negative control DMSO was diluted 1: 9 (v/v) in assay buffer. As a positive control chlorpyrifos stock (60 μg/ml in DMSO) was diluted 1:7 (v/v) with assay buffer. For the assay, 25 μl/well of the negative and positive controls were added to the microtiter plate, respectively (n=8). Water extracts were diluted 1:9 (v/v) in assay buffer and added to the wells (25 μl/ well). Subsequently, 25 μl of a 1:40 dilution of blood in assay buffer was added to all wells. The plate was then incubated for 2 h. This was followed by the addition of 50 μl of substrate mixture to all wells. Optical densities were measured at 405 nm at 5 min intervals during the 2 h incubation period using a microplate reader (Thermo Electron, Original Multiskan Ex). The inhibition of AChE was calculated as a percentage in terms of the negative control. Data is expressed as percentage AChE inhibition ± standard error of the mean (% AChE inhibition ± SEM).
SOS chromotest to determine genotoxicity of raw wastewater and treated sewage effluent samples
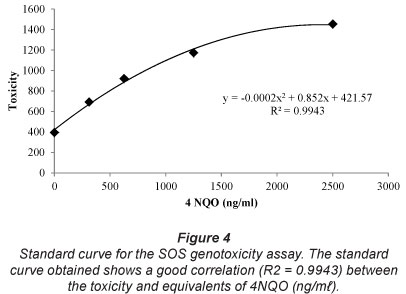
The SOS chromotest was purchased from Environmental Bio Detection Products Incorporated (EBPI), Ontario, Canada. The assay was performed according to the manufacturer's instructions. All reagents were supplied in the kit. Briefly, growth medium was added to the lyophilised bacteria (E.coli PQ37 strain) and incubated for 4-5 h at 37°C. Thereafter, the bacteria grown were tested for turbidity at 600 nm and the bacterial suspension was diluted to give an optical density of 0.05 nm. Raw wastewater and treated sewage effluent extracts were diluted 1/100 in DMSO. Two-fold serial dilutions of the positive control, 4 nitro quinoline oxide (4NQO, 100 ng/m£), in DMSO were prepared. Thereafter, 10 μl of each sample and control was added to a 96-well microtiter plate. Thereafter, 100 μ£ of the bacterial suspension was added to all of the wells of the microtiter plate. The plate was then incubated for 2 h at 37°C, followed by the addition of 100 μl of the substrate solution (β-galactosidase) to all of the wells for 1 h. The colour reaction was then stopped by adding 50 μl of stop solution. Optical densities were then measured at 620 nm and 405 nm using a microplate reader (Thermo Electron, Original Multiskan Ex). Genotoxicity of the samples and standards were calculated by a conversion factor. The conversion factor was calculated by dividing the optical densities of 620 nm and 405 nm. This conversion factor was then used to correct the optical densities of the samples and standards. A standard curve was then constructed using the concentration and toxicity equivalents of the positive control per millilitre. The genotoxicity of raw wastewater and treated sewage effluents were then read off this standard curve. Data is expressed as equivalents of the positive control.
Statistical analysis
One-way analysis of variance (ANOVA) was used to compare results for the different assays, with P<0.050 considered as significant. Statistical analysis was done using SigmaPlot Version 11.
Results
Cytotoxicity assessment of raw wastewater and treated sewage effluents from the three sewage treatment plants using whole blood cultures
The correlation coefficient (R2) for the LDH standard curve is 0.9821 (Fig. 1). The percentage LDH released by the whole blood cultures after incubation with the raw wastewater and treated sewage effluents (Table 1) was extrapolated using the standard curve.
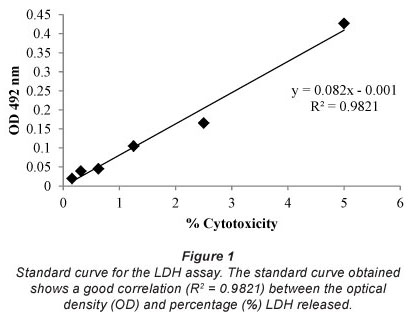
The percentage cytotoxicity of raw wastewater and treated sewage effluents for all sewage treatment plants was significantly lower compared to the positive control (P<0.050). The percentage cytotoxicity induced by raw wastewater, treated sewage and water from the Jonkershoek control site was similar, indicating no cytotoxicity for any of the samples investigated.
Optimisation of blood and chlorpyrifos concentration for AChE assay
The optimisation curve shows that there is a good correlation (R2= 0.9938) between the absorbance and dilution factor for blood (Fig. 2). The dilution factor for the blood selected for future assays is 1/40, since this dilution gives optical densities in the linear region of the assay curve.
The dilution concentration of the positive control selected to use in the AChE assay was 60 μg/ml, since this dilution gives optical densities in the linear region of the inhibition curve (Fig. 3).
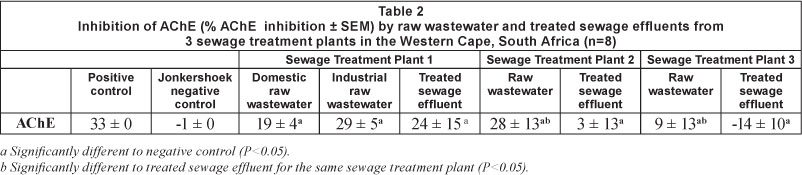
Inhibition of AChE by raw wastewater and treated sewage effluents for the three sewage treatment plants
The AChE inhibition for the domestic, industrial raw wastewater and treated sewage effluents was significantly higher compared to the Jonkershoek reference control (P<0.050) (Table 2). There was no difference in the AChE inhibition of domestic raw wastewater, industrial raw wastewater and treated sewage effluents.
The AChE inhibition of raw wastewater from Sewage Treatment Plant 2 was significantly higher when compared to the Jonkershoek reference control (P<0.050). The AChE inhibition of raw wastewater from Sewage Treatment Plant 2 was significantly higher compared to the treated sewage effluents (P<0.050).
The AChE inhibition of raw wastewater from Sewage Treatment Plant 3 was significantly higher compared to the Jonkershoek reference control (P<0.050). The AChE inhibition of raw wastewater from Sewage Treatment Plant 3 was significantly higher compared to the treated sewage effluents (P<0.050).
Genotoxicity of raw wastewater and treated sewage effluents for the three sewage treatment plants
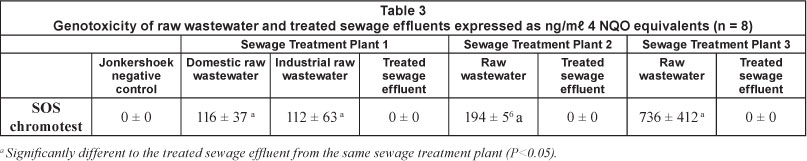
The correlation coefficient (R2) for the standard curve is 0.9943 (Fig. 4). The Jonkershoek reference control sample is not genotoxic (0 ng/m£ ± 0) (Table 3). Genotoxicity equivalents of raw wastewater from all sewage treatment plants were significantly higher than the Jonkershoek reference control sample (P<0.050). The results of the test show that treated sewage effluents from all sewage treatment plants are not genotoxic (0 ng/ml ± 0).
Both the domestic raw and industrial raw wastewater from Sewage Treatment Plant 1 tested positive for genotoxicity (116 ± 37 ng/ml; 112 ± 63 ng/ml, respectively). The genotoxicity equivalents of the domestic and industrial raw wastewater were significantly higher compared to the treated sewage effluents from Sewage Treatment Plant 1 (P<0.050).
Raw wastewater from Sewage Treatment Plant 2 also tested positive for genotoxicity (194 ± 56 ng/ml). The genotoxicity equivalents of raw wastewater were higher compared to the treated sewage effluents from Sewage Treatment Plant 2 (P<0.050). Raw wastewater from Sewage Treatment Plant 3 tested positive for genotoxicity (736 ± 412 ng/ml). The genotoxicity equivalents of raw wastewater were higher compared to treated sewage effluents from Sewage Treatment Plant 3 (P<0.050).
Discussion
The presence of toxic contaminants in raw wastewater and treated sewage effluents can result in the loss of cell membrane integrity and therefore the loss of viable cells. Previous studies have shown cytotoxicity of chlorinated drinking water produced from polluted raw wastewater (Yuan et al., 2005). The cytotoxicity found in these samples was probably due to the nature of the pollutants present in the collected samples and also the higher sample concentrations used (Yuan et al., 2005). The current study showed no cytotoxicity in raw and treated sewage samples. This could be due to the fact that smaller sample volumes were used in the current assay (10 % v/v in the current study as opposed to greater than 10 % v/v in studies showing cytotoxicity).
The AChE from lysed blood is very sensitive to chlorpyrifos inhibition and can thus be used for AChE inhibition assays. Chlorpyrifos at 59 μg/m£ inhibits 50% of AChE activity. Exposure of the freshwater teleost, Channa striatus (Bloch), to fertiliser industry effluents resulted in a significant decrease of AChE activity (Yadav et al., 2009). Studies done on United Kingdom estuaries showed inhibition of flounder fish (Platichthys flesus) muscle AChE activity (Kirby et al., 2000). AChE inhibitors may not necessarily be organophosphates or carbamates but may include other low-level contaminants, such as heavy metals or detergents, present in urban rivers, estuaries and paper mill effluents (Payne et al., 1996). The AChE inhibitors present in treated sewage effluents can have adverse effects on animals and humans (Day and Scott, 1990; Kirby et al., 2000). The current study shows that sewage treatment processes employed at the plants investigated reduced AChE inhibition. However, residual AChE inhibitors are released into the environment by all of the plants indicating that treatment processes are not effective in removing this group of pollutants. The higher level of AChE inhibitors in treated sewage effluents from Sewage Treatment Plants 2 and 3 could potentially be due to chemicals added during the treatment processes.
The SOS chromotest has previously been used to determine genotoxicity of hospital and surface drinking waters (Guzzella et al., 2004; Jolibois et al., 2003). Jolibois et al. (2003) attributes the genotoxicity of hospital wastewater effluents to compounds such as anti-cancer drugs and antibiotics such as ciprofloxacin. The SOS chromotest indicates potential DNA-damaging agents present in the samples. In this study, the SOS chromotest was used to assay raw wastewater and treated sewage effluents from 3 sewage treatment plants for potential genotoxicity. Water from the Jonkershoek reference showed no genotoxicity. This result is expected since the control site is not impacted by human activity. All of the raw wastewater samples assayed tested positive for genotoxicity. The genotoxicity equivalents of raw wastewater from Sewage Treatment Plant 3 were higher than the genotoxicity equivalents of Sewage Treatment Plants 1 and 2. Treated sewage effluents from all sewage treatment plants displayed no genotoxicity indicating effective removal of genotoxins by all three sewage treatment plants investigated.
Conclusion
The current study shows that, although effective in removing some toxicity from sewage, processes currently used at sewage treatment plants do not remove all pollutants. The study showed that although treated effluents tested negative for cytotoxicity and genotoxicity, AChE inhibitors were still present after treatment processes. Data generated by this study confirms earlier reports that specific cellular and biochemical pathways can be modulated by pollutants, without any apparent cytotoxic effects being detected (Ganey et al. 1993).
Since this study only made use of screening assays to determine toxicity, care should be taken when interpreting results. Results of this study could reflect unique characteristics of the analysed samples and may therefore not be a true representation of raw wastewater and treated sewage effluents over an extended period of time. Consequently, additional studies should be performed to determine in vivo effects of raw wastewater and treated sewage effluents. These tests could include a comparative toxicity assessment using a battery of in vivo tests. The reproduction test with the mudsnail, Potamopyrgus antipodarum and the annelid Lumbriculus variegatus toxicity test could be ideal tests to determine biological effects in whole organisms.
Acknowledgements
Financial support from the Water Research Commission and the National Research Foundation is greatly acknowledged. We thank the Scientific Services of Cape Town for their assistance in making this study possible.
References
DAY K and SCOTT I (1990) Use of acetylcholinesterase activity to detect sublethal toxicity in stream invertebrates exposed to low concentrations of organophosphate insecticides. Aquat. Toxicol. 18 101-114. [ Links ]
ELLMAN G, COURTNEY K, ANDRRES V and FEATHERSTONE R (1961) A new and rapid colorimetric determination of acetylcholinesterase activity. Biochem. Pharmacol. 7 88-95. [ Links ]
FUERHACKER M, LEMMENS-GRUBER R and STUDENIK C (2005) Novel screening test to assess the potential environmental toxicity of waste water samples. Environ. Toxicol. Pharmacol. 192 385-388. [ Links ]
GANEY P, SIROIS J, DENISON M, ROBINSON J and ROTH R (1993) Neutrophil function after exposure to polychlorinated biphenyls in vitro. Environ. Health Perspect. 101 430-434. [ Links ]
GHEDIRA J, JEBALI J, BOURAOUI Z, BANNI M, CHOUBA L and BOUSSETTA H (2009) Acute effects of chlorpyrifos-ethyl and secondary treated effluents on acetylcholinesterase and butyrylcholinesterase activities in Carcinus maenas. J. Environ. Sci. 21 1467-1472. [ Links ]
GUZZELLA L, MONARCA S, ZANI C, FERETTI D, ZERBINI I, BUSCHINI A, POLI P, ROSSI C and RICHARDSON S (2004) In vitro potential genotoxic effects of surface drinking water treated with chlorine and alternative disinfectants. Mutat. Res. 564 179-193. [ Links ]
JOLIBOIS B, GUERBET M and VASSAL S (2003) Detection of hospital wastewater genotoxicity with the SOS chromotest and Ames fluctuation test. Chemosphere 51 539-543. [ Links ]
KENDIG D and TARLOFF J (2007) Inactivation of lactate dehydro- genase by several chemicals: Implications for in vitro toxicology studies. Toxicol. In Vitro 21 125-132. [ Links ]
KIRBY M, MORRIS S, HURST M, KIRBY S, NEALL P, TYLOR T and FAGG A (2000) The use of cholinesterase activity in Flounder (Platichthys flesus) muscle tissue as a biomarker of neurotoxic contamination in UK estuaries. Mar Pollut. Bull. 40 (9) 780-791. [ Links ]
LANTZSCH H and GEBEL T (1997) Genotoxicity of selected metal compounds in the SOS chromotest. Mutat. Res. 389 191-197. [ Links ]
MENEZES S, SOARES A, GUILHERMINO L and PECK M (2009) Can the activities of acetylcholinesterase and glutathione S-transferases of Crangon crangon (L.) be used as biomarkers of fuel oil exposure? Water Air Soil Pollut. 208 (1-4) 317-322. [ Links ]
MERSCH-SUNDERMANN V, KLOPMAN G and ROSENKRANZ H (1996) Chemical structure and genotoxicity: studies of the SOS chromotest. Mutat. Res. 340 81-91. [ Links ]
PAYNE J, MATHIEU A, MELVIN W and FANCEY L (1996) Acetylcholinesterase, an old biomarker with a new future? Field trials in association with two urban rivers and a paper mill in Newfoundland. Mar. Pollut. Bull. 32 (2) 225-231. [ Links ]
PFEIFER S, SCHIEDEK D, JOACHIM T and DIPPNER W (2005) Effect of temperature and salinity on acetylcholinesterase activity, a common pollution biomarker, in Mytilus sp. from the south-western Baltic Sea. J. Exp. Mar. Biol. Ecol. 320 93-103. [ Links ]
QUILLARDET P and HOFNUNG M (1985) The SOS Chromotest, a colorimetric bacterial assay for genotoxins: procedures. Mutat. Res. 147 65-78. [ Links ]
SAKAR A, RAY D, SHRIVASTAVA A and SARKER S (2006) Molecular Biomarkers: Their significance and application in marine pollution monitoring. Ecotoxicology 15 333-340. [ Links ]
SEPP A, BINNS R and LECHLER R (1996) Improved protocol for colorimetric detection of complement-mediated cytotoxicity based on the measurement of cytoplasmic lactate dehydrogenase activity. J. Immunol. Methods 196 175-180. [ Links ]
SUNDERMANN V, KLOPMAN G and ROSENKRANTZ H (1996) Chemical structure and genotoxicity: studies of the SOS chromotest. Mutat. Res. 340 81-91. [ Links ]
VALENTOVIC M and BALL J (1998) 2-Aminophenol and 4-amino-phenol toxicity in renal slices from Sprague-Dawley and fisher 344 rats. J Toxicol. Environ. Health Part A 55 225-240. [ Links ]
WEPENER V, VAN VUREN J, CHATIZA F, MBIZI Z, SLABBERT L and MASOLA B (2005) Active biomonitoring in freshwater environments: early warning signals from biomarkers in assessing biological effects of diffuse sources of pollutants. Phys. Chem. Earth 30 751-761. [ Links ]
WEPENER V, VAN VUREN J and DU PREEZ H (2001) Uptake and distribution of a copper, iron and zinc mixture in gill, liver and plasma of a freshwater teleost, Tilapia sparmanii. Water SA 27 (1) 99-108. [ Links ]
WHITE P, RASMUSSEN J and BLAISE C (1996) A semi-automated, microplate version of the SOS Chromotest for the analysis of complex environmental extracts. Mutat. Res. 360 51-74. [ Links ]
YADAV A, GOPESH A, PANDEY R, RAI D and SHARMA B (2009) Acetylcholinesterase: a potential biochemical indicator for bio-monitoring of fertilizer industry effluent in freshwater teleost, Channa striatus. Ecotoxicology 18 325-333. [ Links ]
ZEGURA B, HEATH E, CERNOSA A and FILIPIC M (2009) Combination of in vitro bioassays for the determination of cytotoxic and genotoxic potential of wastewater, surface water and drinking water samples. Chemosphere 75 1453-1460. [ Links ]
Received 7 June 2011; accepted in revised form 18 September 2012.
* To whom all correspondence should be addressed. +27 21 695 3535; fax: +27 21 959 3125; e-mail: epool@uwc.ac.za

