Serviços Personalizados
Artigo
Indicadores
Links relacionados
-
 Citado por Google
 -
 Similares em Google
Compartilhar
Water SA
versão On-line ISSN 1816-7950
versão impressa ISSN 0378-4738
Water SA vol.38 no.5 Pretoria Jan. 2012
A socio-economic impact assessment of a project to identify and implement best management practices at the Zanyokwe Irrigation Scheme at farm level
MC Tshuma*; N Monde
School of Agriculture & Agri-Business, Department of Agricultural Economics & Extension, University of Fort Hare, P. Bag X1314, Alice, 5700, South Africa
ABSTRACT
The main aim of this study was to assess the impact of the Best Management Practices (BMP) project on social and economic wellbeing at the Zanyokwe Irrigation Scheme (ZIS) in central Eastern Cape Province. The BMP project is a knowledge-based initiative aimed at introducing management practices in order to improve production and livelihoods in the study area. The study employed a survey to collect socio-economic data amongst farming households. The 2005 (pre-BMP project) baseline study based on the same respondents allowed for the tracking of changes after the implementation of the project. A socio-economic impact assessment (SEIA) framework was used to assess the impacts. The results showed the BMP project to have impacted on social and economic wellbeing of households. Skills introduced were in the areas of water management, agronomic practices, marketing and institutional arrangements. In 2007 more than half of farmers worked on their farms daily, an improvement on 2005, when none of the farmers reported working over weekends. The average time spent on the farms per day also increased from 4 (in 2005) to 7 h (in 2007). Agriculture's contribution to household income improved from 71% in 2005 to 81% in 2007 and reduced household poverty and food insecurity levels. The number of households earning incomes below the poverty line dropped from 61°% in 2005 to 38% in 2007. A marked increase was noted in winter land use, which was almost non-existent in 2005. The on-farm trials introduced by the BMP team improved the farmers': maize planting time, plant population density, fertiliser management, crop yield and participation in community activities. Seedling transplanting was preferred to direct maize seeding. Positive impacts on institutions were seen in the restructuring of the management system; improved marketing systems; institutional arrangements for managing water; and institutions for maintaining irrigation infrastructure.
Keywords: Small-scale irrigation; livelihoods; best management practices; social and economic impacts, poverty levels, household incomes.
Introduction
Irrigated agriculture in South Africa has a history that goes back as far as the 19th century (Bundy, 1988). However, much has changed as the industry has developed. Some of these changes are a result of various support systems from sources such as Government. By the end of 1999, the Eastern Cape alone had more than 50 small-scale irrigation schemes, run by over 6 350 farmers covering over 9 500 ha of land (Bembridge, 1999). The Eastern Cape is home to at least 15.3% of the nation's total population but has the highest poverty levels in the whole of South Africa, with the majority of households living below the poverty line Statistics SA (2003). These households have also been noted to rely heavily on external economic activities, especially state grants (Fraser et al., 2003, Hebinck et al., 2007). Local economic activities play a minor role in the rural economy. Although agriculture still plays a role in rural households, it makes a modest contribution to household income, and hardly ever constitutes the main rural livelihood activity to secure households' food needs. In Zanyokwe, more than 70% of income is from agricultural activities (both crop and animal production), but about two-thirds of the farming population was still poor in 2005 (Monde et al., 2005).
As a solution to the problem of high poverty levels among the farming households, a number of attempts have been made to revive the Zanyokwe Irrigation Scheme (ZIS). One such effort involved a 12 ha cotton project, which was still in its planning phase at the time of this study and is linked to a private textile company (Da Gamma). There is also a 25 ha paprika project initiated by the Siyakholwa Development Corporation (an NGO) and supported by the South African Government. However, according to Monde et al. (2005), paprika production was discontinued due to excessively low yields that led to low profits. The other development initiative is the Massive Food Program (MFP), a grain project introduced in 2003, mainly to address problems of poverty and hunger, low skills and the grain (mostly maize) trade-deficit, especially in the Eastern Cape, where Neven et al. (2005) have reported that 70% of food was imported in 2001. In spite of these initiatives, farming still had not made a significant change to the lives of the Zanyokwe farmers interviewed during the baseline study conducted in preparation for this impact assessment study. According to Monde et al. (2005), 41% of these farmers have remained in the 'ultra-poor' class. While a number of factors have contributed to this state, one common mistake developers make is to focus on the implementation stage and either ignore or pay little attention to other stages of the project. The Monitoring and Evaluation (M&E) stage is usually not given attention at all. The success of technology or innovation introduced in any community is subject to the social, economic and institutional setup or environment of that particular community. Moreover, the main objective of development is to improve the social and economic well-being of the people targeted for the intervention. It is therefore important to assess the impact in order to ascertain whether this objective is being achieved or not.
In 2004, the University of Fort Hare, in collaboration with the University of Pretoria and Zakhe Agricultural College in KwaZulu-Natal (KZN), introduced a Best Management Practices (BMP) project at ZIS, with funding from the Water Research Commission (WRC). The main goal of the project was to introduce management practices and technologies that would improve the performance of the scheme. The years 2006 and 2007 were dedicated to the testing of technologies to address priority constraints limiting crop production identified by farmers. This paper reports on a study undertaken to analyse the socio-economic impact of the technologies and practices introduced by the BMP team at ZIS.
The main objectives of the impact assessment study were to:
Assess the impact of the BMP project on social status of the farmers at ZIS
Assess the impact of the BMP project on economic status of the farmers at ZIS
Assess the impact of the BMP project on the socio-economic status of the surrounding communities
Methodology
Brief description of study area
The Zanyokwe Irrigation Scheme is located in the Amahlathi Local Municipality, at the foot of the Amatola Mountains, about 30 km west of King William's town in the Eastern Cape Province, South Africa. It is one of the three largest irrigation areas in the upper Keiskamma and Tyume river catchments and occupies 635 ha of land. According to Yokwe (2005), the scheme is made up of 66 individual small farms, ranging in size from 0.5 to 10 ha and directly benefits about 402 households settled around the irrigation scheme. The farms are associated within 6 villages, namely, Zingcuka, Kamma-Furrow, Nqumeya, Zanyokwe, Lenye and the Burnshill settlements. Of the 635 ha of land under the scheme, only 534 ha are irrigated and used for crop production and consist of relatively small plots scattered between lower Nqumeya in the east and Kamma-Furrow in the west. The remaining portion of the land is unused, because the Uvimba Development Bank has not been able to provide credit for inputs and maintenance of the pumping equipment, due to significant budget cuts, as argued by Ntsonto (2005). The scheme is in a semi-arid region with average annual rainfall of 590 mm. Its soils are complex and varied, with a substrate consisting of shale, mudstone and fine-textured sandstone, with dolerite sills and a dyke that cover extensive areas, particularly in the extreme northern and southern sections (Van Averbeke et al. , 1998).
Framework of analysis
This impact study made use of the socio-economic impact assessment (SEIA) framework recommended by the Commonwealth of Australia (2005). The SEIA framework provides a range of options for assessing social and economic impacts and advises on appropriate methods for particular situations. SEIA is a useful tool to help understand a potential range of impacts of a proposed change and the likely response of those impacted if the change occurs (Commonwealth of Australia, 2005). It can be used to assess impacts of a wide range of types of change. The SEIA framework consists of 3 phases, namely, scoping, profiling and assessing the impacts.
Methods of data collection and analysis
A socio-economic survey was used to collect data using a semi-structured questionnaire. Data were collected during November 2007 from 47 farmers. A situation analysis was carried out in 2005 among 68 farmers and for the impact assessment study the aim was to interview the same farmers. However, only 47 of these farmers could be interviewed, as the rest had either relocated or discontinued farming for reasons such as having no access to water.
For the purposes of this study, the unit of analysis was the farming household and consisted of all of the people residing in a single homestead, and sharing resources and activities, whether they were related or not. However, to determine impacts on livelihoods and incomes, household members residing elsewhere but getting a share from the incomes of the rural households were considered in the analysis. This is because dependence on farm income represents another form of expenditure for the farming household.
During the scoping phase, the goals and boundaries of the assessment were established together with the beneficiaries. Community participation at this stage was sought in order to assist in identifying the issues of real concern. The aim of this scoping phase was to determine the following:
Time and resources available for the SEIA
Groups who are potentially impacted
Key impacts of interest
Process and methods to be used for the SEIA
During the profiling stage, the researchers and project participants met with the intention to identify the following issues:
Types of activities to be undertaken, by whom and when
Methods of contacting people, so that they can provide data about potential impacts
Geographical location of groups who may be impacted
Proportion of the group likely to be affected
Direct impacts of a change are felt by those individuals or groups directly engaged in the activity being affected (Common Wealth of Australia, 2005). Direct social and economic impacts may include changes to production output, employment availability, household income, changes to cost of doing business, household food resources, and working conditions, e.g. hours worked, psychological wellbeing and social services. Therefore, in order to assess direct socio-economic impact, data were gathered on those identified as potentially affected by the project over a period of time, to establish a baseline level and rate of change in key variables, as well as the level and nature of potential impacts of the project on those affected.
To determine the project's impact on livelihoods, income and expenditure were used as the main measures, taking the 'adult equivalent' (AE) as a unit of analysis, to provide a more accurate reflection of living standards. As suggested by Shinns and Lyne (2002), the AE value was determined using the following formula:
where:
No. of AE = number of adult equivalents in the household,
No. of adults = number of household members aged 15 years or older,
No. of children = number of household members younger than 15 years old.
The amount of income each AE receives was then measured against the Poverty Datum Line (PDL), defined by Frye (2005) as the required level of personal income matching the monetary value of a set number of items, based on a strict calorific count, the absence of which has been decided by the quantifier as constituting poverty. In this case, the PDL for the year 2000, of R593.00 per capita per month (Statistics SA and National Treasury, 2007), was used to determine if income per AE was enough to meet basic needs. This figure was then adjusted using the relevant consumer price indices (CPIs) to obtain the current PDL value of R720.73, as proposed by Woolard and Leibrandt (2006). As income is the main factor affecting livelihoods, understanding the 'real income' for each household gives and indication of the livelihoods of the Zanyokwe farmers.
Results and discussion
Technologies and practices introduced at ZIS and the adoption rates amongst farming households
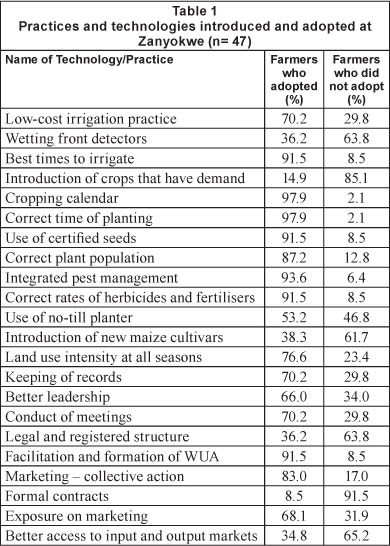
From 2005 to 2008, a number of technologies and practices were introduced at ZIS. Table 1 shows the technologies and practices introduced as well as the proportion of farmers who adopted them. Most farmers adhered to correct cropping calendars and time of planting, and also made use of certified seeds, as well as correct application rates of fertilisers and herbicides. More than half of respondents indicated improvements in land use intensity (Table 1). An improvement was also noticed in the management of water as reflected by the fact that about 92% of farmers mentioned that they irrigated at the right times, since the introduction of the BMP project. Before the project, most farmers used to irrigate at any time of the day, even when it was too hot. The BMP team discouraged this practice and the farmers adopted the habit of irrigating in the mornings and afternoons.
Impact of the BMP project on social status of households
Impact on time spent on farming activities
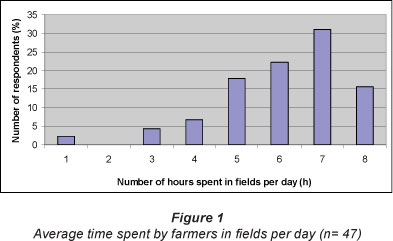
One of the new practices introduced at ZIS was the correct cropping calendar, adopted by almost 98% of farmers at ZIS. As was the case in 2005, more than 90% of the household heads identified themselves as full-time farmers. The only difference between the results of the 2007 and 2005 studies was the change in the reported number of days and hours worked in the fields. More than 50% of heads of households worked daily in the field in 2005 but very few farmers worked over weekends. The rest of the farmers worked 4-6 days per week. In terms of number of hours spent in the field per day, this study found that 32% of the farmers spent 7 h/day, with 23% and 17% allocating 6 h/day and 5 h/day to their fields, respectively (Fig. 1).
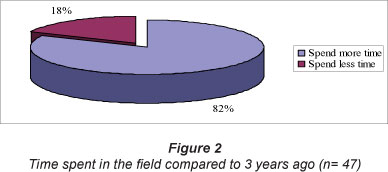
A number of studies, such as those by Fraser et al. (2003) and Hebinck et al. (2007), have demonstrated how farming in the Eastern Cape and other areas of South Africa is slowly losing importance as a source of livelihood. This is largely because of households' increased reliance on social grants (such as old age grants and child grants) as a main source of income in most rural areas of South Africa. The existence of such external sources of income has led most farmers in the province to devote less time to farming. However, the implementation of the BMP project in the study area has reversed this tendency. More than 80% of farmers spent more time in their fields in 2007 than they did 3 years previously (Fig. 2). Only 18%of farmers reported spending less time in their fields than before.
Impact of the BMP project on the economic status of farming households
Impact on crop production
In 2007, farmers were still involved in the production of the same crops as identified in 2005. Of the 11 crops and vegetables identified, cabbages and butternut were produced by a larger proportion of farmers, as demonstrated in Fig. 3. In addition, only four crops, maize (60%), cabbages (78%), butternut (76%) and potatoes (50%) were produced by at least half the respondents. Chillies (7%) were the least produced crop followed by peas (13%) and onion (15%). Although no new crops were introduced, changes were identified in the cropping pattern at Zanyokwe: a decrease in the number of farmers producing maize and increase in the number of farmers producing butternut. Only 40% of farmers produced butternut in 2005 compared to more than 75% in 2007. This major change is a result of the adoption of the best management practices introduced by the BMP project team. The BMP team encouraged the farmers to view farming as a business, and to focus on those products that bring highest returns. As farmers were not earning much money from maize production, most of them decided to switch from maize to butternut production since those who were already involved in this product were getting good returns.

Impact on land use intensity
In terms of the proportion of land allocated to the main crops and vegetables mentioned above, there was no change in the case of maize. The land size allocated to this crop ranged from 0.5 to 2.5 ha, as was the case in 2005, with an average of 0.6 ha. However, a major change was noted for cabbage and butternut, with acreage almost doubling for both crops between 2005 (0.5 ha) and 2007 (0.9 ha).
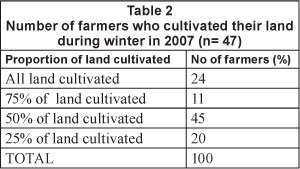
A change in land use intensity was also observed. Table 2 shows the proportion of land in use in winter as well as the number of farmers cultivating those portions: 45% of farmers cultivated half of the land. Just under a quarter (24%) of farmers cultivated all of the land that they own or have access to, and 20% made use of just a quarter of their land. This represents a major improvement on the level of land use in the 2005 winter season, which was virtually zero.
Impact on livelihoods of farming households
When asked whether there had been any improvement in farm incomes over the 3-year period from 2005 to 2007, 82% of farmers acknowledged an improvement. In addition, the majority of respondents (74%) indicated that there was an improvement in their general economic wellbeing. (Economic well-being in this context refers to the state of households being healthy, happy, or prosperous. All these states depend on a number of factors such as family characteristics, resources of farm households, production and employment levels, and the ability of income to meet consumption, savings, and other household needs.) However, there appeared to be no change with regard to the various kinds of livelihood strategies employed by the farming households at ZIS. These households still survive on both farming and non-farming activities. As revealed by the 2005 situation analysis, farming activities still make a major contribution to household income. The contribution (average incomes earned by 1 person (adult equivalent) per household per month) of different livelihood activities to household income are shown in Table 3. The average total household income was R1 439.16, ranging from R126.88 to R13 520.17. In 2005 the average monthly household income was not even half (R593.24) of this figure. Agriculture contributed 81% of household income, compared to 71°% in 2005. It is common, especially in the Eastern Cape, for non-farming activities to contribute more to household income than farming activities, even for irrigators (Fraser et al., 2003, Hebinck et al., 2007). However, this is not the case at the ZIS, as farming, especially crop production, is the main livelihood strategy and contributes significantly to household income.
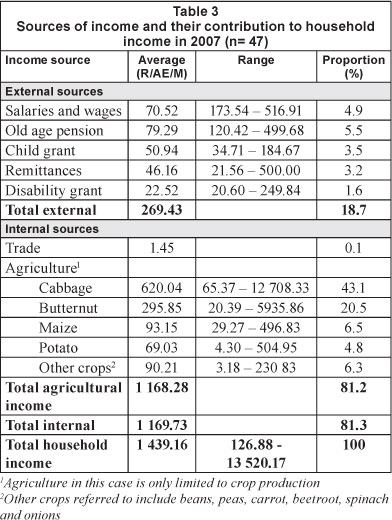
The most commonly grown crops at ZIS were cabbages (37 farmers) butternut (36 farmers), maize (29 farmers) and potatoes (22 farmers). Their contribution to household income was also in that order. Cabbage made a significant contribution (43%) to household income followed by butternut (21%) (Table 3). Maize and potatoes contributed less than 10% each, at 7 and 5%, respectively. The average land area allocated to cabbage (0.56 ha), butternut (0.64 ha) and maize (0.59 ha) was slightly larger than half a hectare (0.6 ha), while potatoes were planted on an average land area of 0.3 ha.
Impact on poverty status of households
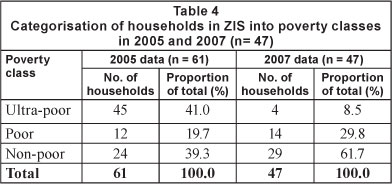
In 2005 a large number (61%%) of households were found to earn incomes lower than the PDL. By 2007, this figure had dropped to 38% (Table 4), which indicates a major improvement in the poverty status of households. The number of ultra-poor households had dropped from 41% to 8.5%, indicating an improvement in the household incomes of this poverty class.
Impact of on-farm trials
It is important to analyse the reasons for increased production, which led to improvements in household incomes and a decrease in the level of poverty identified above. The main reason for this positive change was the introduction of agronomic practices by the BMP team. The agronomy team introduced 3 seasons of on-farm trials from 2005/06 to 2007/08. During this period, they monitored the impacts on farmer cropping practices and changes in the cropping systems in Zanyokwe; these are identified below.
Knowledge gained
Qualitative analysis of the impact of information days held in each of the three seasons indicated that farmers gained knowledge on fertiliser management, varietal evaluation, planting time and plant population. From the trials, farmers realised that late planting, poor choice of cultivars and inadequate fertiliser application were some of the factors resulting in the poor crop yields obtained in the scheme. Farmers and extension officers also noted the benefits of proper agronomic practices, as evidenced by higher yields obtained with hybrid varieties, optimum fertiliser rates and timely planting, as well as optimum plant population densities. The feedback workshops at the end of each season on the findings of agronomic trials were appreciated by farmers, as they indicated better yields and higher returns with the agronomic practices applied.
Adoption of maize hybrid varieties
The monitoring exercise on factors affecting crop production conducted during the 2005/06 summer season revealed that open-pollinated varieties (Sahara and Kalahari) were among the popular maize varieties grown by farmers on the scheme. Exploratory trials were then designed to demonstrate the superiority of hybrid varieties over open-pollinated varieties (OPVs) under irrigated conditions. The superiority of the hybrids became apparent to farmers at information days held in 2006. The varietal evaluation trials showed that the new hybrids, such as DKC 61-25, could yield as much as 5 t/ha more grain than OPVs. In the 2006/07 season it was noted that only one farmer still grew Sahara maize, while the rest of the farmers had switched to hybrids, DKC 61-25 or Pannar 6480. Thus, farmers continued producing maize but switched to different cultivars.
Improved maize planting time
The situation analysis conducted by Monde et al. (2005), as well as the monitoring exercise for the 2005/06 season, revealed that late planting of maize was a common occurrence. In that season, the earliest planting was done on 18 December 2005 and the latest on 16 March 2006. Reasons cited for the delay in planting included a shortage of tractors and untimely supply of inputs. Trials conducted to evaluate the effect of planting time on maize grain yield clearly demonstrated to the farmers that this was one of the major cause of low yields obtained from maize in the scheme. There was a remarkable improvement in the timing of planting operations during the 2006/07 and 2007/08 seasons. In both seasons all planting was completed by mid-December. Timely planting also meant that farmers were able to prepare ahead and on time for the subsequent winter season as they could harvest their maize earlier.
Improvement in plant population densities
One major problem that was observed during the 2005/06 monitoring study was the low plant stands of maize and butternut. Maize stand increased from a mean of 23 000/ha in 2005/06 to a mean of 37 667/ha in 2007/08. In 2005/06, butternut stands were well below 10 000 plants/ha due to the wider spacing used, poor irrigation management and late weed control. One of the case-study farmers expressed great concern about the large fruit size and decided to experiment with possible ways to reduce fruit size while optimising total yield. In 2006/07 he reduced the in-row spacing from 0.7 m to 0.4 m with great success. Fruit size was greatly reduced and he managed to sell most of his crop, and also avoided large expenditures on labour for grading.
Improved fertiliser management
The situation analysis further revealed that poor management of fertilisers was one of the factors contributing to the observed low yield of the scheme. Fertiliser management for butternut showed improvement, with farmers applying an average of 69 kg N/ha in 2006/07 compared to 58 kg N/ha in 2005/06.
Diversifying into green maize production
It was noted during the situation analysis and confirmed in the 2005/06 monitoring studies that maize production in the scheme had traditionally been for purposes of producing grain. After green maize trials were carried out in the scheme it became apparent to farmers that this enterprise was more rewarding than grain maize production. This saw an increase in green maize farmers, from nearly zero, to five in the 2006/07 season, and a further increase to 10 in the 2007/08 summer season.
The traditional way of producing green maize in the scheme has been by use of direct seeding. However, trials in the 2006/07 and 2007/08 seasons indicated that seedlings can offer superior performance if properly managed. Only one farmer adopted the strategy of using seedlings in 2006/07 but was disappointed with the performance. The major cause of poor performance was the inferior quality of the seedlings at transplanting, which was related to the source of the seedlings. However, in the 2007/08 season 7 farmers offered to do trials (farmer-managed) on green maize, comparing direct seeding and transplanting. All farmers preferred transplants, which matured early and required less fertiliser compared to direct seeding. The other advantage realised from seedlings was good establishment compared to direct-seeded maize, the establishment of which was greatly affected by birds feeding on emerging seedlings.
Improved crop yield
The improvement in plant population and fertiliser management in butternut translated to an increase in yield. Mean butternut yields increased from 6.8 t/ha in 2005/06 to 8.1 t/ha in 2006/07, a 1.3 t/ha (19.1%) increase. Though the average yield of 8.1 t/ha is still far below the potential of 20 to 30 t/ha, it is anticipated that the yield will continue to increase as farmers continue to improve in all aspects of producing the crop, and, in particular, in weed management.
Increased farmer participation
Initially when the issue of trials and demonstrations was introduced to the farmers, most showed little interest in being involved. Most farmers in the scheme appeared not to have hosted crop trials before and for that reason there was reluctance to offer land for trials. However, after the first season in 2005/06, there was an overwhelming increase in the number of farmers who wanted to host trials in their fields, as they found these to be very useful and rewarding. Feedback on the results of the exploratory and variety trials showed that farmers were very appreciative of the knowledge they had gained from the trials. Many showed a willingness to try some of the high-yielding maize hybrid varieties in their own fields. More farmers than could be accommodated offered their land for the trials.
Impact of the BMP practices on household food security at ZIS
The general feeling of respondents towards hunger and food insecurity
When the BMP project was introduced at the scheme, its main objective was to develop and implement technologies and knowledge useful for farmers to improve their livelihoods and quality of life. Thus, improvement in household food security was one of the economic indicators used in this study. When asked about the impact of the new practices on household food security, 87% said that their families had become more food secure than before the project (see Fig. 4).
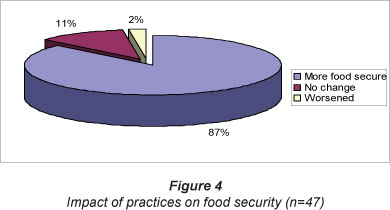
The main reason for improvements in household food security was that there was more dedication towards farming than there had been 3 years before. However, 11% of respondents highlighted that their food security had not changed at all in the 3-year period in spite of the new practices adopted. The remaining 2% stated that they were more food insecure than before the project was implemented. The high cost of inputs for the new technologies (such as pesticides and fertilisers) was given as one of the reasons for this. Some farmers had since stopped farming due to poor health whilst others kept failing to raise the required membership fee for the MFP that would see them qualify for subsidised credit. Consequently, such farmers did not produce much in the 3-year period which could explain the decrease in their food security. In general, it can be concluded that the new practices have had a positive impact on household food security at ZIS.
The Eastern Cape Province has the highest rates of poverty in the country, with many households reportedly facing periods of food shortage during the year, resulting in them having to skip some meals. This is not the case at Zanyokwe as none of the respondents reported food shortages during any period of the year. Each household indicated that they had 3 meals every day. They accessed alternative food sources from urban markets during times of low own production. The money farmers gained from the sale of their farm produce allowed them to maintain their diet even during the times when crops were not yet ready for consumption.
Main ingredients of the diet and food acquisition strategies
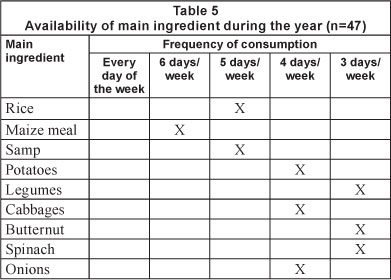
The main ingredients of the local diet of the farming households at Zanyokwe were rice, samp and maize-meal, which are mostly consumed with other foods such as vegetables, meats and fats and oils. (For a product to qualify as a main ingredient, it had to be consumed at least three times a week). Table 5 shows the main vegetables (including other food groups) consumed as well as the frequency at which these were consumed. Other foods included in this table are the three staples or cereals mentioned above, tubers (potatoes) and legumes (dried peas and beans).
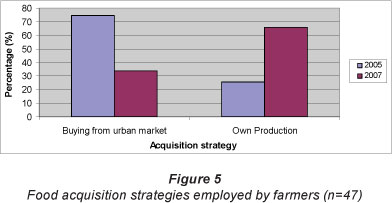
To acquire the above-mentioned foods, the respondents employed two important food-acquisition strategies, namely, buying or producing own food (see Fig. 5). While this did not change over the 3-year period, there was a change in how some of these products were obtained at the time of this investigation compared to 3 years previously. Prior to the implementation of the BMP project in 2005, the majority (75%) of households relied on urban markets as their major source of food. In 2007, the opposite was true with the majority (65%) reliant on own-production of food (Fig. 5).
Impact of the BMP Project on institutions at Zanyokwe
Impact of the BMP on normative institutions at Zanyokwe
The BMP project had a positive impact on normative institutions at Zanyokwe. During the implementation of the project 3 important farmer associations were formed: the Zanyokwe Farmers' Co-operative; village-based primary cooperatives, and a Water User Association (WUA). The Department of Agriculture played a major role in encouraging the farmers to form the co-operatives. Four primary cooperatives were registered and two are at advanced stages of registration. Registered cooperatives opened bank accounts, facilitating easier payment of proceeds from joint marketing activities to members. As a result of their legal status, primary cooperatives can source funds for members for productivity activities. However, none of the newly-established cooperatives had used its legal status to negotiate any contracts on behalf of the membership at the time of the survey.
Farmers joined the central cooperative for the whole scheme as individuals. The main responsibilities of the central co-op are to organise markets for various products, trade (outputs and inputs) as well as to solve problems experienced by primary co-ops. The farmers also indicated that, ever since the establishment of the farmer's co-op, cooperation between different sections had improved. The unity between the different sections is also a result of the efforts of the scheme manager appointed by the Department of Agriculture in 2006 to lead the revitalisation of the scheme. With the assistance of the scheme manager, farmers secured funding from the National Development Agency (NDA) for furnishing offices of the central cooperative, purchasing farm equipment and farmer training. The Small Enterprises Development Agency has initiated installation of 20 ha of drip irrigation in consultation with farmers. Other negotiations intended to diversify production were under way but had not achieved results at the time of the 2007 survey.
At the time of this study (2007), formation of a WUA facilitated by the Department of Water Affairs and Forestry (DWAF) was yet to be completed but had already had the impact of uniting the Zanyokwe community, both irrigators and non-irrigators. The process of formation of the WUA managed to involve traditional leadership which is playing an active role in the association. Non-irrigators in Zanyokwe are more organised in their participation in activities of the WUA and their main expectation is the possible establishment of irrigation infrastructure in their village.
Impact of the BMP on regulatory institutions at Zanyokwe
The conduct of the management structure
The BMP has also impacted on regulatory institutions as seen in the restructuring of the management structure. In 2005, the management structure of the scheme was almost dysfunctional. Meetings were irregular and there was little or no cooperation amongst the various sections of the scheme. Each section handled its own affairs as it saw fit. There was no formal policy put in place with regard to the general conduct of members of the management. After the situation analysis, the BMP team began to have a series of meetings with farmers encouraging them to strengthen their regulative institutions by enforcing law and regulations. With the establishment of the management structure mentioned above, farmers began to address the problem of irregular meetings. The respondents indicated that they had adopted a mentality of having planned meetings. A general meeting is held once a month but urgent meetings are also held when the need arises.
Restructuring of the marketing system
At the time of the situation analysis, the marketing system was characterised by a lack of collective action, as well as informal contracts. The majority of farmers (67%) only used farm gate selling as a marketing strategy and 33% took produce to buyers in neighbouring villages or urban markets. Contract marketing was only with one client, a major supermarket chain, and had been used with mixed results. Achieving good quality of butternut was a major problem for farmers contracted to the supermarket chain. Various aspects of marketing changed for the better with the implementation of the BMP.
In addition to supplying hawkers from Alice, Middledrift, Keiskammahoek, Dimbaza and King William's Town, farmers added new formal markets - a vegetable shop in King Williams Town, a market in Alice, a university and a fresh produce market in Umtata. The University of Fort Hare established a processing unit, which is part of the Agri-park project, and buys products from local producers for processing purposes. The BMP team made an effort to link farmers with potential buyers. This was first achieved by arranging visits to nearby markets with the intentions of exposing the farmers to an ideal marketing system as well as initiating agreements between them and buyers.
During these visits, farmers learned how to grade and pack products. They were also introduced to different crops sold at the market, and how they were selling. Farmers were equipped with market information, including the times of year when different products fetch higher prices at the market. They were also introduced to different marketing agents who gave them information about the kinds of products and quantities needed, as well packaging. As a result of this exposure, farmers' marketing skills have improved, especially in the marketing of butternuts. The grading of butternuts takes place at Zanyokwe, and the packaging has improved considerably.
The performance of these marketing functions by farmers had a positive impact on the incomes realised from the sale of butternuts. In 2007, a 10 kg bag was sold at an average price of R15.00/bag compared to only R12.00 in 2006. The change in prices was brought about mainly by performing extra marketing functions, an effort to meet the requirements of a major supermarket chain, as well as perfect timing of production. The main marketing outlet for butternuts is a major supermarket chain's outlets in Port Elizabeth but farmers have negotiated to supply the East London outlets as well. The relationship between farmers and the supermarket chain has improved, and the payment process has been streamlined, thus reducing the waiting period for payment from up to a year to 3 months or less. The farm manager hired by the supermarket chain has also been withdrawn, implying that a relationship of trust between the farmers and the client has now been built.
Farmers established a new market, the Kei Fresh Produce market in Umtata with the assistance of Mr Amankrah and the Department of Agriculture. This offered an alternative market to the supermarket chain for butternut. Farmers visited the market in Umtata and sent in a first consignment of 1 600 pockets of butternut. Delays in payment reduced volumes for a second and third consignment to 1 300 and 1 041 pockets, respectively. The reduced volumes also reduced margins for farmers and more needs to be done to restore confidence of farmers in this market.
Rules and regulations for accessing land
The institutions that govern the use of land were still very weak at the time of the survey. There had been no improvement in the way people access land at Zanyokwe. The problems of land tenure, short lease periods, and expensive rentals prevent people from cultivating more land. In 2007, the landless still accessed land in the same way, i.e. through negotiations between the landless and landowner. There had been no intervention by the traditional leaders and neither the farmers nor the Department Of Agriculture had made progress in this regard. The land tenure issue had been referred to the Department of Land Affairs in 2005, but there was still no solution at the time of the impact assessment.
Institutional arrangements for managing water
For irrigation to be viable, socially and economically as well as environmentally, institutions must evolve to be compatible with concepts of sustainability. Understanding how competition for water will affect irrigation requires an in-depth understanding of the institutional settings, i.e., the laws and regulations which apply. The findings of this study at Zanyokwe revealed that such institutions were still very weak. There is still a lot of dependency on government especially when it comes to repairing irrigation infrastructure. The formation of a WUA is one step to make sure that people use water wisely and that they pay for it. While the WUA was still in the process of being registered, the BMP made an attempt to improve water usage at the scheme by introducing a technology that would ensure that all irrigators use water efficiently. A few wetting front detectors were installed in farmers' fields, which indicate when soil water is sufficient. The farmers in whose fields detectors were installed were happy and indicated that the technology saved water. The respondents also requested formal training with regard to the use of the detectors to equip farmers with knowledge and skills in water management.
Institutions for maintaining and operation of irrigation infrastructure
The Zanyokwe scheme infrastructure deteriorated due to lack of maintenance. In 2005, farmers revealed that about 100 ha of land had been taken out of production due to leakages from underground pipes that affected all sections of the scheme. The situation gradually improved as the Department of Agriculture worked with the BMP to revitalise the scheme. Farmers initiated activities to assist with fund raising, with mixed results. Efforts to coordinate stakeholders active in Zanyokwe began at a meeting at Fort Cox in 2007 but did not yield results. Farmer organisation was not strong enough to follow through on resolutions agreed at Fort Cox. The BMP worked with farmers to carry out an audit of the scheme and to assess issues of operation and maintenance, as shown in Table 6.
Though farmers received some training on how to operate and repair irrigation infrastructure, they play a limited role in the maintenance of irrigation infrastructure. The absence of a workshop at the scheme was cited by farmers as a constraint in repairing irrigation infrastructure. There is no stock of spares readily available and these have to be ordered from East London. Usually, it takes weeks or months before the ordered spares arrive. It also means that they have to hire transport to fetch the spares. The other problem mentioned was that some repairs lead to water cuts in areas or stations that are not affected. This is due to the layout of the current irrigation system. Farmers who are not affected usually complain when water is cut. Farmers pointed out that valves are needed for every station so that repairs in one station do not affect the other stations.
Impact on quality of extension services
At the time of impact assessment, access to extension services by irrigators had not yet improved. In fact, as farmers put it, 'it's worse than before'. The results of the situation analysis carried out in 2005 revealed that there were 2 extension officers attached to the scheme. However, visits by extension officers were few and irregular. It was apparent at the time of the assessment that the situation had gone from bad to worse. However, farmers benefited from the extension advice given by the BMP project team, especially on agronomic practices. The adoption of a number of newly-introduced practices and the impact of these on their economic wellbeing is testimony to this. At the time of the survey, the scheme had a newly-appointed manager, reflecting the Department of Agriculture's efforts to revitalise irrigation schemes. Extension services were therefore expected to improve in future.
Conclusions
Impacts of the BMP on social wellbeing
The skills introduced and adopted at ZIS were in the areas of water management, agronomic practices (use of certified seeds, correct rates of fertilisers and herbicides, correct time of planting and integrated pest management), marketing, institutional arrangements as well as leadership and management. More than 90% of respondents indicated that there was improvement in agronomic practices and water management and 68% indicated an improvement in marketing. More than half of farmers worked on their farms on a daily basis in 2007, a major change, as none of the farmers reported working over weekends in 2005.
Impact of the BMP on economic wellbeing
More than 60% of farmers acknowledged improvements in land use intensity. This was due to increases in acreage of crops such as cabbages and butternut, as well as planting in both seasons (summer and winter). In 2005, almost all land was fallow during the winter period at ZIS. In 2007, more than 40% of farmers cultivated their land in winter.
As was the case in 2005, farming made significant contributions to household income. However, the contribution improved from 71% in 2005 to 81% in 2007. Farmers made most money on cabbages and butternuts. The increase in household incomes had a positive effect on poverty status of households. The proportion of households earning incomes that were below the poverty line dropped from 61% in 2005 to 38% in 2007, while the proportion of ultra-poor households dropped from 41% to less than 10%.
The majority (87%) indicated that they were more food secure than was the case before the implementation of the project. Also, own production was the main source of vegetables, as indicated by 66% of respondents compared to only 25% in 2005. Food remained the main expenditure category though, as was the case in 2005.
In general, it can be concluded that introduction of the BMP project has had immense positive impacts on the socioeconomic welfare of both the Zanyokwe farmers and the surrounding communities. Given more time, the magnitude of impact could increase, as more and more farmers adopt the new agronomic practices.
Acknowledgements
The authors are grateful to the Water Research Commission (WRC) for funding this research. Gratitude is also extended to the people of the Zanyokwe Irrigation Scheme and everyone who participated in making this study a success.
References
BEMBRIDGE TJ (1999) Guidelines for rehabilitation of small-scale farmer irrigation schemes in South Africa. WRC Report No. 891/1/00. Water Research Commission, Pretoria. [ Links ]
BUNDY C (1988) The Rise and Fall of the South African Peasantry (2nd edn.). David Philip, Cape Town. [ Links ]
COMMONWEALTH OF AUSTRALIA (2005) Socio-economic impact assessment toolkit. Bureau of Rural Sciences, Canberra, Australia. [ Links ]
FRASER GCG, MONDE N and VAN AVERBEKE W (2003) Food Security in South Africa: A case study of rural livelihoods in the Eastern Cape Province. In: Nieuwoudt L and Groenewald J (eds.) The Challenge of Change: Agriculture, Land and the South African Economy. University of Natal Press, Pietermaritzburg. 171-183. [ Links ]
FRYE I (2005) Constructing and adopting an official poverty line for South Africa: Some issues for consideration. A discussion document. National Labour and Development Institute (NALEDI), South Africa. [ Links ]
HEBINCK P, VAN AVERBEKE W, MONDE N, SMITH L and BENNETT J (2007) Life histories and livelihood trajectories. In: Hebinck P and Lent P (eds.) Livelihoods and Landscapes: The People of Guquka and Koloni and their Resources. Brill Publishers, Boston. [ Links ]
MONDE N, CHIDUZA C, BRUTSCH MO, MNKENI PNS, MTSHALI S, DLADLA R, MODI AT, MTHEMBU BE, VAN DER STOEP I and STEVENS J (2005) Best management practices for smallholder farming on two irrigation schemes and surrounding areas in the Eastern Cape and KwaZulu-Natal through participatory adaptive research: A Situation Analysis Report on the Zanyokwe and Tugela Ferry Irrigation Schemes. University of Fort Hare, Alice, South Africa. [ Links ]
NEVEN D, READON T and HOPKINS R (2005) Case Studies of Farmer Organizations Linking to Dynamic Markets in Southern Africa: The Fort Hare Farmers Group, South Africa. Michigan State University, Michigan. [ Links ]
NTSONTO NE (2005) Economic performance of the smallholder irrigation schemes: A case study in Zanyokwe, Eastern Cape, South Africa. Unpublished M. Inst Agrar (Agricultural Economics) thesis, University of Pretoria, Pretoria. [ Links ]
SHINNS LH and LYNE M (2002) Symptoms of poverty within a group of land reform beneficiaries in the Midlands of KwaZulu-Natal: Analysis and policy recommendations. Agrekon 43 (1) 74-88. [ Links ]
STATISTICS SA (2003) Census 2001: Census in Brief. Report No. 03-02-03. Statistics South Africa, Pretoria. [ Links ]
STATISTICS SA and NATIONAL TREASURY (2007) A national poverty line for South Africa. National Treasury, Pretoria. [ Links ]
VAN AVERBEKE W, M'MARETE CK, IGODAN CO and BELETE A (1998) An investigation into food plot production at irrigation schemes in the central Eastern Cape. WRC Report No. 719/1/98. Water Research Commission, Pretoria. [ Links ]
WOOLARD I and LEIBRANDT M (2006) Towards a poverty line for South Africa: Background note. Southern Africa Labour Development Research Unit. University of Cape Town, Cape Town. [ Links ]
YOKWE SCB (2005) Investigation of the economics of water as used by smallholder irrigation farmers in South Africa. Unpublished M. Inst Agrar (Agricultural Economics) thesis, University of Pretoria, Pretoria. [ Links ]
Received 28 June 2011; accepted in revised form 8 October 2012.
* To whom all correspondence should be addressed. +27 47 532 4601; fax: +27 86 518 2541; e-mail: mengezit@gmail.com


