


Services on Demand
Article
 English (pdf)
 Article in xml format
 Article references
Indicators

Related links
-
 Cited by Google
 -
 Similars in Google
Share

 Permalink
Water SA
On-line version ISSN 1816-7950
Print version ISSN 0378-4738
Water SA vol.38 n.5 Pretoria Jan. 2012
Vulnerability of wastewater infrastructure of coastal cities to sea level rise: a South African case study
Elena Friedrich*; Dale Kretzinger
CRECHE Centre for Research in Environmental, Coastal and Hydrological Engineering, School of Engineering, Civil Engineering Programme, University of KwaZulu-Natal, Howard College Campus, Durban, South Africa
ABSTRACT
Sea-level rise is one of the consequences of global warming that has the potential to affect the infrastructure of coastal urban areas. In this context, it is important to perform vulnerability assessments in order to understand how this infrastructure may be at risk, and, if necessary, adapt and maintain functionality of infrastructure systems. This study investigates the vulnerability of the wastewater collection and disposal infrastructure (i.e. pipelines and manholes, pumping stations and wastewater treatment plants) to sea-level rise in eThekwini Municipality, South Africa. By using geographical information systems (GIS) and a multi-criteria analysis considering elevation, operational capacity and connectivity, a scale of vulnerability was established and the most vulnerable infrastructural elements were identified in the municipality. These should be prioritised for detailed monitoring and adaptive interventions in order to maintain the functionality of the wastewater system as sea level is predicted to rise. As such this study presents a model of how vulnerability of wastewater systems can be evaluated in coastal cities.
Keywords: climate change adaptation, urban vulnerability, wastewater infrastructure
Introduction
Changing climates are one of the most important environmental challenges of our times, and one of the most important impacts is an increase in globally-averaged sea level (IPCC, 2007). Sea-level rise is caused by thermal expansion and melting of polar ice caps due to temperature increases, thus adding to the existing volume of water in the oceans (IPCC, 2007). Unlike other impacts expected from global warming, sea level rise is predicted to occur over time and can be modelled to varying degrees of accuracy. While there is a high level of scientific certainty that sea level rise will occur, the timing is highly uncertain. It is expected to have potential to affect coastal infrastructure, and it is, therefore, necessary to assess and predict the degree to which this damage may extend at local level. This paper investigates the effects of a potential scenario of sea level rise on the urban wastewater system of a coastal city in South Africa, and should be seen in a wider context where local, case-specific studies are used as a first step towards adaptation to climate change. There is a recognised need for such studies, and the World Bank (2010) has initiated a dialogue between the different water utilities from different countries, because it considers that utilities are gradually developing strategies for adaptation but that 'much of this knowledge remains poorly documented and is largely unavailable' (Danilenko et al., 2010 p. 33). It is also recognised that 'rising sea-water levels and inland flooding will cause land inundation and blockages in natural drainage structures' and that 'these effects will be even more difficult to manage for those water utilities that are unprepared and/or financially weak' (Danilenko et al., 2010 p. 1). This is particularly relevant for developing countries such as South Africa, and for their coastal cities. One such city is the eThekwini Municipality.
Background information
The eThekwini Municipal Area (EMA) is situated on the eastern coast of South Africa, within the province of KwaZulu-Natal. The core city of this municipality is Durban, which has the largest port in the country and the subcontinent. The municipality has a population of approximately 3.6 million people and covers an area of 2 297 km2, with a coastline of 98 km along the Indian Ocean. It also contains 18 catchments, 17 estuaries and 4 000 km of rivers (EWSU, 2011). The municipality is led by a municipal manager under which the water and sanitation unit functions. This unit is in charge of water services within the EMA, including wastewater collection and treatment. To perform this function it operates 287 pumping stations and 27 wastewater treatment plants. The total length of the wastewater pipeline network is around 8 790 km and there are more than 407 500 sewer connections (EWSU, 2004). Figure 1 shows the waterworks and the trunks (major pipelines) of this network in the context of the eThekwini Municipality.
eThekwini Municipality follows South Africa's free basic water services policy and provides the first 9 000 I of water per month free of charge for each household, and no sewage/ wastewater levy is charged. Above this free service the sewage disposal tariffs increase with the volume of water used (i.e. based on meter readings for potable water and percentages assumed to become sewage for each volumetric usage category - see EWSU, 2010). Although the EMA undertakes sustained efforts to provide water services to all citizens, there is currently (2011) a backlog of 54 292 dwellings requiring potable water supply and 205 947 dwellings requiring sanitation services (EWSU, 2011). This backlog has been reduced significantly since the year 2000, when the EMA extended its boundaries, incorporating many previously disadvantaged areas (formal townships and informal settlements) segregated under the apartheid regime. In this context it is clear that the priorities of the Municipality lie with providing the basic needs of the population. However, this process can only be accomplished and sustained in the future if water systems adapt to the challenges that climate change will pose. This has been recognised and will be incorporated in the municipal climate change adaptation plans. Therefore, vulnerability studies like this one are important to inform the planning process, with the aim to maintain the functionality of EMA's wastewater systems.
In addition to common uncertainties, such as growth in demand over time and financial resources, changing climates pose another set of challenges for local municipalities in all countries. In this context the concept of climate-resilient infrastructure emerges, defined by DEFRA (2011 p. 17) as a 'more resilient and robust infrastructure network able to cope with projected climate impacts', having 'increased flexibility to cope with uncertainty without massive failure and economic cost'. This can be done by changing existing infrastructure so that maintenance regimes incorporate resilience over the lifetime of existing assets and by building new infrastructure designed to withstand future climate changes (DEFRA, 2011).
Impacts of sea level rise on wastewater systems
The physical impacts related to sea level rise in coastal areas include inundation, flood and storm damage, erosion, saltwater intrusion, rising water tables/impeded drainage and wetland loss (and change) (IPCC, 2007). In addition, it is predicted that, due to climate change, storm intensities and frequencies will change causing 'increased extreme water levels and wave heights; increased episodic erosion, storm damage, risk of flooding and defence failure' (IPCC, 2007 p. 323). Alterations of wave conditions are also predicted to occur leading to swells, altered patterns of erosion and accretion and re-orientation of beach plan forms. In addition there is potential for coastal areas to subside due to settlement (IPCC, 2007). All these impacts have the potential to affect the wastewater infra-structural elements that are situated in the immediate vicinity of the coast. The main elements of a municipal wastewater system considered in this study are: (i) the pipelines and manholes, (ii) the pumping stations used for the collection and transport of the wastewater and (iii) the wastewater treatment plants, which provide treatment before the wastewater can be released into the environment. Effects of sea-level rise on these elements can be direct and visible (e.g. flooding or storm damage of infrastructure), but also indirect and more subversive, such as the rising table water causing infiltration and inflow into the system. It should be noted that, historically, wastewater treatment plants have been built near the coast and at low ground elevation (to take advantage of gravity and to make it easy to discharge treated effluents into the sea), thereby exposing them to the effects of sea level rise. The flooding of low-lying areas will also affect the natural gravity drainage systems within these areas (Titus et al., 1987), and, since wastewater systems rely extensively on a 'hydraulic head', the partial or total loss of this will have consequences for the collection and movement of wastewater. Without the assistance of additional pumping, this would result in lower water flow rates within the network, which will cause increased siltation to occur, which will, in turn, require increased maintenance. Debris from the flooding caused by sea-level rise may also cause blockages within the pipe inlets, outlets and pipelines. Major damage may result from this (Titus et al., 1987).
Wastewater systems are also particularly prone to other indirect, less visible effects of rising coastal groundwater tables, since most of the pipes, as well as parts of pumping stations, are underground. Chugtai and Zayed (2008) reviewed the factors affecting sewer pipelines: groundwater infiltration is seen as one of the important environmental factors leading to hydraulic operational deterioration, since the system (pipes, pumps and wastewater works) has to deal with higher flows. In addition, groundwater can wash soil particles away and reduce the soil support along the pipelines. This modifies the bedding conditions of pipes and might lead to pipe failure (Chugtai and Zayed, 2008).
Vulnerability assessments of water system
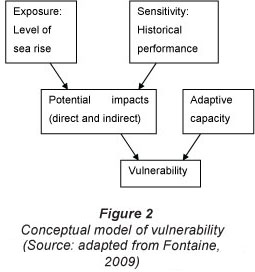
Vulnerability to climate change has been defined in many ways; Füssler (2009) presents a detailed review of these definitions and their implications. For this study, vulnerability is seen as 'the degree to which a system is susceptible to, and unable to cope with, adverse effects of climate change, including climate variability and extremes. Vulnerability is a function of the character, magnitude, and rate of climate change and variation to which a system is exposed, the sensitivity and adaptive capacity of that system'. (IPCC, 2007 p. 6). This definition includes two critical concepts that are used in the analysis of the results, namely the concept of 'degree of vulnerability' and the concept of 'adaptability to changes in climate'. Creating levels of vulnerability in this context is beneficial in that it creates a realistic view of the probable damage, should the climate predictions prove to be correct. Classifying a level of vulnerability is practical, as it shows that where one treatment plant, for example, may get flooded, another may only suffer head loss and therefore requires higher pumping output. A model of vulnerability, and how it should be assessed in accordance with the fundamental concepts presented and used i this study, is shown in Fig. 2.
In a more specific context, namely a vulnerability study done by Burton et al. (2005 p. 3) for wastewater systems in the Greater Vancouver Area, vulnerability was defined as 'the propensity for regional infrastructure to malfunction under future forcing conditions'. These authors classified vulnerability into three types: Type 1 - reduced operational efficiency; Type 2 - design failure and Type 3 - infrastructure failure. In the analysis of the results from the current study all three types of vulnerabilities have been used.
Similar to vulnerability definitions there are a multitude of vulnerability assessments and associated indices that have been developed (see Füssler, 2009, for a review). In the water sector most of these studies (Cromwell et al., 2007; Rosenzweig et al., 2007; Kundzewicz et al., 2008; Babel et al., 2011; and others) address water resource management and very few investigate wastewater systems (Burton et al., 2005; Metro Vancouver and Kerr Wood Leidal Associates Ltd., 2008). Only one of the studies (Metro Vancouver and Kerr Wood Leidal Associates Ltd., 2008) reviewed contains a detailed analysis of infrastructural elements, and an adapted methodology on how to assess vulnerability of wastewater systems. In particular, there are no wastewater vulnerability studies in the context of South Africa or the African continent and one of the aims of this paper is to address this research gap. In doing so, some of the theoretical approaches developed for water resource management are drawn upon. For example, Cromwell et al. (2007) investigated a top-down and a bottom-up approach in identifying vulnerabilities of water supply systems arising from climate change. The top-down approach is based on large-scale prediction models (mainly quantifying rainfall) and the bottom-up approach is based on small-scale studies in which water utilities/organisations 'based on the general findings of climate change research can identify the likely cause-effect pathways that could prove troublesome' and in which 'a utility's own water modelling tools can be applied to examine extreme scenarios' (Cromwell et al., 2007 p. 12). This paper follows the bottom-up approach, which was applied to the local wastewater system. This is in line with recommendations in the literature, since 'utilities in developing countries are likely to find adopting a bottom-up approach to be a more practical first step to undertaking climate vulnerability assessments as they begin to analyse their own adaptive capacity' (Danilenko et al., 2010 p. 11).
Vulnerability assessments to sea-level rise can be performed at different scales. Sterr (2008) illustrated this for the coastal zone of Germany, and shows that studies were performed at 3 different scales, namely, (i) at national level, (ii) at regional level, and (iii) at local level for selected communities. He states that 'when comparing findings from these analyses the results show that the economic risks of flooding and erosion are highest when detailed studies covering the full set of infrastructure assets are used' (Sterr, 2008 p. 380). This study is one of the first steps towards such a detailed, local investigation of infrastructure. Another study on vulnerability of road transportation to sea-level rise was performed for the eThekwini Municipality (Friedrich and Timol, 2011).
Methodological steps
In assessing the vulnerability of wastewater infrastructure to sea-level rise the first step was to define the scope for the vulnerability assessment. This was followed by a second step, i.e. defining the parameters to be used for the vulnerability ranking. The third step was the collection of data for the local wastewater system and the fourth was the analysis of this data using a GIS model together with a multi-criteria analysis. The analysis resulted in a ranking system for the different elements of the wastewater infrastructure. Following this ranking, the most vulnerable elements were identified and prioritised.
Scope of the study and choice of parameters
The aim of the study was to investigate the vulnerability of the wastewater infrastructure of the EMA to sea-level rise, and to prioritise elements of this infrastructure for monitoring and adaptation. The scope was an investigation of all infrastructural elements within the wastewater system to the impacts of sea-level rise. Although all elements were investigated separately, it must be underlined that some (i.e. pumping stations and wastewater treatment works) were seen as more important for the overall functioning of the system than others (i.e. pipelines), and this importance was weighted in the analysis.
The first parameter considered was the predicted sea level rise for the EMA. Sea-level rise on the coast of Durban is expected to range between 0.5 and 1 m for the next 100 years, and a detailed study was undertaken by the Council for Scientific and Industrial Research (CSIR) together with the municipality. It emerged that sea level rise cannot be considered in isolation and needs to be investigated in conjunction with several other parameters. These included spring tides, severe wind set-up, wave set-up and highest astronomical tides. Table 1 summarises the predicted sea-level and the effects of other factors, and sums up the predicted rise to give a worstcase scenario level above current mean sea-level (MSL).

In this paper a total sea-level rise of 2.8 m was used as a worst-case scenario and it is unlikely that all factors included in estimating this value will occur at the same time. However, it does represent a realistic worst-case scenario, as during March 2007 exceptional waves reaching the 8 m contour lines were recorded for the EMA, for several days, at a few locations along the coast (Mather et al., 2012). These kinds of events can be expected to occur more frequently due to changing climates.
The second parameter considered was the geographical location and elevation, and this was focused on all of the wastewater infrastructure elements near to the coast within the boundaries of the EMA. As such all operational units within the Department of Water Services of the EMA which were next to the coast were identified, and all of the wastewater infrastructure belonging to these units was collated in an inventory. This task was undertaken using the GIS software ArcView; input files were sourced from the municipality. On the geographical map of the infrastructural elements, an elevation map with contour lines has been overlaid. All of the infrastructural elements situated at an elevation between 0 and 2 m were considered highly vulnerable and those at an elevation between 2 and 4 m were considered vulnerable. These were classified further, as shown in the following paragraphs. The use of ground elevation for wastewater systems is only indicative because elements of these systems, in particular all of the pipelines and some of the pumping stations, are underground (i.e. below the elevation depicted on the map) and, therefore, might be exposed to rising groundwater due to seawater infiltration before the actual flooding occurs.
The degree of vulnerability was assessed by a system of classification which was developed for individual infrastructural elements. All pipelines and manholes under the 2 m contour were considered vulnerable; however, with regard to the 2 to 4 m contour lines the classification presented in Table 2 was made, depending on the length of the pipeline and the number of manholes in an operational area/unit. The classifications presented in Tables 2 and 3 are based only on quantitative properties of the sewer network (i.e. the length of pipelines and the numbers of manholes) below the 4 m contour line.


A similar classification was developed for manholes and is presented in Table 3.
The vulnerability classification for pump stations was assessed differently and, in addition to elevation, a strategic importance rating (based on connectivity and the area of the network the pump station services), as well as the capacity of the pump station, was considered. A small capacity was assigned to pump stations with flow rates of less than 15 l/s, a medium capacity was assigned to pump stations with flow rates between 15 and 100 l/s, and a large capacity was assigned to pumping stations with more than 100 l/s.
The parameters used for determining the degree of vulnerability for wastewater treatment stations were geographical position, elevation and the position of the outlet pipes. In particular, the last two factors are important, because a rise in sea-level will cause a drop in hydraulic head between the plant and its natural receptor and so a greater pumping output would be needed in order to reliably discharge the treated wastewater. The position and the elevation of the plant are also important in assessing the risk of indirect damage due to marine scouring, which proved to be important for the Central Wastewater Plant.
Data collection and analysis
Detailed information was collected on the EMA wastewater system and, in particular, on the infrastructural elements identified in the geographical analysis and elevation investigation. This also included historical operational data used to assess sensitivity. The data needed were sourced from the municipal GIS system, from drawings and technical reports, from interviews with relevant operational personnel and from site visits. In particular, the interviews with operational personnel were very useful, as they offered expertise and unique information on the functioning of the system.
A multi-criteria analysis was performed for each of the infrastructural elements of the wastewater system by taking into account the parameters presented in the previous section. A composite degree of vulnerability has been developed based on this analysis for each of the elements, and a vulnerability ranking is presented for pipelines and manholes, pumping stations and wastewater treatment plants. These results were then combined in an assessment, following the model presented in Fig. 2 (but without adaptation), and a composite vulnerability was established for the operational areas of the EMA's water and sanitation unit. In this composite vulnerability, 3 types of wastewater infrastructural effects were considered, as differentiated by Burton et al. (2005) (i.e. reduced operational efficiency, design failure and infrastructure failure).
Assumptions and uncertainties
In the GIS analysis, 2 main assumptions have been made. It was assumed that (i) all sites for pumping stations and waste-water plants are flat, and that (ii) the GIS location which is situated in the centre of each facility is representative for the entire facility. With larger facilities like wastewater treatment plants this might not always be the case.
The adaptive capacity which contributes towards vulnerability, as presented in Fig. 2, was only investigated in terms of technical adaptations possible for the most important elements of infrastructure. In the literature adaptive capacity includes institutional and financial factors, which were beyond the scope of this study. Also these institutional and financial factors are considered to be equal for all infrastructural elements included in this study, since they are all municipal assets.
The main assumption of the study is the prediction of the level of sea rise to be expected. In addition to the scenario possibilities illustrated in Table 1, there are some low-probability but high-impact scenarios, such as the melting of the Greenland ice sheets (Overpeck, 2006), which might change the assumptions with regard to the level of sea rise expected. However, to address this issue and to have a safety factor in the vulnerability analysis, the infrastructural elements situated at a higher elevation (i.e. between 2 and 4 m contours) have also been included.
Sea-level rise will probably occur with an increase in precipitation, flooding and storm events (IPCC, 2007) which, when combined, will most likely have a more extensive effect on the wastewater infrastructure than sea level alone. Extreme events like the ones presented by Mather et al. (2012), and their effects on the coastline (erosion and changes due to extreme wave action), have also not been considered in depth. Furthermore, the combined effect of sea-level rise and extreme wave events has also not been addressed in this study, nor has the increased probability of these events, and of increased storminess in general, been quantified. However, for vulnerability of pumping stations and wastewater works, some combined effects were partially considered: in particular, the effect of flooding and water ingress for the Point Road pumping station (including associated network) and the effect of marine scouring for the Central Wastewater Plant.
The interaction of wastewater infrastructure with other infrastructure has not been considered in this vulnerability assessment. For example, Cagno et al. (2011) showed that for underground infrastructure (including pipelines) a domino effect is possible, and risk and vulnerability has to be assessed in detail for interoperability. Sitzenfrei et al. (2011) investigated cascade vulnerability for risk analysis of water infrastructure and showed that breakdown of electric power and cascading events resulted in higher risks. These kinds of assessments were beyond the scope of the current study but should be pursued in the future.
Results and discussion
Individual results for the individual elements of the infrastructure have been generated, as has a composite vulnerability rating for the coastal operational areas of the wastewater system for the EMA.
Vulnerability of EMA's sewer pipelines and manholes
All pipelines and manholes situated below the 2 m contour lines were identified as being highly vulnerable because they are situated underground, at variable depths, and will be the first to be affected by raising groundwater tables and saline water infiltration into the non-saline water table. A rising water table will cause infiltration into sewer pipelines through joints and also water ingress through manholes, resulting in increased flows through the pipes. This increased flow can cause a backlog in the pipe and, with the capacity of pipes being exceeded, results in an overflow. It can also affect the hydraulic performance of pumps servicing these pipelines, since an increased flow, into pump stations not designed to handle this, will affect their performance. In addition, should saline water reach the pumping stations and wastewater treating infrastructure, it will cause serious damage to equipment not designed to withstand that exposure. From a system point of view these expected effects will cause reduced operational efficiency and might lead to design failure (as in the case of saline damage to equipment and sewage overflow into the stormwater drainage).
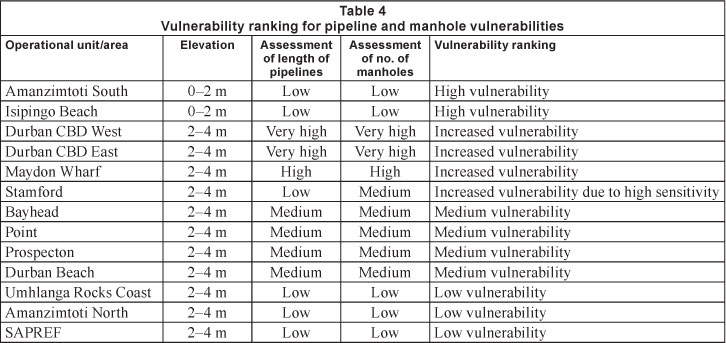
The sewer pipes and manholes located within the 2 to 4 m contour lines were also included in this vulnerability analysis. The degree of vulnerability for an operational area has been seen as a cumulative function of pipe lengths and the number of manholes (see Tables 2 and 3), with the reasoning that the more infrastructure there is, the higher the risk of some of this infrastructure being affected by rising water tables. The above factors have been considered and a vulnerability ranking, as presented in Table 4, was established for wastewater pipelines and manholes.
Figure 3 presents the geographical location of the areas considered vulnerable for sewage pipes and manholes.
The sensitivity of wastewater pipelines and manholes, in the operational areas presented in Table 4, has been investigated based on the past performance of this infrastructure. In the past there have been several occasions where the capacity of the wastewater pipelines has been exceeded and wastewater has overflowed into a stormwater channel. Unlike other cities (e.g. New York: Rosenzweig et al., 2007), in the EMA there are separate systems for wastewater and stormwater collection and the stormwater is discharged directly into the environment (i.e. river or Indian Ocean) without treatment. Therefore, the contamination of stormwater with sewage, in the EMA, poses a threat to human health and ecological systems. One particular area where wastewater has overflowed into stormwater channels on several occasions is the Somtseu Road (Stamford operational area) stormwater double culvert (Mather, 2010), which discharges into the Indian Ocean. This historical sensitivity increases the vulnerability of the Stamford operational area and it is recommended that a detailed study should be undertaken with the aim of upgrading existing sewer pipelines.
Vulnerability of EMA's pumping stations
Pumping stations are considered critical for the functioning of wastewater systems because they create the hydraulic head for wastewater to flow when discharge by gravity is not possible. The failure of a pump will result in major impacts for the network it services and might lead to system failure. In terms of vulnerability the pumping stations of the EMA's coastal areas were firstly investigated based on elevation. Three pumping stations positioned between the 0 and 2 m contour lines (i.e. Commercial Road, Baracuda Drive and Isipingo Beach pumping stations) were identified. These pumping stations were rated as highly vulnerable and the first to be affected by sea-level rise.
When considering the pumps positioned between 2 and 4 m elevation, a series of other pumping stations were identified, some of which have parts underground (below elevation level). To determine vulnerability, these pumping stations were further investigated in terms of capacity rating and connectivity and/or importance for the network they are servicing. The results of this analysis, together with the elevation of pumping stations and the final vulnerability ranking for each pumping station are presented in Table 5.
When classifying pump stations in terms of strategic importance for the network, they were individually investigated in terms of the area and the network they were servicing. Areas which produced industrial and residential wastewater were considered more important, since this wastewater is expected to carry industrial pollutants as well as biological contaminants (e.g. E. coli), and the effects of pumping failure and subsequent contamination would be more severe. The connectivity of a pump station (which to some degree overlaps with the size) was also investigated, since if a small pump station fails a smaller area with fewer connections would be affected. However, if a large pump station fails, a larger area with more connections would usually be affected. As a result of this analysis, the Point Road pumping station was singled out as being strategically most important, since it is the largest pump station with the highest capacity, connectivity and area served. In addition, this pump station extends 6 m underground. Therefore, this pumping station was considered to be the most sensitive and was investigated in more detail. With regard to the general sensitivity of the other pump stations, there have been no historical records of failure and most of them have been over-designed (i.e. they have been designed for a 10 to 20% higher pumping capacity than they are currently handling).
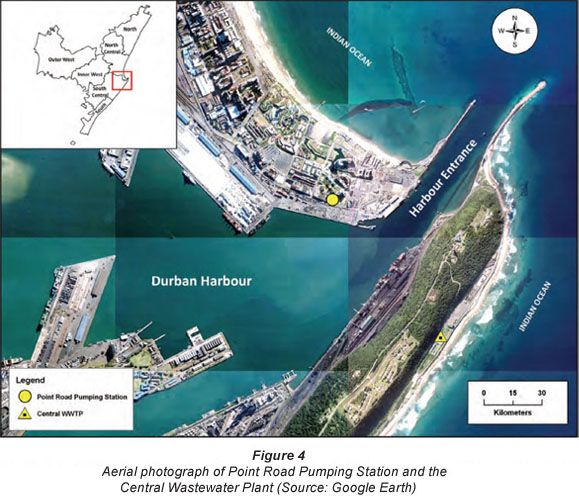
The Point Road pumping station is situated near the Durban Harbour and serves a large network, with industrial, commercial and residential sources of wastewater. It collects this water from many smaller pumping stations servicing the central and eastern areas of Durban, and pumps it underneath the harbour entrance to the Central Wastewater Plant (see Fig. 3). The main elements of this pumping station are 4 vertically mounted pumps, 4 motors (375 kW) mounted at ground level, 4 motor control systems, 1 shaft-driven pump, a 1 350 mm diameter inlet pipe, 2 mechanical screens on the inlet channel, 1 odour control system and 1 telemetry system (interrogates pump conditions). This pump station was designed to pump 1 000 l/s, pumping against a head of 18.28 m. This is a flow rate 15% greater than what is currently received. Because of this, the pumping station is expected to cope in the initial stages of sea-level rise, where the groundwater table is expected to rise and lead to infiltration into pipelines and manholes. This over-design will delay the overload and provide some time for adaptive measures to be planned and implemented. Therefore, a critical parameter to be monitored at this pumping station is the inflow. The increased water table may also affect the pumping station itself since it extends 6 m underground. One of the adaptive measures that is easy to apply, and can already be applied, is the strategic placement of vegetation around the pumping station to reduce the groundwater table in the immediate vicinity. Other more technical and specific adaptive measures would include the strengthening and waterproofing of the underground structure housing the station, the movement of electrical systems to a safer height, and the choice of corrosion-resistant parts with regular maintenance replacements. A more drastic adaptive measure would be to raise or move the pump station to higher ground; however, this is not envisaged with the predicted sea level rise of 2.8 m alone, but might have to be considered in the case of added cumulative effects.
Vulnerability of EMA's wastewater treatment plants
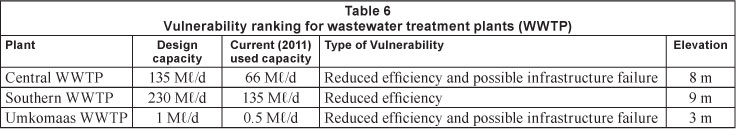
Wastewater treatment plants (WWTP) are key infrastructural elements and their vulnerability to sea-level rise has been investigated using the geographical location of the plant and elevation, as well as the functional elements which might lead to reduced operational efficiency, design failure and infrastructure failure. The three plants identified as vulnerable in the EMA are presented in Table 6, together with the type of vulnerability predicted to affect them as a result of sea-level rise.
The Central WWTP is ranked as the most vulnerable plant due to its geographical position. This plant is situated next to the beach and discharges the effluent through an outfall 3.2 km long, which has 18 diffusers at a depth of 43 to 53 m. Although the plant is situated at a higher elevation (8 m), it is built on a sand dune and the current high water mark is within meters of the boundaries of the site. It has previously been affected by large sea/wave events, which reduced its operational efficiency. If the sea level rises this WWTP will need increased pumping capacity to discharge the treated water in the Indian
Ocean, since the loss of pumping head will affect its efficiency. In addition to operational vulnerability, this plant might be exposed to more severe infrastructural failure, if slope failure due to wave action is taken into account. Therefore, immediate adaptive measures should start with the consolidation and protection of the site. This plant has also been recognised by the municipality as needing protection in the form of rock armouring or the construction of sea walls, as presented in the new draft water services development plan (EWSU, 2011). As a long-term adaptation measure, Mather and Stretch (2012) considered the possibility that, with increasing sea levels, the plant might have to be relocated to the inland side of the dune, with the discharge pipeline through the dune.
The second-ranked plant in terms of vulnerability is the Southern WWTP, which is situated away from the coast but discharges the treated wastewater to the sea through an outlet 4.2 km long, which has 34 diffusers at a depth of 54 to 64 m. The operational efficiency of the pumping required for this discharge will be affected by sea level rise, and more pumping capacity will be needed to discharge against an increased head. The Central and Southern WWTPs are two of the largest plants in the municipality and both are currently operating at less than the design capacity. This has advantages in terms of adaptation due to sea level rise, since in the initial stages of this process additional flows can be accommodated in both plants.
The Umkomaas WWTP is the most vulnerable due to its low elevation and proximity to the Umkomaas River and the associated estuary; however, it is a small plant and there are plans to close it down. A new WWTP is planned for the area and it will be situated further inland and at a higher elevation (EWSU, 2011). Therefore, if these plans go ahead, no other adaptive measures will be needed in this case.
Different adaptation approaches are needed for different coastal WWTPs in and around Durban. These range from diking/rock armouring to increasing capacity, to building a new, inland-located WWTP. For other coastal WWTPs, adaptation might include other actions; for example, adaptation might need increasing storage in order to discharge only at certain times, due to a changed tidal effect. In general, the aim of adaptation is to make the wastewater system more resilient to changing climates, and a case-by-case analysis needs to be undertaken for each WWTP. However, since the effects of changing climates are expected in the long-term future, adaptation should be incorporated in the regular cycles of infrastructure upgrading and in the design of new wastewater infrastructure. It would be un-economical to try to adapt infrastructure due for replacement in the next 10 to 20 years. Therefore, some of the adaptive measures do not need immediate intervention, but merely planning for such work. For example, setting aside land and putting plans in place for the construction of an inland WWTP to replace the Umkomaas WWTP, when needed, are the first steps for adaptation in this case. This kind of approach is more practical given the high level of uncertainty associated with changing climates and sea-level rise, and some work with regard to incorporating sea-level rise in local planning (see Mather, 2010) has been initiated. However, much more detailed studies are needed for specific, case-by-case adaptation measures for all individual infrastructural systems and their components.
Conclusions
The aim of this study was to investigate sea-level rise in a local context and to determine the vulnerability of the eThekwini Municipality wastewater infrastructure to such a hazard. In particular, this research aimed to identify infrastructural elements within the wastewater system which are most vulnerable to sea-level rise. According to studies on future climate change predictions, a sea-level rise of 2.8 m needs to be taken into consideration for the next 100 years. Based on this figure, a GIS analysis was done and 2 ranges of elevation were considered - the ranges between 0 and 2 m and between 2 and 4 m. All wastewater infrastructure located within these ranges was analysed and a vulnerability ranking was undertaken for the major components (i.e. pipelines and manholes, pumping stations and wastewater plants). In determining and ranking vulnerability, a general, conceptual model from the literature was used; however, this model was refined to suit the wastewater system and the local conditions.
With regard to the individual elements of the waste-water system of the municipality, the areas containing the most vulnerable manholes and pipelines were found to be the Amanzimtoti South and Isipingo Beach areas as well as two of the CBD areas (west and east) and Maydon Wharf. Other areas are also vulnerable, but to a lesser degree. There were 4 pumping stations with a high degree of vulnerability; however, the most vulnerable of these was considered to be the Point Road pumping station due to its size, connectivity and underground components. The most vulnerable wastewater treatment plant is considered to be the Central WWTP due to its geographical position and historical sensitivity. These elements should be monitored, in particular, for increases of inflow, and should be prioritised for adaptive measures.
Another important conclusion of this study is that the wastewater infrastructure in the municipality will be able to cope in the initial stages of sea-level rise when the coastal water table is expected to rise and cause increased ingress and flows into pipes, pumping stations and wastewater treatment plants. This is possibly due to the existing, unused capacity in the most affected pump stations and wastewater plants. For the eThekwini Municipality, this 'over-design' of infrastructure definitely gives resilience to the system, and is a good insurance policy in the case of some of the impacts expected due to sea-level rise. This will 'buy some time' before more specific adaptive measures are needed.
More studies are needed to link the effects of sea-level rise on the wastewater infrastructure with effects on other types of infrastructure and to investigate vulnerability due to this interoperability. This is particularly relevant for underground infrastructure.
Acknowledgements
The authors would like to gratefully acknowledge the help of the eThekwini Municipality personnel, in particular Mr Peter von Brandis and Mr Speedy Moodliar. Special thanks go to Prof CA Buckley from the Pollution Research Group, University of KwaZulu-Natal for facilitating this study and for proofreading the final document.
References
BABEL MS, PANDEY VP, RIVAS AA and WAHID SM (2011) Indicator based approach for assessing the vulnerability of freshwater resources in the Bagmati River Basin, Nepal. Environ. Manage. 48 1044-1059. [ Links ]
BURTON B, GU L and YIN YY (2005) Overview of vulnerabilities of coastally-influenced conveyance and treatment infrastructure in Greater Vancouver to climate change: Identification of adaptive responses. Proc. World Water and Environmental Resources Congress 2005, 15-19 May 2005, Anchorage, Alaska. [ Links ]
CAGNO E, DE AMBROGGI M, GRANDE O and TRUCCO P (2011) Risk analysis of underground infrastructure in urban areas. Reliab. Eng. Syst. Saf. 96 139-148. [ Links ]
CHUGTAI F and ZAYED T (2008) Infrastructure condition prediction models for sustainable sewer pipelines. J. Performance Constr. Facil. 2008 (September/October) 333-341. [ Links ]
CSIR (COUNCIL FOR SCIENTIFIC AND INDUSTRIAL RESEARCH) (2006) Climatic future for Durban. URL: http://www.csir.co.za (Accessed August 2010). [ Links ]
DANILENKO A, DICKSON E and JACOBSON M (2010) World Bank Water Working Notes - Climate change and urban water utilities: Challenges and opportunities. URL: http://www.wsp.org/wsp/sites/wsp.org/files/publications/climate_change_urban_water_chal-lenges.pdf (Accessed November 2011). [ Links ]
DEFRA (DEPARTMENT FOR ENVIRONMENT, FOOD AND RURAL AFFAIRS, UNITED KINGDOM) (2011) Climate resilient infrastructure: Preparing for a changing climate. URL: http://www.defra.gov.uk/publications/files/climate-resilient-infrastructure-full. pdf (Accessed June 2012). [ Links ]
EWSU (ETHEKWINI WATER AND SANITATION UNIT) (2004) Water services development plan: Volume 2. eThekwini Municipality, Durban, South Africa. [ Links ]
EWSU (ETHEKWINI WATER AND SANITATION UNIT) (2010) Sewage disposal charges - Effective 1 July 2010, URL: http://www. durban.gov.za/City_Services/water_sanitation/Services/Pages/luk.aspx (Accessed December 2011). [ Links ]
EWSU (ETHEKWINI WATER AND SANITATION UNIT) (2011) Draft water services development plan: eThekwini Municipality, Durban, South Africa (document published for public comment). URL: http://www.durban.gov.za/Resource_Centre/public_notices/Documents/Water%20Services%20 Development.pdf (Accessed November 2011). [ Links ]
FRIEDRICH E and TIMOL S (2011) Climate change and urban transport - A South African case study of vulnerability due to sea level rise. J. S. Afr. Inst. Civ. Eng. 53 (2) 14-22. [ Links ]
FONTAINE M and STEINEMANN A (2009) Assessing vulnerability to natural hazards: Impact-based method and application to drought in Washington State. Nat. Hazards Rev. 10 (1) 12-21. [ Links ]
KUNDZEWICZ ZW, MATA LG, ARNELL NW, DÖLL P, JIMENEZ B, MILLER K, OKI T, SEN Z and SHIKLOMANOV I (2008) The implications of projected climate change for freshwater resources and their management. Hydrol. Sci. J. 53 (1) 3-10. [ Links ]
MATHER A (2010) Stormy sea ahead: Planning for sea level rise. Proc. South African Planning Institution Conference, 18-20 April 2010, Durban, South Africa. [ Links ]
MATHER A and STRETCH DD (2012) A perspective on sea level rise and coastal storm surge from Southern and Eastern Africa: A case study near Durban, South Africa. Water 4 237-259. [ Links ]
METRO VANCOUVER AND KERR WOOD LEIDAL ASSOCIATES LTD (2008) Vulnerability of Vancouver sewerage area infrastructure to climate change - Final report. URL: http://www.metro-vancouver.org/planning/ClimateChange/ClimateChangeDocs/Vulnerability_climate_change.pdf (Accessed September 2011). [ Links ]
IPCC (INTERNATIONAL PANEL ON CLIMATE CHANGE) (2007) Chapter 6 - Coastal Systems and Low-Lying Areas. In: Parry ML, Canziani OF, Palutikof JP, Van der Linden PJ and Hanson CE (eds.) Contribution of Working Group II to the Fourth Assessment Report of the Intergovernmental Panel on Climate Change, 2007. Cambridge University Press, Cambridge, New York. URL: http://www.ipcc.ch/publications_and_data/ar4/wg2/en/contents.html (Accessed September 2011). [ Links ]
FUSSEL H-M (2009) Review and quantitative analysis of indices of climate change exposure, adaptive capacity, sensitivity and impacts, World Bank background note: Development and climate change, URL: http://siteresources.worldbank.org/INTWDR2010/Resources/5287678-1255547194560/WDR2010_BG_Note_Fussel.pdf (Accessed November 2011). [ Links ]
OVERPECK JT, OTTO-BLISNER BL, MILLER GH, MUHS DR, ALLEY RA and KIEHL JT (2006) Paleoclimatic evidence for future ice-sheet instability and rapid sea level rise. Science 311 (5768) 1747-1750. [ Links ]
ROSENZWEIG C, MAJOR DC, DEMONG K, STANTON C, HOERTON R and STULTS M (2007) Managing climate change risks in New York City's water system: Assessment and adaptation planning. Mitigation Adapt. Strategies Global Change 12 (8) 1391-1409. [ Links ]
SITZENFREI R, MAIR M, MÖDERL M and RAUCH W (2011) Cascade vulnerability for risk analysis of water infrastructure. Water Sci. Technol. 64 (9) 1885-1891. [ Links ]
STERR H (2008) Assessment of vulnerability and adaptation to sea-level rise for the coastal zone of Germany. J. Coastal Res. 24 (2) 380-393. [ Links ]
TITUS J, KUO C, GIBBS M, LAROCHE T, WEBB K and WADDELL J (1987) Greenhouse effect, sea-level rise and coastal drainage systems. J. Resour. Water Plann. Manage. 113 (2) 218-230. [ Links ]
Received 18 January 2012; accepted in revised form 3 October 2012.
* To whom all correspondence should be addressed. +27 31 260-7709; fax: +27 31 260-1411; e-mail: Friedriche@ukzn.ac.za

