


Services on Demand
Article
 English (pdf)
 Article in xml format
 Article references
Indicators

Related links
-
 Cited by Google
 -
 Similars in Google
Share

 Permalink
Water SA
On-line version ISSN 1816-7950
Print version ISSN 0378-4738
Water SA vol.38 n.5 Pretoria Jan. 2012
Natural organic matter (NOM) in South African waters: NOM characterisation using combined assessment techniques
TI NkambuleI; RWM KrauseI; J HaarhoffII; BB MambaI, *
IUniversity of Johannesburg, Department of Applied Chemistry, PO Box 17011, Doornfontein 2028, South Africa
IIUniversity of Johannesburg, Department of Civil Engineering Science, PO Box 524, Auckland Park 2006, South Africa
ABSTRACT
In order to remove natural organic matter (NOM) from water in a water treatment train, the composition of the NOM in the source water must be taken into account, especially as it may not necessarily be uniform since the composition is dependent on the local environment. The main thrust of this study was to ascertain whether a cocktail of characterisation protocols could help to determine the nature, composition and character of NOM in South African waters. The characterisation of South African water sources was done by sampling 8 different water treatment plants located within the 5 major source water types in South Africa. The NOM composition of all of the samples was first studied by applying conventional techniques (UV, DOC, SUVA and bulk water parameters). NOM characterisation was then further conducted using advanced techniques (BDOC, PRAM and FEEM), which were aimed at developing rapid assessment protocols. The FEEM and UV results revealed that the samples consisted mainly of humic substances with a high UV-254 absorbance, while some samples had marine humic substances and non-humic substances. The sample's DOC results were within the range of 3.5 to 22.6 mgl-1 C, which was indicative of the extent of variation of NOM quantities in the regions where samples were obtained. The BDOC fraction of the NOM ranged between 12 and 66%, depending on the geographical location of the sampling site. A modified PRAM was utilised to characterise the changes in NOM polarity in the water treatment process. PRAM results also indicated that the NOM samples were mostly hydrophobic. The composition and character of the NOM was found to vary from one water treatment plant to another. Combining conventional and advanced techniques could be a powerful tool for NOM characterisation and for extracting detailed information on NOM character, which should inform its treatability.
Keywords: Biodegradable dissolved organic carbon, disinfection by-products, fluorescence excitation-emission matrices, humic substances, natural organic matter
Introduction
The treatment of water containing natural organic matter (NOM) can result in persistent presence of carcinogenic chlorination disinfection by-products (DBPs), such as trihalomethanes (THMs) and haloacetic acids (HAAs), even in distribution networks. NOM is a mixture of organic compounds, having diverse chemical properties, which occur in all natural water sources as a result of the breakdown of animal and plant material (Kim and Yu, 2005). The prevalence of NOM in water remains a huge challenge for water supply companies and for municipalities responsible for distribution. Major drawbacks associated with NOM include the inhibition of precipitation precursors which form the backbone of drinking water treatment. NOM can also be responsible for a yellow-brownish colour, undesirable taste and odour of natural waters (Hepplewhite et al., 2004). NOM also promotes bacterial re-growth in the distribution system, by acting as a source of nutrients for heterotrophic bacteria, which compromises water quality. All of these problems, combined or individually, negatively affect human life and that of other aquatic organisms.
Since NOM emanates from different sources, it can be assumed that the composition of NOM in various water sources may not be uniform and characterisation studies are therefore necessary. NOM can be broadly categorised into humic substances (HS), microbial by-products and colloidal natural organic matter (Vanboon and Duffy, 2005). Humic substances constitute the more hydrophobic fraction of NOM and exhibit relatively high specific ultraviolet absorbance (SUVA) values since the humics usually contain a relatively large proportion of aromatic moieties (De Wuilloud et al., 2003).
Many authors have suggested that the character of NOM varies per geographic location of the raw water source (Coetzee et al., 2003, McArthur et al., 2004). Kim and Yu (2005) suggested that the character of NOM is also dependent on the climatic conditions of that particular region while Sulaymon et al. (2009) also proposed that the character of NOM per water source is dependent on the type of agricultural/industrial activities occurring in the surrounding catchment area. It is therefore crucial to study the NOM composition while taking into account the surrounding areas where such a study is being undertaken. Once the character of the NOM in the water source has been well defined, methods aimed at effectively removing the NOM from the water can then be developed. The high variability in the levels and composition of NOM in South African water sources in different regions implies that no single treatment process can be prescribed for each water treatment plant operating in the country. In order to remove NOM from water in a water treatment train, the composition of the NOM source must be taken into account, particularly as it might not necessarily be uniform since the composition is dependent on local environmental situations (Indiana, 2011). The need to characterise NOM before attempting to remove it is based on the fact that that its aromaticity, functional group distribution, molecular weight and elemental composition have a great influence on how NOM can be effectively removed from water (Nkambule et al., 2009).
The presence of NOM in drinking water sources may influence both the effectiveness of the employed water treatment methods and the quality of water in the distribution network. Therefore, methods which can effectively removing NOM from water are highly sought after, particularly in the early stages of the water treatment train. Among the different NOM removal processes, coagulation and/or enhanced coagulation are most commonly used. Owing to the challenges associated with the use of conventional techniques, new methods are always being developed to improve the existing methods applied in NOM characterisation and subsequent removal. Recently, the use of the polarity rapid assessment method (PRAM) has been researched and reported by Rosario-Ortiz et al. (2007). They reported that the polarity of NOM greatly influences its reactivity and can be used as a measure of chemical alterations during water treatment. The PRAM allows for the determination of the polarity of NOM under ambient conditions using a series of solid-phase extraction (SPE) sorbents with differing polarities. This allows for a rapid evaluation of NOM character; to the best of our knowledge, there are no other rapid analytical techniques available for simultaneously assessing the different polarities of the NOM and its constituents (Rosario-Ortiz et al, 2007). Therefore this study sought to use various techniques, together with the PRAM, as a technique for quickly assessing the composition and character of NOM, which should inform the extent to which water treatment packages can be applied in order to mitigate the production of DBPs. Knowledge of NOM fraction distribution in the water enables the water treatment practitioner to determine which are the problematic fractions and thus enables the development of methods to effectively remove the problematic NOM fractions present.
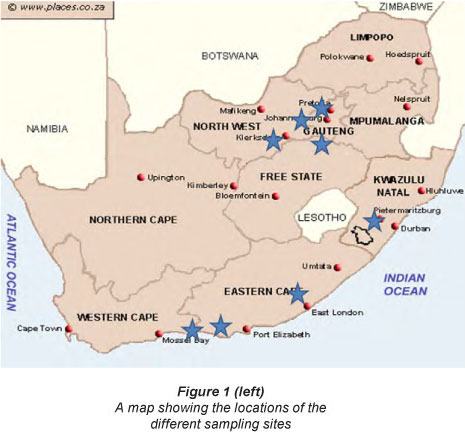
Large water treatment plants in South Africa rely almost entirely on surface water sources which are often compromised due to high return flows and indirect use. Water temperature is high, many surface water impoundments are eutrophic and NOM concentrations are high (> 5 mg-l-1) (Swartz et al., 2004). The primary objective of this study was thus to characterise the NOM occurring in South Africa through an extensive sampling of different water types, both as raw water and following certain treatment steps. Herein, we therefore report on NOM characterisation protocols and results obtained from 8 different water treatment plants in South Africa, representing the 5 major source-water types, namely:
Oligotrophic water; such as that from the Vaal Dam, supplemented by the Lesotho Highlands Water Project. This serves Rand Water, by far the largest water supplier in South Africa.
Montaigne water flowing eastwards from the Drakensburg and Amatola escarpments; utilised, for example, by Amatola and Umgeni Water. This water is fairly high in organic matter, but low in colour.
Highly coloured water; e.g. water found on the south-western coast that is very high in colour, usually from humic and fulvic substances.
Eutrophic water; found in many of the dams on the Highveld, with the eutrophication being determined by large return flows and agricultural run-off.
Treated sewage effluent; which dominates the NOM character of many streams and rivers in South Africa, especially during periods of low flow.
Experimental
Sample collection
Samples were collected from 8 different water treatment plants 3 times, at 2-month intervals. The eight different water treatment plants selected were: Olifantsvlei (O) Wastewater Treatment Plant north of Johannesburg (Johannesburg Water); Plettenberg Bay (P) Water Treatment Plant in the Southern Cape; Rietvlei (R) Water Treatment Plant of the Tshwane Metropolitan Municipality; Stilfontein (M) Water Treatment Plant of Midvaal Water; Wiggins (W) Water Treatment Plant of Umgeni Water, Vereeniging (V) Water Treatment Plant of Rand Water, Umzoniana (U) Water Treatment Plant of the Buffalo Metropolitan Municipality and Lourie (L) Water Treatment Plant of the Nelson Mandela Metropolitan Municipality. Table 1 shows the various sampling dates for the sampling rounds.

At each water treatment plant, 2 to 4 water samples were collected depending on the water treatment process employed at that particular plant. These were raw water samples (1), and water samples obtained before sand filtration (2) and after sand filtration (3). Olifantsvlei is a wastewater treatment plant, and only two samples were taken, i.e. before and after the maturation pond. Treated wastewater forms a great part of the return flow to many water sources in South Africa, hence the Olifantsvlei wastewater was characterised as a means to determine the type of NOM contributed by wastewater returns into water systems.
Bulk water characterisation
The pH, turbidity, conductivity and temperature of all samples were measured on site using a Hanna 98129 multi-meter. All of these parameters were measured from samples obtained at the various sampling sites for each plant.
Organic carbon analysis
The DOC analyses were carried out using a total organic carbon (TOC) analyser (Teledyne Tekmar, TOC fusion, which uses the UV/persulphate oxidation principle). Prior to analysis all samples were filtered through 0.45 μm filter paper. Herein, DOC is defined as the organic constituent that can pass through 0.45 μιm filter paper, while TOC is the measure of total organic carbon present in a water sample including the particulate organic carbon (POC). Standards of 1 mg-l-1, 5 mg-l-1, 10 mg-l-1, 20 mg-l-1 and 30 mg-l-1 carbon were prepared using potassium hydrogen phthalate (KHP) and de-ionised water and were then run prior to analysis of samples in order to calibrate the instrument.
Ultra violet-visible (UV-Vis) spectrophotometric analysis
A Shimadzu UV-2450 spectrophotometer was employed for further analysis of the samples at 4 UV wavelengths: 214 nm (indicative of nitrites and nitrates) (Narayana and Sunil, 2009); 254 nm (indicative of humic substances and aromatics) (Li et al., 2000); 272 nm (reported in the literature to be the best predictor of trihalomethane (THM) formation potential; Liu et al., 2006); and 300 nm (used by Rand Water and other treatment plants as a measure of DOC).
Specific ultraviolet absorbance analysis
The specific ultraviolet absorbance (SUVA) gives an indication of the amount of humic substances vs. non-humic substances in the NOM (Weishaar et al., 2003). SUVA can also be used to indicate the treatability of the water (Edzwald and Tobiason, 1999). The SUVA calculation requires both the DOC and UV measurement. The UV254 and DOC values were used to calculate the SUVA by applying Eq. (1):

Polarity rapid assessment method (PRAM)
The experimental conditions of this method have been reported and are discussed in detail by Rosario-Ortiz et al. (2007). The characterisation of NOM with PRAM is based on preferential adsorption of DOC fractions onto solid-phase extraction (SPE) sorbents. Three different types of sorbents were used.
Table 2 shows the different cartridges with the various types of sorbents used. The use of different SPE cartridges in parallel allows for a multidimensional characterisation of the polarity of NOM. Figure 2 shows the experimental setup, including the SPE cartridges used for this study.


The SPE cartridges were rinsed by flushing with deionised water until a steady UV254 signal was obtained (approximately 15 min) in order to remove any UV-absorbing organic residue on the SPE sorbent. The breakthrough was then measured by UV and DOC. The retention coefficient (RC) was defined as 1 minus the maximum breakthrough level achieved and describes the capacity of each SPE sorbent for specific NOM components (Rosario-Ortiz et al., 2007).
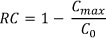
where:
C0 and Cmax refer to the initial sample concentration and maximum breakthrough concentrations, respectively.
The Modified PRAM
The Modified PRAM, instead of producing all 6 NOM fractions, only gives 3 fractions, and thus is a very rapid method of NOM characterisation. This method only results in the hydrophobic NOM fraction (HPO), the hydrophilic NOM fraction (HPI) and the transphilic NOM fraction (TPI). All three fractions provide good information for the characterisation of the NOM based on its composition, as these three fractions best represent the composition of the NOM with respect to its aromaticity.
In this modified method, the PRAM methodology was followed, the only exception being the use of only three SPE cartridges to collect the three fractions. The C18 cartridge is used to generate the hydrophobic (HPO) NOM fraction, the CN SPE cartridge elutes the hydrophilic (HPI) NOM fraction, and the NH2 SPE cartridge generates the transphilic (TPI) NOM fraction. Sufficient amounts of 0.1 M NaOH (approximately 10 ml) were used to elute the HPO and HPI fractions retained by the C18 and CN SPE cartridges, respectively; the TPI fraction was thus collected as the fraction that passes through the NH2 SPE cartridge, as shown in Fig. 3.

Fluorescence excitation emission matrices (FEEM) characterisation
The FEEM method is used as a technique for classifying and distinguishing between humic substances of various origins and nature (Chen et al., 2003). FEEM attempts to indicate the structural characteristics of NOM based on the UV absorption of molecular groups. A Perkin Elmer LS 45 Fluorescence spectrometer was used in combination with the UV-Vis spectrophotometer in NOM characterisation. The selected regions were chosen only as estimates and values slightly higher or lower than these can also be chosen. The chosen regions were as follows:
Excitation 250 nm, Emission 350 nm (aromatic proteins)
Excitation 280 nm, Emission 380 nm (soluble microbial by-products)
Excitation 250 nm, Emission 280 nm (humic acid-like organics)
Excitation 300 nm, Emission 400 nm (humic acids, hydrophobic acids)
Excitation 214 nm, Emission 400 nm (fulvic acid-like molecules)
Biodegradable dissolved organic carbon (BDOC) analysis
BDOC in drinking water is an indicator of bacterial re-growth potential in the distribution network. The method of analysis chosen is based on measuring the reduction of DOC over 6 days by bacteria fixed on biologically-active sand (BAS) (Hammes and Egli, 2005). The BDOC measurements were only carried out on the raw water samples. An inoculum of BAS, obtained from the Rietvlei Water Treatment Plant, was washed until there was no further release of DOC. This was achieved by washing the BAS 10 times or more with 500 ml rinsing solution (10 ml sodium thiosulphate solution, 0.1 M: 490 ml deionised). The DOC and UV content of the final washing were then measured to determine the background DOC and UV due to the sand. The inoculums were then rinsed with 100 ml of the raw water sample to be analysed, after which the solution was left to stand for 20 min to allow an acclimation of biomass to the water, before gently pouring it out.
A fixed weight of water sample (300 ml) and inoculated sand (100 g) were placed in clean Erlenmeyer flasks, aerated and kept at room temperature for 6 days. Each flask was covered with aluminium foil paper, to prevent any atmospheric interference in the condition of the bacteria and samples in the flask. The heterotrophic bacteria in the sand digest part of the carbon in the sample to get energy and at the same time consume the carbon in the sample. Daily measurements of the DOC concentration were taken until no further change in DOC was observed. BDOC was calculated as the difference between the initial DOC and the minimum DOC value reached. Three different solutions (5 mg-l-1, 8 mg-l1 and 10 mg-l1) of sodium acetate, prepared in de-ionised water, were prepared as controls and were analysed at the same time as the samples (under similar conditions to those of the samples) in order to monitor the activity of the bacteria in known concentrations of substrate. Sodium acetate was chosen because it is organic and has been widely used in many bacterial decay studies (Takundwa and Mvula, 2007). The fraction that does not undergo bio-degradation is referred to as the non-biodegradable dissolved organic carbon (NBDOC).
Results and discussion
Bulk water characterisation of samples
Eight water treatment plants were selected based on the various raw source water supply regions in South Africa. Table 3 gives the bulk characterisation of the water samples collected during the three sampling times.
The Plettenberg Bay (P) sample water is characteristic of the organically-coloured surface water found on the southwest coast og South Africa; its brownish colour is usually due to humic and fulvic substances. This is typified by high DOC values of the raw water (P1) samples (21.44 mg-l-1, 9.98 mg-l1 and 11.37 mg-l1 for the first, second and third sampling, respectively). The turbidity of the raw water samples is also high (ranging from 1.34 NTU to 99.8 NTU), indicative of a high content of colloids and clay particles.
The Wiggins (W) sample is characterised by Montaigne water flowing eastwards from the Drakensberg and Amatola escarpments. This water is generally low in colour, as indicated by the low DOC values of the raw water from this treatment plant (DOC = 3.75 mg-l-1, 3.20 mg-l-1, and 3.19 mg-l1 for first, second and third sampling, respectively).
The Olifantsvlei (O) samples are treated sewage effluent. These samples usually have very high DOC levels as confirmed by an average concentration of 9.00 mg-l1 DOC for all of these samples. They also have the highest turbidity values, indicative of high concentrations of colloids and clay particles. During the sampling periods, turbidity ranged from 0.56 NTU to as high as 114 NTU, indicative of the varying state of the water sources.
The Stilfontein (M) and Rietvlei (R) samples are characteristic of oligotrophic waters, supplemented by the water from the Lesotho Highlands Water Project. These samples had relatively similar amounts of DOC and turbidity throughout the sampling period, as can be seen from Table 3. The Vereeniging (V) water samples are oligotrophic, emanating from the Vaal Dam, and being mostly water from the Lesotho Highlands Water Project, which serves Rand Water, by far the largest water supplying company in South Africa. The NOM in this water type is characteristic of surface water from a reasonably well protected Highveld catchment with low return flows (Swartz et al., 2004). The Umzoniana (U) sample is water fed from the Bridle Drift Dam while the Lourie (L) sample is fed from a small impoundment, which is in turn supplied by the Churchill Dam.
It is worth noting that DOC removal efficiencies of all of the water treatment plants were relatively good, as can be seen from the 85% DOC removal efficiency at Plettenberg Bay. The lowest per cent DOC removals were noted at the Rietvlei (R) Water Treatment Plant, with an average per cent DOC removal of 25%. The character of NOM was found to have a direct influence on the NOM treatability by the various water treatment processes as evidenced by the varying percentage of DOC removal (35.2% to 88.1%) and UV254 (29.3% to93.8%) removal, depending on the nature and character of the NOM. It is also noteworthy that all of the water treatment plants distribute water to consumers that meets the South African National Standards (SANS), and in some instances the water even meets the stringent World Health Organisation (WHO) guidelines.
Ultra violet-visible (UV-Vis) spectrophotometric analysis
UV absorbance is usually measured at a wavelength of 254 nm (and reported in m-1), which is the wavelength used as an industrial standard for the maximum UV absorption of NOM samples. The absorption at this wavelength has been reported to represent the aromatic character of the organic species (Li et al., 2000). An increase in UV absorbance at 254 nm indicates that NOM is increasing in aromaticity and unsaturated carbon bonds (Cornelissen et al., 2008). In this study UV was also measured at 214 nm, 272 nm and 300 nm, for a more in-depth analysis of the NOM character. As mentioned previously, UV214 nm is indicative of nitrites and nitrates, UV272 nm has been reported in the literature as the best predictor of trihalomethane (THM) formation potential, (Liu et al., 2006) and UV300 nm is used locally (South Africa) by Rand Water and other treatment plants as a measure of DOC.
Figure 4, 5 and 6 show the various UV values at different wavelengths for the three sampling campaigns. From Figure 4, 5 and 6, it is clear that all of the samples generally exhibited high UV214, which implies that the samples contained nitrates and nitrites. The highest UV214 values were observed with the Olifantsvlei (O) samples, which was not unexpected, since this is a sewage effluent plant.


Figure 7 shows the average UV254 values for all of the samples in all three sampling rounds. The samples generally exhibit low UV254 values suggesting that they mostly contain non-humic substances. The highest UV254 absorbance recorded was for the Plettenberg Bay (P) sample, which was from a highly-coloured raw water source which was also high in humic substance content. The lowest UV254 was recorded for the Wiggins (W) samples, implying that these samples were characteristic of non-humic substances. It is also worth noting that there was a great decrease in the UV absorbance of the samples after each treatment step, indicating the effectiveness of the water treatment methods employed for NOM removal (potentially a secondary consequence of the treatment technology employed). For the highly-coloured water from Plettenberg Bay (Rounds 1, 2 and 3), the fractions of NOM removed by UV were 78%; 88% and 83% (average of 83%).The O samples were taken before and after the maturation ponds, following wastewater treatment with biological nitrogen and phosphorus removal. The UV254 removal by the maturation ponds during Rounds 1 to 3 was 14%; 4%; 3% and 7%, with an average of 7%. This shows a small, but consistent removal of UV254. At Treatment Plant R, there was a full-scale GAC filtration plant following sand filtration. The three available values indicated that the removal of the raw water UV254 was 13%; 19% and 24%, with an average of 19%.

Specific ultraviolet absorbance analysis
SUVA is calculated by dividing the UV-absorbance of the sample at 254 nm (cm-1) by the DOC of the sample (mg-l-1) and then multiplying by 100 mg-m. It is a method used to determine the relative aromaticity of the humic fraction (Weishaar et al., 2003). Generally a SUVA value of above 4 is considered to represent high aromatic content, i.e. humic substances, while a SUVA value of below 2 depicts a low aromatic content, i.e. non-humic substances. Table 4 gives the various SUVA values for all of the samples analysed during the different sampling campaigns.

Only the Plettenberg Bay (P) samples exhibited SUVA > 4 l-mg-1-m-1, implying that these were the only samples that were predominantly composed of highly aromatic humic substances. The other samples (R, M, O, L, V, U and W) had SUVA < 4 lmg-1-m-1, for the first and second round of sampling, indicating that these samples contained non-humic substances. However, during the third round of sampling, these samples had SUVA values of greater than 2 lmg-1-m-1, but still less than 4 l-mg-1-m-1, which meant that the samples had slightly aromatic NOM but were still not as highly aromatic as the Plettenberg Bay (P) samples. For the P samples, the SUVA values were greater than 4 l-mg-1-m-1, which represents an excellent level for the achievement of 60% to 80% removal by coagulation, as proposed by Edzwald and Tobiason (2010), and indicated that the NOM found in the P waters was highly aromatic and hydrophobic in nature. The SUVA values for the rest of the water types for all sampling campaigns were less than 4 l-mg-1-m-1, which could mean that these waters were characterised by a mixture of aquatic humic and non-humic matter. Such waters are also amenable to coagulation, and approximately 40% to 60% removal of NOM can be achieved (Edzwald and Tobiason, 2010). Thus only one of the samples (P) is in the high SUVA range, where good removal with enhanced coagulation (EC) can be expected. Two samples (O and W) are in the low range where EC is not expected to do well at all, with the remaining five in the intermediate range.
PRAM characterisation
According to Marhaba and Van (2000), the chemical description of the HPO, HPI and TPI NOM fractions obtained after PRAM is given as follows:
Hydrophobic (HPO): These are carboxylic acids of 5 to 9 carbons, 1- and 2-ring aromatic carboxylic acids, aromatic acids, 1- and 2-ring phenols and tannins, proteins with 1-and 2-ring aromatic amines except for pyridine and high-molecular-weight alkyls.
Hydrophilic (HPI): Aliphatic acids of less than 5 carbons, hydroxyl acids, sugars, low-molecular-weight alkyl monocarboxylic acids and dicarboxylic acids, amphoteric proteinaceous materials containing amino acids, amino sugars, peptides and proteins.
Transphilic (TPI): A mixture of hydrocarbon and carboxyl compounds, aliphatic amides, alcohols, aldehydes, esters, polysaccharides and ketones with less than 5 carbons.
The hydrophilic fraction has more affinity for water and is composed mainly of low molecular weight carbohydrates, proteins and amino acids. The hydrophobic fraction has less affinity for water making it more soluble in organic solvents, and consists mainly of humic and fulvic acids. Figure 8 and 9 show the PRAM distribution of the NOM fractions of the P1 and R1 samples over the three rounds of sampling. As previously discussed, in earlier sections, the P samples had mostly hydrophobic NOM and it can thus be concluded from Figure 8 that a large fraction of the NOM sample was the HPO. This finding is in agreement with earlier results where the NOM samples from the Plettenberg Bay (P) Water Treatment Plant were found to contain hydrophobic NOM, which was mainly humic substances.

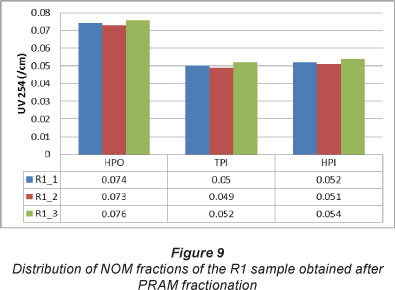
The Rietvlei (R) samples, on the other hand, had almost equal distribution of the different NOM fractions, as can be seen in Figure 9. There is almost a 50%:50% spread between the TPI and the HPI fraction, with slightly higher amounts of the HPO fraction.
DOC-fraction distribution varied substantially depending on the type of source water and type of treatment processes employed. At a particular plant, it was found that the HPO fraction in NOM from several of the P samples was the most dominant, ranging from 32-74% in DOC, whereas the TPI appeared to be the second most abundant fraction, constituting 3-28% of the total NOM in samples from the other water treatment plants. This detailed fractionation of NOM should provide information to water treatment practitioners about the dominant fraction in the NOM, thus enabling them to employ appropriate treatment methods. If, for example, a particular NOM fraction indicates a high THM formation potential, such a fraction should be removed before disinfecting the water with chlorine.
A study by Bursill (2001) revealed that low molecular weight fractions of NOM (TPI and HPI) are less effectively removed by coagulation (using ferric chloride), and it is this fraction which seems to be responsible for reducing the effectiveness of activated carbon, and for promoting bacterial regrowth. Since most of the samples had high levels of the low molecular weight NOM (low molecular weight hydrophilic's as seen by the low SUVA values of most samples), it means that the NOM cannot be effectively removed by coagulation thus indicating the need for enhanced coagulation. Compared to conventional coagulation processes, enhanced coagulation imposes strict control of pH, to lower levels, and also encourages the use of higher doses of traditional coagulants. For enhanced coagulation to be effective, the entities to be removed (NOM and turbidity), the bulk water parameters (pH, alkalinity and hardness), and the type of coagulant to be used must be taken into account. Higher TOC values and low alkalinity in raw water cause a high TOC removal percentage to be attained and vice versa (Freese et al., 2001; USEPA, 1999). NOM fractions exhibit different properties and require different coagulants with respect to enhanced coagulation. Generally, waters containing high molecular weight hydrophobic fractions are more amenable to coagulation than waters with low molecular weight hydrophilic fractions (Eikebrokk et al., 2006). These findings correlate well with the study by Bursill (2001).
Fluorescence excitation emission matrices (FEEM) characterisation
The FEEM method is used as a technique for classifying and distinguishing between humic and non-humic substances from various sources. It is often used as a 'discrimination tool', i.e. it differentiates between humic-like substances (fulvic acids, humic acids and humin) and other NOM components (Weishaar et al., 2003). The principle of FEEM is the capability of a molecule to absorb light at a certain wavelength and to emit light of another wavelength depending on the specific molecular bonds (Hua et al., 2007, Fu et al., 2007). In most cases, the absorption/ emission wavelength pair is different for different groups of molecules, which makes it possible to fingerprint aromatics relative to carbohydrates. Figures 10 to 12 show the results obtained for the Ρ samples at different excitation-emission wavelengths. As seen in Figs. 10 to 12, the P samples have a very broad peak occurring at 420 nm to 500 nm, with a maximum intensity occurring at 600 nm. This peak is indicative of hydrophobic acids, humic and humic acid-like substances. At a different excitation, the P sample again had broad peaks occurring at 580 nm and 680 nm (Fig. 11). This peak can be assigned to microbial byproducts such as tryptophan-like and fulvic acid components.
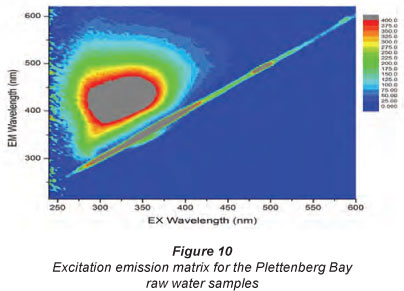


The results obtained for the other samples indicate that the samples had low aromatic content, i.e. low humic substances as shown by the narrow peaks or no peaks at positions where peaks for humic substances would be expected. The results were also in agreement with the calculated SUVA values, which suggest that only the Plettenberg Bay samples contained high amounts of hydrophobic NOM.
Lapworth et al. (2008) points out that water with high humic substance content is relatively easy to treat and even predicts that up to 70% TOC reduction of these types of waters is possible using conventional water treatment techniques. This assertion confirms the high percentage reduction of DOC on water samples obtained from Plettenberg Bay, as previously demonstrated.
Biodegradable dissolved organic carbon (BDOC) analysis
From a microbial perspective, the aim of drinking water treatment is to eliminate all pathogenic bacteria and to minimise the presence and potential regrowth of heterotrophic bacteria in the distribution system. Such regrowth can give rise to biofilm formation in pipelines which in the long run causes operational problems such as bio-fouling and bio-corrosion (Hammes and Egli, 2005). Microbial regrowth can also adversely affect taste and odour of water and can even lead to potential health hazards caused by pathogenic proliferation.
The BDOC gives a ratio of the biodegradable dissolved organic carbon content of any sample vs. the non-biodegradable dissolved organic carbon content of that sample. Figure 13 shows the average BDOC results for the water samples for all three rounds of sampling.

The percentage DOC removal achieved for the samples ranged between 20% and 65%. The highest percentage removal was noted for the P sample (65%) and the least for the W and M samples (20%). It has been reported by Volk et al. (2000), that water with a high concentration of humic substances easily undergoes biological biodegradation as confirmed by the highest % BDOC removal being achieved for the P samples, which are highly-coloured waters with a high concentration of humic substances. The lower % DOC removal was noted in the water that has low SUVA values (implying low humic substances content).
It is striking that 3 sites (L, U and V) showed very little variation throughout the sampling period, with values constantly between 50% and 60%. These waters come from large impoundments with minimal return flows to their catchments. The other samples show much higher variability - it is noted that these samples are taken from rivers, impoundments with high return flows, or from a wastewater treatment plant. The surprising observation is that the upper end of each range is also roughly in the region of 50% to 60% (site W is lower), but that the large variance is towards the lower end of the ratio, where the biodegradable fraction is lower.
The most commonly used measure for the biodegradable content of NOM in water samples is the assimilable organic carbon (AOC), which is low molecular weight dissolved organic carbon that can easily be utilised by bacteria leading to growth. Previous studies have already related the concentration of AOC in water to heterotrophic regrowth (Van der Kooij, 1992). More work is currently being done to assess the fate of the BDOC of the NOM during water treatment. This should make it possible to assess the bacterial regrowth potential after water has been treated.
Summary of results
Conventional (industrial) techniques for the characterisation of the bulk properties of NOM in the samples were applied: ultra-violet (UV) analysis, dissolved organic carbon (DOC) analysis, specific ultra violet absorbance (SUVA) measurements and the study of bulk water properties such as pH, turbidity, conductivity, temperature, hardness and analysis of ions. UV, DOC and SUVA results indicated that the P samples were highly aromatic in nature as they had SUVA values greater than 4 l-m-1-mg-1, while the rest of the samples were less aromatic with SUVA less than 4 l-m-1-mg-1. The turbidity of the water samples was used as an indicator of the amount of clay particles. The samples were found to have varying turbidities, with the V samples having very high turbidity values (up to 99.8 NTU) and the W water having low turbidity values (as low as 1.0 NTU). The bulk water parameters also revealed the character of the NOM. The hardness of the sampled water could be grouped into 3 categories -low hardness (L, P, V, W), medium hardness (O, R, U) and high hardness (M). The colour level in the samples from the coastal river in the Southern Cape was extremely high (P), while water from the L samples showed medium colour levels. The others samples had typical colour values, with the water from the Drakensberg escapement having very low colour levels.
The use of advanced NOM characterisation techniques gave further insight into the composition and character of NOM in the samples. This was done through fluorescence excitation emission matrices (FEEM), dissolved biodegradable organic carbon (BDOC) analysis and the modified polarity rapid assessment method (PRAM). FEEM indicated that all of the samples had hydrophobic acids, humic and humic-like material but in varying proportions, with the P samples having the highest concentrations of these while the W sample contained the lowest amounts of humic substances. The P, O1, O2 and V samples had significantly high intensities of humic-like NOM. The FEEM characterisation also revealed that the W samples across all sampling rounds had fairly stable amounts of soluble microbial-like NOM. The BDOC results indicated that the percentage DOC removal ranged between 20% and 65%, with the highest removal noted for the P samples and the lowest for the W and M samples. The lower percentage DOC removal was noted in water that had low SUVA values (implying low amounts of humic substances). The modified PRAM was used in the fractionation of NOM. The PRAM fractionation showed that DOC-fraction distribution varied substantially depending on the source water and type of treatment process employed, when one considers samples taken from the treatment train. For the P samples the hydrophobic (HPO) fraction was the most dominant, ranging from 32-74% in DOC, whereas the transphilic (TPI) fraction appeared to be the second most abundant fraction, constituting 3-28% of the total NOM in the samples. The other sampling sites had an almost equal spread between the TPI and the hydrophilic (HPI) fraction, with slightly higher amounts of the HPO fraction.
The highest DOC removal (85%) was achieved at the P water treatment plant, which had highly humic and coloured water. For the P water UV254 removal ranged from 78% to 88% with an average of 83%. For the O samples the UV254 removal by the maturation ponds ranged from 3% to 14% with an average UV254 removal of 7% while the other plants had an average UV254 removal of 19%.
Conclusions
The study has highlighted the importance of characterising NOM in water so that appropriate treatment protocols can be applied. Due to the fact that the composition of NOM changes as a result of weather and climatic influence, a rapid method for determining the components of NOM at any given time is crucial, so that adjustments to the treatment procedures can be made. This should inevitably reduce the formation of disinfection by-products when disinfecting the water with chlorine. The BDOC of the samples covered a broad range, from a minimum of 20% up to a maximum of 65%. The FEEM results show that the P samples had very broad peaks for hydrophobic acids across all rounds of sampling. The results also indicate that the P samples had high amounts of hydrophobic NOM. The results obtained for the other samples indicate that the samples had low aromatic content, i.e. low humic substances as shown by the narrow peaks or the absence of peaks where peaks for humic substances would be expected. The fractionation of NOM by PRAM varied substantially depending on the type and source of water. The P samples had a greater percentage of the HPO fraction and a lesser but equal percentage of the HPI and TPI fraction. The R samples had an almost equal distribution of the HPO, TPI and HPI fractions while the other samples had low percentages of HPO fraction and slightly higher percentages of TPI and HPI NOM fractions. In summary, the average removal of UV254 was 7% by maturation pond, 83% by coagulation and settling (highly coloured water) and 6% by sand filtration. The sampling programme did provide a useful and coherent profile of the raw waters investigated.
Acknowledgements
The authors are grateful for funding received from the National Research Foundation (NRF) of South Africa, the Water Research Commission (WRC) of South Africa, the Department of Science and Technology/Mintek's (DST/Mintek's) Nanotechnology Innovation Centre (NIC) and the University of Johannesburg.
References
BURSILL D (2001) Drinking water treatment - understanding the processes and meeting the challenges. Water Sci. Technol.: Water Supply 1 (1) 1-7. [ Links ]
CHEN J, LE BOEUF EJ, DAI S and GU B (2003) Fluorescence spectroscopic studies of natural organic matter fractions. Chemosphere 50 639-647. [ Links ]
COETZEE PP, COETZEE LL, PUKA R and MABENGA S (2003) Characterisation of selected South African clays for defluoridation of natural waters. Water SA 29 (3) 331-341. [ Links ]
CORNELISSEN ER, MOREAN N, SIEGEN WG, ABRAHAMSE AJ, RIETVELD LC, GRAFTE A, DIGNUM M, AMY G and WESSELS LP (2008) Selection of anionic exchange resins for removal of natural organic matter (NOM) fractions. Water Res. 42 (1-5) 413-423. [ Links ]
DE WUILLOUD JC, SADI BB, WULLOUD RG and CARUSO JA (2003) Trace humic and fulvic acid determination in natural water by cloud point extraction/pre-concentration using non-ionic and cat-ionic surfactants with FI-UV Detection. The Analyst 128 453-458. [ Links ]
EIKEBROKK B, VOGT RD and LILTVED H (2004) NOM increase in Northern European source waters: discussion of possible causes and impacts on coagulation/contact filtration process. Water Sci. Technol.: Water Supply 4 (4) 47-54. [ Links ]
EDZWALD JK and TOBIASON JE (2010) Chemical principles, source water composition, and watershed protection (Chapter 3). In: Edzwald JK (ed.) Water Quality and Treatment: A Handbook on Drinking Water (6th edn.). AWWA and McGraw-Hill, New York. [ Links ]
EDZWALD JK and TOBIASON JE (1999) Enhanced coagulation: USA requirements in a broader view. Water Sci. Technol. 40 (9) 63-70. [ Links ]
FU P, WU F, LIU C, WANG F, YUE L, LI W and GUO Q (2007) Fluorescence characterization of dissolved organic matter in an urban river and its complexation with Hg(II). Appl. Geochem. 22 1668-1679. [ Links ]
FREESE SD, NOZAIC DJ, PRYOR MJ, RAJOGOPAUL R, TROLLIP DL and SMITH RA (2001) Enhanced coagulation: a viable option to advance treatment technologies in the South African context. Water Sci. Technol.: Water Supply 1 (1) 33-41. [ Links ]
HAMMES FA and EGLI T (2005) New method for assimilable organic carbon determination using flow-cytometric enumeration and a natural microbial consortium as inoculum. Environ. Sci. Technol. 39 3289-3294. [ Links ]
HEPPLEWHITE C, NEWCOMB G and KNAPPE DRU (2004) NOM and MIB, who wins in the competition for activated carbon adsorption sites? Water Sci. Technol. 4 257-267. [ Links ]
HUA B, VEUM K, KOIRALA A, JONES J, CLEVENGE T and DENY B (2007) Fluorescence fingerprints to monitor total trihalomethanes and N-nitrosodimethylamin formation potential in water. Environ. Chem. Lett. 5 73-77. [ Links ]
INDIANA G (2011) Removal of natural organic matter to reduce the presence of trihalomethanes in drinking water. School of Chemical Science and Engineering, Royal Institute of Technology, Sweden. ISBN: 978-91-7415-856-4. [ Links ]
KAPLAN LA, BOTT TL and REASONER DJ (1993) Evaluation and simplification of assimilable organic carbon nutrient bioassay for bacterial growth in drinking water. Appl. Environ. Microbiol. 59 (5) 1532-1539. [ Links ]
KIM H and YU M (2005) Characterization of natural organic matter in conventional water treatment processes for selection of treatment processes focused on DBPs control. Water Res. 39 4779-4789. [ Links ]
KIM HC, YU MJ and HAN I (2006) Multi-method study of the characteristic chemical nature of aquatic humic substances isolated from the Han River, Korea. Appl. Geochem. 21 1226-1239. [ Links ]
NARAYANA B and SUNIL K (2009) A spectrophotometric method for the determination of nitrate and nitrite. Eurasian J. Anal. Chem. 4 (2) 204-214. [ Links ]
NKAMBULE TI, KRAUSE RW, MAMBA BB and HAARHOFF J (2009) Removal of natural organic matter from water using ion-exchange resins and cyclodextrin polyurethanes. Phys. Chem. Earth 34 812-818. [ Links ]
LAPWORTH DJ, GOODDY DC, BUTCHER AS and MORRIS BL (2008) Tracing groundwater flow and sources of organic carbon in sandstone aquifers using fluorescence properties of dissolved organic matter (DOM). Appl. Geochem. 23 3384-3390. [ Links ]
MARHABA TF and VAN D (2000) The variation of mass and disinfection by-product formation potential of dissolved organic matter fractions along a conventional surface water treatment plant. J. Hazardous Mater. A74 133-147. [ Links ]
McARTHUR JM, BANERJEE DM, HUDSON-EDWARDS KA, MISHRA R, PUROHIT R, RAVENSCROFT P, CRONIN A, HAWARTH RJ, CHATTERJEE A, TALUKDER T, LOWRY D, HOUGHTON S and CHADHA DK (2004) Natural organic matter in sedimentary basins and its relation to arsenic in anoxic ground water; the example of West Bengal and its worldwide implications. Appl. Geochem. 19 1255-1293. [ Links ]
ORHON D, OKUTMAN D and INSEL G (2002) Characterisation and biodegradation of settleable organic matter for domestic wastewater. Water SA 28 (3) 299-307. [ Links ]
ROSARIO-ORTIZ FL, SNYDER S and SUFFET IH (MEL) (2007) Characterization of the polarity of natural organic matter under ambient conditions by the polarity rapid assessment method (PRAM). Environ. Sci. Technol. 41 (14) 4895-4900. [ Links ]
SULAYMON A H, ALI AM and AL-NASERI S K (2009) Natural organic matter removal from Tigris river water in Baghdad, Iraq. Desalination 245 155-168. [ Links ]
SWARTZ CD, MORRISON IR, THEBE T, ENGELBRECHT WJ, CLOETE VB, KNOTT M, LOEWENTHAL RE and KRUGER P (2004) Characterisation and chemical removal of organic matter in South African coloured surface waters. WRC Report No. 924/1/03. Water Research Commission, Pretoria. [ Links ]
TAKUNDWA M and MVULA E (2007) Development of an analytical technique for the determination of biodegradable dissolved organic carbon in water, BDOC. 4th year project report, B.Sc. (Biology), University of Namibia, Windhoek. [ Links ]
USEPA (UNITED STATES ENVIRONMENTAL PROTECTION AGENCY) (1999) Enhanced Coagulation and Enhanced Precipitative Softening Guidance Manual. EPA 815-R-99-012 May. United States Environmental Protection Agency, Washington. [ Links ]
VANBOON GW and DUFFY SJ (2005) Environmental Chemistry: A Global Perspective (2nd edn.). Oxford University Press, New York. 257-320. [ Links ]
VAN DER KOOIJ D (1992) Assimilable organic carbon as indicator of bacterial regrowth. J. Am. Water Works Ass. 84 (2) 57-65. [ Links ]
VOLK C, BELL K, IBRAHIM, VERGES, AMY G and LECHE-VALLIER M (2000) Impact of enhanced and optimized coagulation on removal of organic matter and its biodegradable fraction in drinking water. Water Res. 34 (12) 3247-3257. [ Links ]
WEISHAAR JL, AIKEN RG, BERGAMASCHI BA, FRAM MS, FUJII R and MOPPERS K (2003) Evaluation of specific ultraviolet absorbance as an indicator of the chemical composition and reactivity of dissolved organic carbon. Environ. Sci. Technol. 37 4702-4708. [ Links ]
Received 30 January 2012; accepted in revised form 10 October 2012.
* To whom all correspondence should be addressed. +27 11 559-6516; fax: +27 11 559-6425; e-mail: bmamba@uj.ac.za

