


Services on Demand
Article
 English (pdf)
 Article in xml format
 Article references
Indicators

Related links
-
 Cited by Google
 -
 Similars in Google
Share

 Permalink
Water SA
On-line version ISSN 1816-7950
Print version ISSN 0378-4738
Water SA vol.38 n.5 Pretoria Jan. 2012
Using multivariate statistical analysis to assess changes in water chemistry in sections of the Vaal Dam catchment between 1991 and 2008
Theresa L Bird*; Mary C Scholes
School of Animal, Plant and Environmental Sciences, University of the Witwatersrand, Johannesburg, Private Bag X3, Wits 2050, South Africa
ABSTRACT
Multivariate statistical analysis was used to investigate changes in water chemistry at 5 river sites in the Vaal Dam catchment, draining the Highveld grasslands. These grasslands receive more than 8 kg sulphur (S) ha-1-year-1 and 6 kg nitrogen (N) ha-1-year-1 via atmospheric deposition. It was hypothesised that between 1991 and 2008 concentrations of dissolved mineral salts, sulphate, nitrate and ammonium would increase as a result of the S and N deposition received. Significant spatial differences were found, by analysis of covariance, between sites within the catchment. Canonical correspondence analysis (CCA) showed that the environmental variables used in the analysis, discharge and month of sampling, explained a small proportion of the total variance in the data set - less than 10% at each site. However, the total data set variance, explained by the 4 hypothetical axes generated by the CCA was >93% for all 5 sites. Sulphate, nitrate-plus-nitrite, ammonium and phosphate concentrations increased at 1 site each, between 1991 and 2008. Over the same time frame, acid-neutralising capacity was decreased significantly at 1 of the 5 river sites. The concentrations of the ions analysed, with rare exception, were within the limits set by the national drinking water guidelines, between 1991 and 2008. Nitrogen and sulphur concentrations at the five selected river sites within the Vaal Dam catchment did not show a statistically significant increase between 1995 and 2008.
Keywords: Highveld grasslands, atmospheric sulphur and nitrogen deposition, sulphate, nitrate-plus-nitrite, acid neutralising capacity, dissolved major salts, multivariate statistics
Introduction
The Vaal Dam and Vaal Barrage supply Gauteng, and beyond, with water for domestic and industrial use. The catchment for these reservoirs covers the Highveld grasslands. Sulphur (S) and nitrogen (N) are deposited in the catchment as a result of the clustering of coal-fired power stations and other industrial activities. Atmospheric deposition ranges between 1 and >35 kg S-ha1-year1 and 1 and >15 kg N-ha1-year1 over the Highveld, generally, with sites near stationary point sources receiving more than double these amounts (Blight et al., 2009; Collett et al., 2010). These quantities are comparable with industrialised sites elsewhere in the world (Dovland and Pederson, 1996: 5 to 15 kg N-ha-1year1; and, more recently, Dentener et al., 2006: 10 to 70 kg S-ha-1year1) where the impacts have resulted in disturbed ecosystem services (for example, the review of the eastern USA by Lovett et al., 2009). Disturbances to ecosystem functioning occur after deposition of S and N compounds and include acidification of soils and waters affecting the chemical cycling processes, and can be harmful to biota within these ecosystems (Wellburn 1994). International studies with regard to impacts on aquatic systems have investigated changes in concentrations of S, N, aluminium (Al), alkalinity, base cations, and changes in pH (Baron et al., 2000; Evans et al., 2001; Kernan and Helliwell, 2001; Wright et al., 2001; Cooper, 2005; Kowalik et al., 2007; Baron et al., 2009; Oberholster et al., 2011).
The levels of deposition to the Highveld generally, and the Vaal Dam catchment specifically, prompted concern that the catchment would show elevated salt concentrations as a result of S deposition and inputs of S and other ions transferred from soil storage pools into rivers via runoff (Taviv and Herold, 1989). Elevated salt concentrations have the potential to reduce irrigated crop production (Van Rensburg et al., 2008) and cause eutrophication (Roos and Pieterse, 1995). The economic cost of purification of salt-enriched water to industrial requirements is an additional concern (Urban Econ., 2000). As a result of abstraction for domestic, industrial and irrigation use, and subsequent return flow, salt concentrations are already problematic in the middle and lower Vaal River system (below the Vaal Dam) where water is abstracted for irrigated crop agriculture (Braune and Rogers, 1987; Roos and Pieterse, 1995; Van Rensburg et al., 2008). Although mine effluent is a major contributor to salinity, increased salt concentrations as a result of atmospheric S and N deposition may be impacting the Vaal River system and ecosystem services further downstream than where the deposition is received.
Subsequent to the concern raised by the modelling study of Taviv and Herold (1989), Fey and Guy (1993) investigated the capacity of the major soil types of the Vaal Dam catchment to retain SO42-. Their methods included the textural and chemical characterisation of the soils, as well as 3 methods for assessing SO42- adsorption. They found that the retention capacity over most of the catchment was low (Fey and Guy, 1993). More recent assessment showed that the soils of the central Highveld grasslands, which also form the central region of the Vaal Dam catchment, are well buffered against deposition inputs; however, soils on the eastern and southern boundaries of the Highveld grasslands may be more sensitive (Bird, 2011). Huizenga (2011) showed that the salt balance of the Vaal River catchment was strongly influenced by SO42-, suggesting anthropogenic activities as the cause, including coal and gold mining, atmospheric SO42- deposition and the use of fertilisers that include gypsum.
This study quantified the changes of water quality variables at 5 sites in the Vaal Dam catchment between 1991 (when Fey and Guy (1993) sampled) and 2008, using multivariate statistics to assess the change in water chemistry under elevated S and N deposition rates.
Experimental
The South African Department of Water Affairs (DWA) water quality network and database was accessed for the long-term record of the regularly measured major chemical compounds. Results of the analysis of water samples are accessible via the Water Management System (WMS) (http://www.dwa.gov.za/ iwqs/wms/data/000key.asp). Five river water quality monitoring stations in the Upper Vaal Management Area were selected for the current investigation. Four of the five sites were located in the C1 secondary catchment (C1H004, C1H008, C1H019, and C1H027) and one site in the C8 secondary catchment (C8H005) (Fig. 1).
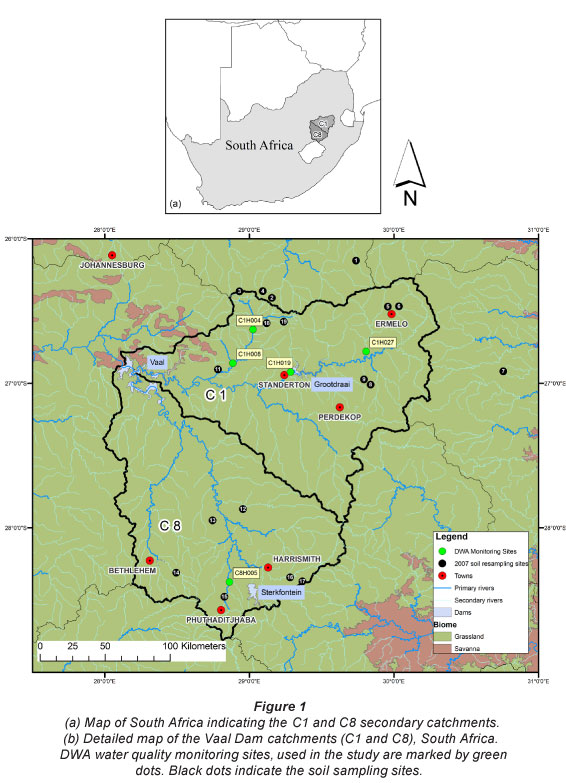
The WMS database includes records for many river quality monitoring stations in the C1 (~125 stations) and C8 (~80 stations) catchments. The criteria for selection of water quality monitoring points in this study were sampling frequency, duration and location. The sites were required to have regular sampling frequency during the period January 1991 to early 2008. Although weekly or fortnightly sampling was preferred, monthly sampling records were considered sufficient for short time periods but never more than 1 year. Two sites (C1H019 and C1H027) had shorter records as the sampling points were only installed in 1995. However, sampling frequency met the selection criteria and the two sites were included in the study. Water quality monitoring points were selected based on their proximity to sites where soil sampling occurred (in 1991 and 2007), to examine the impact of S and N deposition on soil chemistry (Bird, 2011). Dissolved major salts (DMS; total dissolved salts calculated as the sum of all ions from a chemical analysis), phosphate (PO43-), sulphate (SO42-), nitrate-plus-nitrite (NO3-+NO2-), ammonium (NH4+) and base cations (Na+, K+, Ca2+, Mg2+) were analysed for changes at each of the five sites using statistical analyses. Chloride (Cl-) concentrations were also accessed from the WMS database to calculate acid-neutralising capacity (as described below). For chemical variables, monthly median concentrations were calculated. An additional data quality check (Huizenga, 2011) would have been useful and is discussed further at the end of the paper.
Monthly discharge volumes were used as a covariate to the chemical variables to account for seasonal differences in concentrations. Wet season months were October to March and dry season months were April to September every year. Because monthly discharge is not normally distributed, the natural logarithm (ln(discharge)) was used in all statistical procedures. The use of monthly median concentrations and monthly discharge was recommended by Malan et al. (2003) for integrating water quality and quantity in modelling in-stream flow requirements to meet biological community demands.
Acid-neutralising capacity (ANC) of water was calculated according to the charge-balance equation (using molar concentrations) of Reuss (1991) (Eq. (1)). ANC is an indicator of the capacity of water to buffer against incoming acidity and is frequently used to assess for the impact of acidic deposition on soils and freshwater.

Statistical analysis was used to examine the water quality at the five sites for changes over a 17-year period. During this period the mean (± standard error) quantities of S and N deposited to the catchment were 339 ± 87 kg S ha-1 and 85 ±7 kg N ha-1 (Bird, 2011 based on Blight et al., 2009). An analysis of covariance (ANCOVA) was used to test for site (spatial) differences in water quality. To assess for differences between sites, the ANCOVA compared the regression line that describes the relationship between the covariate (ln(discharge)) and a chemical variable of interest at 2 different sites in a pair-wise comparison. The analyses were conducted using SAS version 9.1.
The relationship between independent (environmental) variables (calendar year of sampling, month of sampling, wet (October to March) or dry season (April to September) and ln(discharge)) and the water quality (chemical) variables were also investigated using the constrained ordination technique of canonical correspondence analysis (CCA) (Leps and Smilauer, 2003). The CCA generates hypothetical axes from the environmental variables to represent theoretical environmental gradients along which the water chemical variables are plotted. In the CCA procedure, cases of rare concentration values were down-weighted and the analysis was evaluated using a Monte-Carlo permutation test (9999 permutations). The CCA procedure was conducted using Canoco for Windows 4.55 (Ter Braak and Smilauer, 2002).
Trend analyses were conducted for all sites to test for significant (temporal) changes in concentrations. Trend analysis is based on the sign test, where the data set is split in half and each sample in the first half of the data set is compared with the matching sample in the second half of the data set. The number of occasions where the second sample was larger than the first sample were summed and a probability score for the trend was calculated (Cox and Stuart, 1955). Trend analyses were conducted using SAS version 9.1.
Results
Testing for differences between sites using an ANCOVA procedure, with the natural log of mean monthly discharge (ln(discharge)) as the covariate to the median monthly concentrations of chemical variables of interest, showed that nearly all sites varied significantly from all others for most variables (Table 1). Sites C1H004 and C1H008 were statistically similar for ANC and Na+; and Sites C1H008, C1H019 and C1H027 were statistically similar for NH4+. Because the ANCOVA showed a high degree of spatial difference, the sites were considered independent in further analyses.
The largest mean monthly discharge, irrespective of season, was measured at Site C1H019 (Table 1) on the main-stem of the Vaal River (Fig. 1). This site also showed the largest variance between monthly discharge in the wet and dry months. Site C1H027 showed the smallest mean monthly discharge, irrespective of season, as well as smallest variance between wet and dry season flow. The concentration of chemical variables was higher in the dry season months at all sites, except site C1H019 where wet season concentrations were higher. Concentrations of SO42-, NO3-+NO2-, NH4+ and the base cations (Na+, Ca2+, K+) were highest at Site C1H004 during the dry season months (Table 1). The ANC was lowest at Site C8H005 during wet months and at Site C1H019 during dry months.
Sulphate and Na+ contributed the most to the overall salt balance (Table 1) with concentrations greater than 10 mg-l-1. Ammonium and NO3-+NO2- were found in concentrations lower than 5 mg-£-1. Dissolved major salt concentrations range between 150 and 500 mg-l-1 where the chemical variables examined contributed approximately 40% of the salt balance. The salts contributing to DMS (Cl-, CaCO3 (calcium carbonate), and F- (fluoride) were not investigated individually in this study.
The ordination biplots generated by CCA, to investigate the influence of the season and ln(discharge) on the concentration of chemical species, showed no distinct patterns for the five river sampling sites (biplots not shown). Eigenvalues, from the CCA, explain how much of the variance is accounted for by the data set used and suggest that the environmental variables used only account for a small proportion of variance in the data set (6.3% at Site C1H004; 4.2% at Site C1H008; 1.1% at Site C1H019; 3.1% at Site C1H027; and 2.7% at Site C8H005). However, the cumulative variance of the first two (of four) synthetic axes exceeded 93.0% at all five sites. Thus, environmental variables and chemical variables not analysed (such as pH, water temperature and hardness) may also have influenced water chemistry. In spite of the exclusion of these variables in this analysis, the synthetic axes generated in the CCA suitably account for the variance in this data set (chemical species and independent variables).
Changes in water quality over time were tested using trend analysis (Table 2). The hypotheses tested were that, if the catchments drained by the monitoring points were impacted by S and N deposition, the SO42-, NO3-+NO2-, NH4+ and DMS concentrations would show an increasing trend over time. Conversely, the base cation concentrations and ANC values would show a decreasing trend. Ammonium (Site C1H004), NO3-+NO2- (Site C1H027) and SO42- (site C1H004) concentrations increased at only 1 monitoring site each. Increasing PO43-concentration trends were found at 3 sites (C1H004, C1H008 and C1H027). Decreasing concentration trends for Mg2+, Ca2+ (both at Site C1H027) and Na+ (Site C1H019) were found at 1 site each. The hypotheses were contradicted at some sites; for example NH4+ (Sites C1H008 and C1H019), NO3-+NO2- (Site C1H019) and SO42- (Sites C1H019 and C1H027) concentrations decreased at a total of 3 sites. Potassium concentrations increased at Sites C1H004, C1H019 and C1H027, and none of the sites show the hypothesised decrease in K+ concentrations. No significant trends in DMS concentrations were detected.

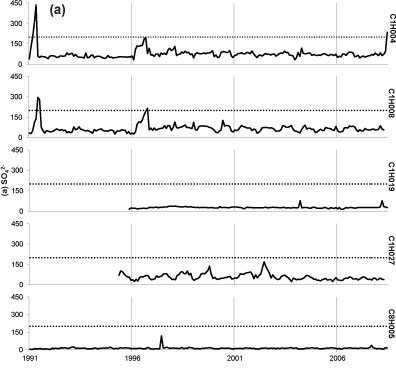
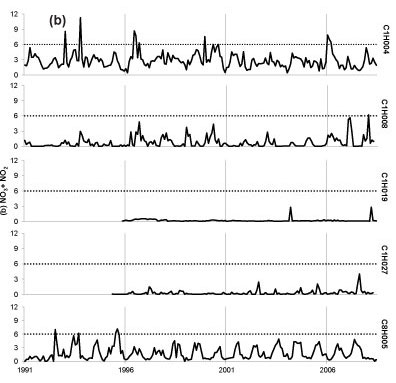
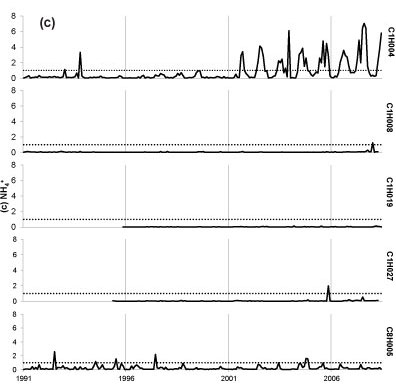
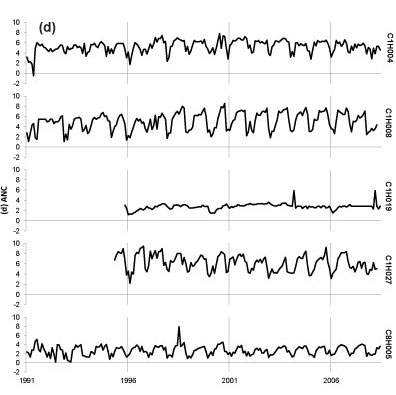
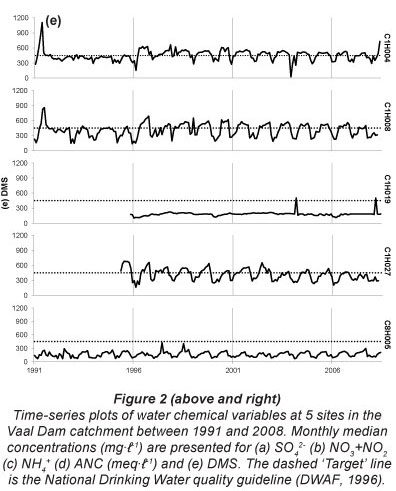
Seasonal fluctuations in chemical concentrations are evident in time-series plots (Fig. 2), where the concentration peaks occur during the dry months. Time-series plots for the water quality variables were compared with South African drinking water quality guidelines (DWAF, 1996a). Sulphate at all sites has remained consistently below the conservative 200 mg-l-1 guideline since 1997, with one recent exceedance of target at Site C1H004 (Fig. 2a). Concentrations of SO42- for Site C1H019 always fell below 40 mg-l-1 and at Site C8H005 always fell below 120 mg-l-1. Nitrate-plus-nitrite (Fig. 2b) rarely peaked above the target concentrations of 6 mg-l-1. There has been an increased frequency of NH4+ peaks above the 1 mg-l-1 target since late 2000 at Site C1H004 (Fig. 2c). Site C1H004 showed the greatest number of peaks above the target level for both N species. Concentrations of NH4+ for Sites C1H008, C1H019 and C1H027 mostly fell below 0.2 mg-l-1 and always below 2 mg-l-1. There is no national guideline for ANC at present; however, the time-series plot shows that ANC consistently falls below 8 meq-l-1 (Fig. 2d). The concentration of DMS (Fig. 2e) has regularly exceeded the national guideline at Sites C1H004, C1H008 and C1H027 since mid-1996.
Discussion
It was expected that if the soils in the Vaal Dam catchment were showing signs of impact as a result of S and N deposition it would be evident by increases in the inorganic S and N concentrations of water, provided that no point sources or surface diffuse sources are present. This was only found at 2 sites (C1H004 for NH4+ and SO42- and C1H019 for NO3-+NO2-) over the 17-year sampling period (1991 to 2008). Sites C1H004 and C1H019 are downstream from urban, mining and industrial operations. In addition, Site C1H019 is downstream of an inter-basin transfer input (Usutu River transfer from the Heyshope Dam) (Herold, 2011). Due to the acidifying nature of S and N inorganic species, a reduction in basic cations and ANC charge balance was expected; however, this was rarely found at these five locations. The most recent analyses show that soils of the Highveld grasslands, especially those central to the Vaal Dam catchment, have the capacity to neutralise some acid inputs via atmospheric deposition and many soils showed increased concentrations of basic cations (Bird, 2011). The mechanisms proposed for increased soil basic cation concentrations were via fly-ash, soil dust and ash deposition from biomass burning. The same sources could contribute, in part, to the increases in cation concentrations at the five sites investigated.
The spatial differences between the sites, highlighted by the output from the ANCOVA analysis, confirm the variability between rivers within the catchment (Day et al., 1998), and, together with the CCA, suggest that additional environmental variables, including land use, point-source pollution and diffuse inputs from agricultural sources, are stronger influences on the quality of water in the Vaal Dam catchment when compared with S and N deposition. Inclusion of more sites and more environmental variables could be used with CCA analysis to explain more of the variation in the data set than was found in this investigation. The inclusion of PO43- was to examine if increases in S and N were associated with increases in PO43- which could be linked to agricultural sources, as opposed to S and N deposition. However, the increases in PO43- at 3 sites may be linked to the geology, as Grobler and Silberbauer (1985) found that the sedimentary geology of the Vaal River catchment (below the Vaal Dam) significantly increased the concentrations of soluble reactive PO43- when compared with the igneous geology of the Limpopo catchment. More than 85% of the Vaal Dam catchment is underlain by sedimentary geology (Vorster, 2003; Middleton and Bailey, 2009). Elevated Ca2+ concentrations were found to reduce the solubility of PO43- and decrease its availability for phytoplankton in the Vaal River (at Balkfontein) in the Free State Province (Roos and Pieterse, 1995), thus reducing the potential for eutrophication of the aquatic system.
The range of absolute concentrations of the 10 water quality variables at these 5 sites was generally higher than that recorded in other surface waters receiving elevated quantities of atmospheric deposition. For alpine systems in the Rocky Mountains of Colorado, USA, Baron et al. (2009) found stream water NO3-, SO42- and Ca2+ concentrations 74%, 94% and 93% lower than the mean values for the Vaal Dam catchment sites. Streams in the United Kingdom had mean concentrations of SO42-, NO3-, and Na+ within a similar range of the Vaal Dam catchment sites; however, the UK streams showed much less variance between minimum and maximum values (Evans et al., 2001). Acid-neutralising capacity of UK streams fell within the range of those calculated for the Vaal Dam catchment; however, the median values in UK streams were lower (Kernan and Helliwell, 2001; Kowalik et al., 2007). The ranges for NH4+, NO3-, SO42- and dissolved salts were broader in the Vaal Dam catchment than those recorded in Japan (Shrestha and Kazama, 2007), India (Singh et al., 2004) and UK streams (Cooper, 2005), although the mean values in these studies were similar. Compared with the study by Roos and Pieterse (1995), the Vaal Dam catchment rivers had lower SO42-, Ca2+, Mg2+, K+ and Na+ concentrations. Salinity in the Vaal River, downstream from the Vaal Dam, was similar to that in South African rivers (Crocodile, Komati and Olifants) impacted by similar land uses, including mining and irrigated agriculture (Van Niekerk et al., 2009). South African rivers less affected by mining and irrigated agriculture (Berg, Thukela and lower Orange) had comparatively lower salinity (Van Niekerk et al., 2009). Dramatically increased (almost double in the case of SO42-) concentrations of these ions further downstream on the Vaal River (Roos and Pieterse, 1995) could be the result of substantial industrial and domestic effluent inputs as well as use for irrigated crop farming.
At the five Vaal Dam catchment sites, the SO42- concentrations were consistently within the drinking water quality target range, but inorganic N concentrations have been more problematic, especially at Site C1H004. The eutrophication potential of inorganic N could be offset by the turbid nature of the Vaal tributaries in general (Davies et al., 1992), which retards the growth of algae due to reduced light availability. For eutrophication to occur in surface waters the supply of the (previously) primary limiting nutrient - usually N or P - is increased and the limitation of plant production is removed (Smith et al., 1999). Although surface water productivity is usually more limited by P, consistently high N concentrations may place the surface waters of the catchment at higher risk of the effects of eutrophication, including degradation of the water source through decreased clarity and shifts in biological communities and food webs (Smith et al., 1999).
The salinity of the Vaal River system has been modelled to increase as a result of S and N deposition (for example: Taviv and Herold, 1989; Herold and Gorgens, 1991; Herold et al., 2001; Van Niekerk et al., 2009), and therefore it is surprising that DMS showed no significant changes in concentrations over the 17 years of this study. The results from the three statistical analyses performed suggest that the Vaal Dam catchment, although impacted by land use, e.g. mining and urbanisation, is not yet showing signs of impact as a result of S and N deposition, and that the water quality, with few exceptions, remains within the target range of drinking water quality standards.
The Highveld grasslands are well researched with respect to atmospheric quality (for example the early research of Tyson et al., 1988; Held et al., 1996), and recently wet and dry deposition networks have recently been extended (Mphepya et al., 2004; Mphepya et al., 2006; Josipovic et al., 2010). Recommendations for further work include the use of similar statistical methods to include longer time periods and a wider monitoring area. Closer inspection of rainwater and surface water chemistry (as conducted by Bosman and Kempster, 1985) is also advocated for the Highveld, to understand how strongly surface water chemistry is influenced by atmospheric deposition. The use of the inorganic chemistry index (Huizenga, 2011) and total alkalinity (TAL) instead of ANC should be examined as a method of monitoring the impact of acidic inputs on surface water chemistry. Total alkalinity is routinely measured at DWA monitoring points and has a prescribed target range, to prevent corrosion and scaling in industrial processes (DWAF, 1996b),
Conclusion
The interpretation of statistical analyses suggests that water quality at 5 sites in the Vaal Dam catchment is spatially variable, due to site differences revealed by the ANCOVA analysis, and temporally variable, from the findings of the trend analysis, which show increases and decreases in chemical variables over the 17-year period analysed. The concentrations of the selected water quality variables differed significantly, with rare exception, at all five sites, suggesting that land type and, perhaps, water-use, above the monitoring site was more influential on water quality than soils and S and N deposition. Increases in S and N were only found at 1 and 2 sites, respectively. ANC was found to decrease at only 1 site over the 17 years. The multivari-ate analysis approach, the variables and the sites selected, provided insufficient evidence that the surface waters are affected by atmospheric S and N deposition. The approach could also not detect evidence of the surface water quality becoming worse at these sites.
Acknowledgements
The authors are grateful for the financial support of this project from Eskom and Sasol, the University of the Witwatersrand, the South African National Research Foundation and the Mellon Foundation Postgraduate Mentorship Programme. Thanks are extended to the South African Department of Water Affairs (DWA) for access to the water quality data set. Dr Michael Silberbauer is thanked for his helpful comments. Mr Joseph Mathai is thanked for statistical assistance with the ANCOVA and trend analyses.
References
BARON JS, RUETH HM, WOLFE AM, NYDICK KR, ALLSTOTT EJ, MINEAR JT and MORASKA B (2000) Ecosystem responses to nitrogen deposition in the Colorado Front Range. Ecosystems 3 (4) 352-368. [ Links ]
BARON JS, SCHMIDT TM and HARTMAN MD (2009) Climate-induced changes in high elevation stream nitrate dynamics. Global Change Biol. 15 (7) 1777-1789. [ Links ]
BIRD TL (2011) Some impacts of sulfur and nitrogen deposition on the soils and surface waters of the Highveld grasslands, South Africa. PhD dissertation, University of the Witwatersrand, Johannesburg. [ Links ]
BLIGHT J, CORNELIUS G, HEROLD C, LORENTZ S and SCHOLES M (2009) An investigation into the effects of atmospheric pollution on the soil-water-ecosystem continuum in the eastern regions of South Africa - Phase 0 research report. RES/ RR/09/30350. Eskom Holdings Limited, Rosherville, South Africa. [ Links ]
BOSMAN HH and KEMPSTER PL (1985) Precipitation chemistry of Roodeplaat Dam catchment. Water SA 11 (3) 157. [ Links ]
BRAUNE E and ROGERS KH (1987) The Vaal River catchment: problems and research needs. South African National Scientific Programmes Report 143. CSIR, Pretoria. [ Links ]
COLLETT KS, PIKETH SJ and ROSS KE (2010) An assessment of the atmospheric nitrogen budget on the South African Highveld. S. Afr. J. Sci. 106 (5/6) 9 pp. DOI:10.4102/sajs.v106i5/6.220. [ Links ]
COOPER DM (2005) Evidence of sulphur and nitrogen deposition signals at the United Kingdom Acid Waters Monitoring Network sites. Environ. Pollut. 137 (1) 41-54. [ Links ]
COX DR and STUART A (1955) Some quick sign tests for trend in location and dispersion. Biometrika 42 (1) 80-95. [ Links ]
DAVIES BR, THOMS M and MEADOR M (1992) An assessment of the ecological impacts of inter-basin water transfers, and their threats to river basin integrity and conservation. Aquat. Conserv.: Mar. Freshwater Ecosyst. 2 (4) 325-349. [ Links ]
DAY JA, DALLAS HF and WACKERNAGEL A (1998) Delineation of management regions for South African rivers based on water chemistry. Aquat. Ecosyst. Health 1 (2) 183-197. [ Links ]
DENTENER F, STEVENSON D, ELLINGSEN K, VAN NOIJE T, SCHULTZ M, AMANN M, ATHERTON C, BELL N, BERGMAN D, BEY I, BOUWMAN L, BUTLER T, COFALA J, COLLINS B, DREVET J, DOHERTY R, EICKHOUT B, ESKES H, FIORE A, GUAUSS M, HAUGLUSTAINE D, HOROWITZ L, ISAKSEN ISA, JOSSE B, LAWRENCE M, KROL M, LAMARQUE JF, MONTANARO V, MULLER JF, PEUCH VH, PITARI G, PYLE J, RAST S, RODRIGUEZ J, SANDERSON M, SAVAGE NH, SHINDELL D, STRAHAN S, SZOPA S, SUDO K, VAN DINGENEN R, WILD O and ZENG G (2006) The global atmospheric environment for the next generation. Environ. Sci. Technol.40 3586. [ Links ]
DWAF (DEPARTMENT OF WATER AFFAIRS AND FORESTRY, SOUTH AFRICA) (1996a) South African Water Quality Guidelines. Volume 1: Domestic Use (2nd edn.). Department of Water Affairs and Forestry, Pretoria, South Africa. [ Links ]
DWAF (DEPARTMENT OF WATER AFFAIRS AND FORESTRY, SOUTH AFRICA) (1996b) South African Water Quality Guidelines. Volume 3: Industrial Use (2nd edn.). Department of Water Affairs and Forestry, Pretoria, South Africa. [ Links ] DOVLAND H and PEDERSON U (1996) Acid deposition in Europe. In: Whelpdale DM and Kaiser MS (eds) Global Acid Deposition Assessment (Global Atmosphere Watch, No. 106 ). World Meteorological Organization, Geneva. 53-67. [ Links ]
EVANS CD, HARRIMAN R, MONTEITH DT and JENKINS A (2001) Assessing the suitability of acid neutralising capacity as a measure of long-term trends in acidic waters based on two parallel datasets. Water Air Soil Pollut. 130 1541-1546. [ Links ]
FEY MV and GUY SA (1993) The capacity of soils in the Vaal Dam Catchment to retain sulphate from atmospheric pollution. WRC Report No. 414/1/93. Water Research Commission, Pretoria. [ Links ]
GROBLER DC and SILBERBAUER MJ (1985) The combined effect of geology, phosphate sources and runoff on phosphate export from drainage basins. Water Res. 19 (8) 975-981. [ Links ]
HELD G, GORE BJ, SURRIDGE AD, TOSEN GR, TURNER CR and WALMSLEY RD (1996) Air pollution and its impacts on the South African Highveld. Environmental Scientific Association, Cleveland, Johannesburg. [ Links ].
HEROLD CE (2011) Personal communication, 31 January 2011. Dr Chris Herold. Umfula Wempilo Consulting, PO Box 98578, Sloane Park, 2152, South Africa. [ Links ]
HEROLD CE and GORGENS A (1991) Vaal Dam salinity assessment with particular reference to atmospheric deposition. NC120/12/ DEQ0391. Hydrological Research Institute, Department of Water Affairs and Forestry, Pretoria, South Africa. [ Links ]
HEROLD CE, TAVIV I and PITMAN WV (2001) Modelling of longterm effect of atmospheric deposition on the salinity of runoff from the Klip River catchment. WRC Report No. 697/1/01. Water Research Commission, Pretoria. [ Links ]
HUIZENGA JM (2011) Characterisation of the inorganic chemistry of surface waters in South Africa. Water SA 37 (3) 401-410. [ Links ]
KERNAN MR and HELLIWELL RC (2001) Partitioning the variation within the acid neutralizing capacity of surface waters in Scotland in relation to land cover, soil and atmospheric depositional factors. Sci. Total Environ. 265 (1-3) 39-49. [ Links ]
KOWALIK RA, COOPER DM, EVANS CD and ORMEROD SJ (2007) Acidic episodes retard the biological recovery of upland British streams from chronic acidification. Global Change Biol. 13 (11) 2439-2452. [ Links ]
LEPS J and SMILAUER P (2003) Multivariate Analysis of Ecological Data using CANOCO. Cambridge University Press, Cambridge. [ Links ]
LOVETT GM, TEAR TH, EVERS DC, FINDLAY SEG, COSBY BJ, DUNSCOMB JK, DRISCOLL CT and WEATHERS KC (2009) Effects of air pollution on ecosystems and biological diversity in the eastern United States. Ann. NY Acad. Sci. 1162 (1) 99-135. [ Links ]
MALAN HL, BATH A, DAY JA and JOUBERT A (2003) A simple flow-concentration modelling method for integrating water quality and water quantity in rivers. Water SA 29 (3) 305-311. [ Links ] MIDDLETON BJ and BAILEY AK (2009) Water Resources of South Africa (WR2005). WRC TT 380/08. Water Research Commission, Pretoria. [ Links ]
OBERHOLSTER PJ, ANECK-HAHN NH, ASHTON PJ, BOTHA AM, BROWN J, DABROWSKI JM, DE KLERK AR, DE KLERK LP, GENTHE B, GEYER H, HALL G, HILL L, HOFFMAN A, KLEYNHANS CJ, LAI J, ROUX L, LUUS-POWELL W, MASEKOAMENG E, McMILLAN P, MYBURGH J, SCHACHT-SCHNEIDER K, SOMERSET V, STEYL J, SURRIDGE AKJ, SWANEVELDER ZH, VAN ZIJL MC, WILLIAMS C and WOODBORNE S (2011) Risk Assessment of Pollution in Surface Waters of the Upper Olifants River System: Implications for Aquatic Ecosystem Health and the Health of Human Users of Water. Technical report, CSIR Natural Resources and the Environment, Pretoria. [ Links ]
REUSS JO (1991) The transfer of acidity from soils to surface waters. In: Ulrich B and Sumner ME (eds) Soil Acidity. Springer-Verlag, New York. 203-218. [ Links ]
ROOS JC and PIETERSE AJH (1995) Salinity and dissolved substances in the Vaal River at Balkfontein, South Africa. Hydro-biologia 306 41-51. [ Links ]
SAS-VERSION-9.1 http://www.sas.com/technologies/analytics/statis-tics/stat/index.html.
SHRESTHA S and KAZAMA F (2007) Assessment of surface water quality using multivariate statistical techniques: A case study of the Fuji River basin, Japan. Environ. Modell. Softw. 22 (4) 464-475. [ Links ]
SINGH KP, MALIK A, MOHAN D and SINHA S (2004) Multivariate statistical techniques for the evaluation of spatial and temporal variations in water quality of Gomti River (India) - a case study. Water Res. 38 (18) 3980-3992. [ Links ]
SMITH VH, TILMAN GD and NEKOLA JC (1999) Eutrophication: impacts of excess nutrient inputs on freshwater, marine, and terrestrial ecosystems. Environ. Pollut. 100 (1-3) 179-196. [ Links ]
TAVIV I and HEROLD CE (1989) Preliminary estimation of the impact of air pollution on water quality in the Vaal Dam. WRC Report No. 697/1/01. Water Research Commission, Pretoria. [ Links ]
TER BRAAK CJF and SMILAUER P (2002) CANOCO Reference Manual and CanoDraw for Windows User's Guide: Software for Canonical Community Ordination (Version 4.5). Microcomputer Power, Ithaca. [ Links ]
TYSON PD, KRUGER FJ and LOUW CW (1988) Atmospheric pollution and its implications in the Eastern Transvaal Highveld. South African National Scientific Programmes Report 150. CSIR, Pretoria. [ Links ]
URBAN ECON (2000) The economic cost effects of salinity. Volume 1: Integrated Report. WRC Report No. TT 123/00. Water Research Commission, Pretoria. [ Links ]
VAN NIEKERK H, SILBERBAUER M and HOHLS B (2009) Monitoring programme revision highlights long-term salinity changes in selected South African rivers and the value of comprehensive long-term data sets. Environ. Monit. Assess. 154 (1) 401-411. [ Links ]
VAN RENSBURG LD, STRYDOM MD, DU PREEZ CC, BENNIE ATP, LE ROUX PAL and PRETORIUS JP (2008) Prediction of salt balances in irrigated soils along the lower Vaal River, South Africa. Water SA 34 (1) 1117. [ Links ]
VORSTER CJ (2003) Simplified geology: South Africa, Lesotho and Swaziland. (Projection: Transverse Mercator Clark 1880). Council for Geoscience, Pretoria. [ Links ]
WRIGHT RF, ALEWELL C, CULLEN JM, EVANS CD, MAR-CHETTO A, MOLDAN F, PRECHTEL A and ROGORA M (2001) Trends in nitrogen deposition and leaching in acid-sensitive streams in Europe. Hydrol. Earth Syst. Sci. 5 (3) 299-301. [ Links ]
Received 6 February 2012; accepted in revised form 2 October 2012.
* To whom all correspondence should be addressed. ffi +27 82 870-9204; fax: +27 11 717-6494; e-mail: terribird@gmail.com

