


Services on Demand
Article
 English (pdf)
 Article in xml format
 Article references
Indicators

Related links
-
 Cited by Google
 -
 Similars in Google
Share

 Permalink
Water SA
On-line version ISSN 1816-7950
Print version ISSN 0378-4738
Water SA vol.38 n.4 Pretoria Jan. 2012
Sludge pipe flow pressure drop prediction using composite power-law friction factor-Reynolds number correlations based on different non-Newtonian Reynolds numbers
R HaldenwangI, *; APN SutherlandI; VG FesterI; R HolmII; RP ChhabraIII
IFlow Process Research Centre, Cape Peninsula University of Technology, PO Box 652, Cape Town, 8000, South Africa
IIInnventia, Stockholm, Sweden
IIIDepartment of Chemical Engineering, IIT Kanpur, India
ABSTRACT
When predicting pressure gradients for the flow of sludges in pipes, the rheology of the fluid plays an important role, especially with increasing concentration of the suspended matter in the sludge. The f-Re relationship is often applied when designing pipelines, but it depends on the rheological parameters of the fluid and what definition of non-Newtonian Reynolds number is used. In this work, a database of 586 AP Q points from tests with 10 different sludges of concentration 3.4 to 7.2% by mass, in 3 test pipe diameters, was established and used to rheologically characterise the sludges as Bingham plastic fluids. Five published definitions of the non-Newtonian Reynolds number were used to create composite power law correlations for the f-Re relationship covering all flow regimes. Pressure gradient predictions based on each correlation were compared and ranked, based on 2 different statistical estimates of error. The correlations using the MetznerReed Reynolds number (ReMR) and a Reynolds number proposed by Slatter and Lazarus in 1993 (Re2) yielded the lowest errors in comparison with the experimental values. It is shown that these correlations can be used to predict pressure drop to within ±20% for a given sludge concentration and operating condition.
Keywords: composite power law, friction factor, non-Newtonian Reynolds number, pressure gradient, sludge rheology
Introduction
Sludges are known to exhibit non-Newtonian behaviour which exerts varying levels of influence on pressure drop predictions in pipelines. The rheology of a sludge varies appreciably from one sample to another depending on the processes used, as is the case for most non-Newtonian fluids. Several researchers have attempted to characterise sludges and develop models for pressure drop predictions in pipelines using different rheological models. This paper describes the application of a technique presented by Garcia et al. (2003), whereby a composite power-law correlation derived from sufficient representative f-Re experimental data is used to predict pipe flow pressure drops for all flow regimes. Five different definitions of non-Newtonian Reynolds number are summarised, each resulting in a different f-Re correlation. Sludge rheological characterisation, the Reynolds numbers considered and details of the composite power-law curve are considered in the literature review. The experimental procedure and rheologies for the sludges tested in a facility in Stockholm, Sweden, and at the Zeekoeivlei wastewater treatment plant in Cape Town, South Africa, are then given. This is followed by the correlations derived for these sludges and the resulting pressure gradient predictions. The performance of the different Reynolds number correlations is ranked and an indication of expected accuracies in predicted pressure gradients for each is given. The empirical relationships between the Bingham rheological parameters and the concentration are then used with the derived f-ReMR correlation to predict pressure drops for comparison with the predictions using actual xy and K values. Both predictions fell largely within ±20% of the experimental values.
Literature review
Sludge rheological characterisation
The first published article on the rheological characterisation of sludges is that of Babbitt and Caldwell (1939). Using pipe viscometers, they did extensive tests and characterised the rheological behaviour of the sludges they tested using the Bingham model. Carthew et al. (1983) also tested various raw sludges in a pipe viscometer and they too characterised these materials as Bingham fluids. The highest total solids concentration they tested was 5.5% by mass, resulting in the highest y ield stress of 4.3 Pa. Honey and Pretorius (2000) characterised activated sludges as pseudoplastic fluids, using a rotary viscometer, and demonstrated that under some conditions these sludges can exhibit time-dependent behaviour. Murakami et al. (2001) tested digested biosolids, thickened and waste-activated sludges up to a solids concentration of 4.6%. They characterised the rheological behaviour of these sludges using the pseudoplastic model, relating both K and n to concentration. This was supplemented by the measurement of pressure loss data for the flow of sludges in a 20 m pipe loop in pipes of diameters 150 and 200 mm. Use of the Metzner-Reed Reynolds number was found to satisfactorily represent their data. Activated sludges were rheologically characterised as yield pseudoplastic fluids by Mori et al. (2006) in their investigation into the effect of rotary viscometer geometry on the derived rheological parameters.
The effect of yield stress on the pumping pressures required for viscous sludges was highlighted by Slatter (2004). Using the Bingham model he showed that it is likely for viscous yield stress fluids to be in laminar flow, which considerably increases the viscous forces and therefore the frictional resistance. Garcia et al. (2003), on the other hand, used the composite power-law friction factor modelling technique to estimate pressure drop for various multiphase fluids in laminar and turbulent pipe flow. Most of their database is, however, for polymeric systems. As far as can be ascertained, this technique has not been used before for non-Newtonian sludge pressure drop predictions.
Non-Newtonian Reynolds numbers
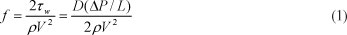
It is customary to employ the usual friction factor-Reynolds number coordinates together with the rheological parameters, such as power-law index, Bingham number, etc., for non-dimensional representation of pipeline pressure drop data. For the flow of Newtonian fluids this approach, of course, leads to the well-known Moody diagram. However, the situation for pseudoplastic and Bingham plastic fluids is much less coherent than that depicted by the Moody diagram. This is so partly due to the fact that there does not appear to be a simple way to define the Reynolds number in an unambiguous manner for such fluids, as will be seen here. Metzner and Reed (1955) were seemingly the first to systematically investigate the laminar flow of time-independent non-Newtonian fluids in circular pipes. They put forward a definition of the Reynolds number which reconciles the laminar friction factor-Reynolds number data for Newtonian and time-independent non-Newtonian fluids onto a single curve given by f=16/Re, where the Fanning friction factor f is given by:
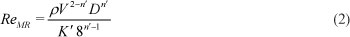
Based on this premise, the resulting definition of the so-called Metzner-Reed Reynolds number ReMR is given as:
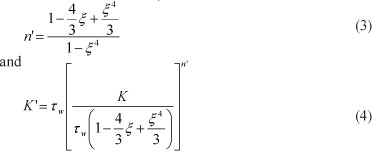
For Bingham fluids, the apparent power-law constants K' and n' evaluated from the laminar flow data are related (Skelland, 1967; Chhabra and Richardson, 2008) to the true Bingham model parameters K and t as:
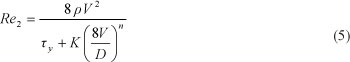
For the flow of Herschel-Bulkley model fluids, Slatter and Lazarus (1993) proposed a Reynolds number Re2, similar to that due to Clapp as reported by Torrance (1963), but now including the yield stress. Re2 is given by:
Subsequently, Slatter (1994, 1996) presented a modification of Re2 which incorporated the effect of the viscous force and unsheared plug due to the yield stress. This modified Reynolds number is denoted as Re3 and given by:
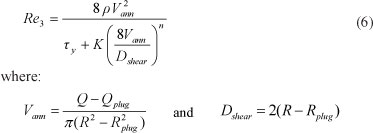
There is an implicit assumption in Eq. (5) and Eq. (6) that these are based on the nominal wall shear rate of (8V/D) rather than its true value given by [(3n'+1)/4n'][8V/D]. Furthermore, though Slatter (1994; 1996) has argued that only the sheared part of the fluid contributes to inertial and viscous forces, this assumption is open to criticism and is at best an empiricism without any theoretical justification.
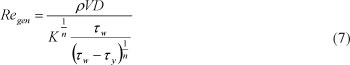
In their numerical simulation of turbulent non-Newtonian flow, Rudman and Blackburn (2006) used a generalised
Reynolds number Re en for Herschel-Bulkley fluids, given as:
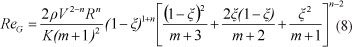
In a recent study of pipe flow of non-Newtonian fluids, Guzel et al. (2009) not only critically reviewed the merits and demerits of various definitions of the Reynolds numbers in use, but also proposed a new definition. Their definition of the Reynolds number, denoted as ReG, incorporates both the radial variation in effective viscosity and the ratio of centreline velocity to mean velocity. Guzel et al. asserted that this approach predicts the end of laminar flow better than, for example. the MetznerReed Reynolds number. For Herschel-Bulkley fluids, ReG is defined as:
The analysis of Guzel et al. (2009) is based on the fact that the laminar flow will get destabilised first in the region of the maximum velocity (the local Reynolds number will be maximum here) or in the region where the viscosity is minimum (the wall region for a time-independent fluid). For Newtonian fluids, the latter factor is absent because of their constant viscosity, but for non-Newtonian fluids this relationship is compounded. At the axis of a pipe (r = 0) the velocity is a maximum and the velocity gradient is zero. A shear-thinning fluid will exhibit maximum viscosity here and it is therefore possible that the local Reynolds number will be below the critical value. The fluid velocity decreases from its maximum value at r = 0 to zero at r = R, and correspondingly the velocity gradient (shear rate) gradually increases from its zero value at the axis (r = 0) to its maximum value at the wall (r = R). These two competing mechanisms yield the maximum value of the Reynolds number somewhere between r = 0 and r = R. In a sense, this is the idea implicit in the stability analysis of Ryan and Johnson (1959). Naturally, each of the Reynolds number definitions given by Eqs. (2), (5), (6), (7) and (8) will result in differentf-Re correlations as well as different predictions for the cessation of the laminar flow condition. These differences will be accentuated with increasing degree of non-Newtonian behaviour. In the limit of Newtonian fluid behaviour, i.e., n = 1 and ry= 0, all the above definitions of the Reynolds number reduce to Re = pVD/n, so there is no ambiguity concerning the definition of the Reynolds number for Newtonian fluids.
Composite curve fit
Garcia et al. (2003) used a logistic dose-response curve, as described in Patankar et al. (2002), to model the f-Re relationship for various multiphase fluids, based on a large experimental database. This composite power-law correlation equation is of the form:
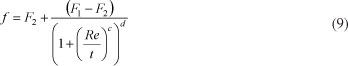
where F1 and F2 are power-law relationships defined as:

and

a1 and bt are determined by fitting Eq. (10) to the laminar region data; a2 and b2 are obtained by fitting Eq. (11) to the turbulent region data. F1 and F2 therefore represent the upper (laminar data) and lower (turbulent data) bounds of the function, respectively. With these values determined, the parameters t, c and d are obtained by then fitting Eq. (9) to all the data points to define the transition region. The parameter t defines the value of Re where the function deviates from F1 and c determines the curvature of the deviation from F1. The product of c and d determines the slope of the power-law straight line in transition from F1 to F2 (Patankar et al., 2002). Use of Eqs. (9), (10) and (11) in this way implies that correlations covering the entire flow range are represented by power laws connected by a transition region. The composite power law is practical since it can be used to predict the transition flow region to a statistical accuracy consistent with the spread of the experimental data and it is independent of any underlying fluid mechanics theories (Garcia et al., 2003; Joseph and Yang, 2010).
Experimental work
An existing portable pipe viscometer, described more fully in Haldenwang et al. (2010), was used to perform tests at 2 sites. The equipment consists of a 1 000 I mixing tank with heat exchanger, a 4/3 ITT Flygt 4.2 kW centrifugal pump driven by an ABB variable speed drive, 63.8, 52.2 and 26.8 mm internal diameter uPVC test pipes and Krohne Optiflux 4000 EM flow sensors with IFC300 converters of 25 and 50 mm diameter to measure the volumetric flow rates. Each test pipe is fitted with a high range (0-130 kPa) and low range (0-6 kPa) Fuji FCX-AII-V5 differential pressure transmitter to measure the pressure drop over the central straight test section. Each pipe has an entry length of at least 50 pipe diameters and a length of 30 pipe diameters at the downstream end to preclude end effects (Chhabra and Richardson, 2008). All data were acquired using a custom-written LabView program running on an HP laptop via a National Instruments® USB-6229 DAQ module. (Analog Inputs: 32 SE/16 DI 250 kS/s 16 bits; Analog Outputs: 4 833 kS/s 16 bits; Digital I/O: 48 DIO 1 MHz; Counter/ Timers: 2 32 bits 80 MHz; Measurement Type: Quadrature encoder, Voltage). The heat exchanger ensured that the temperature during tests did not vary by more than 4°C.
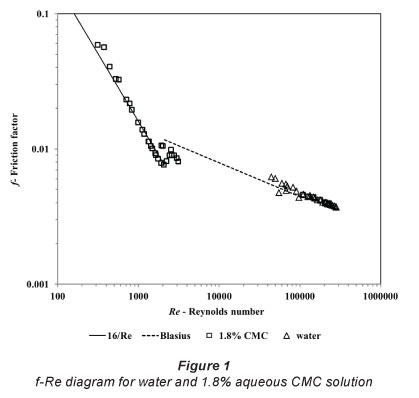
In order to establish the validity of the experimental protocols and procedures, tests were performed with water and a low concentration (1.8%) aqueous CMC solution, which behaved like a Newtonian fluid. These data are seen in Fig.1 to conform to the expected behaviour for Newtonian fluids. This inspires confidence in terms of the validity and reliability of the experimental methodology used in this work to glean information from the data of numerous sludges with varying percentages of suspended solids. For these Newtonian fluids, ReMR, Re2, Re^ Re and Re are all equal.
During the first phase of the project, 8 centrifuged digested sludges were tested in Stockholm. For the second phase of the project, 2 sludges were tested at the Zeekoeivlei wastewater treatment plant in Cape Town. These were a mixture of thickened primary and waste-activated sludge.
Analysis of results and discussion
The results from the pipe tests were used initially to establish a general relationship between the rheology of the sludge and solids concentration. The second part of the analysis involved the develo pment of composite power-law correlations off-Re for 5 different non-Newtonian Reynolds numbers. The friction factor obtained from each composite power-law correlation was used to calculate the pressure drop along the pipe and to compare it with measured values. The purpose of this work was to investigate which of the selected non-Newtonian Reynolds numbers resulted in the most accurate pressure drop predictions when using the composite power-law correlation.
Rheological characterisation of the sludges
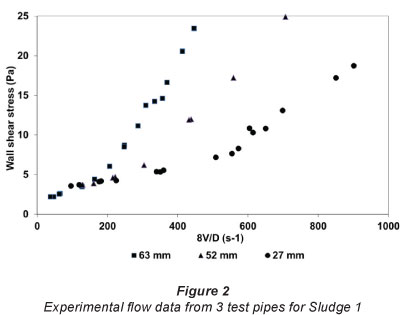
To Theologically characterise the sludges, experimental flow AP Q data from 3 different diameter test pipes were acquired and plotted as wall shear stress (tJ vs. nominal wall shear rate (8V/D). In all cases, the laminar flow data were co-linear, showing that slip was not present, as seen for example in Fig. 2. The rw - (8V/D) data were then converted to shear stress-true shear rate via the Rabinowitch-Mooney correction (Chhabra and Richardson, 2008).
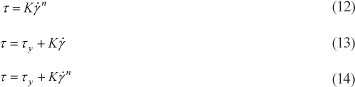
The data were then fitted to the power-law, Bingham plastic and Herschel-Bulkley rheological models. Shear-thinning fluids are generally described by the power-law model (Eq. (12)) The Bingham plastic model (Eq. (13)) is the simplest equation to describe the behaviour of a yield stress fluid. If the yield stress fluid displays non-linear flow behaviour the 3-constant Herschel-Bulkley model (Eq. (14)) is frequently used (Chhabra and Richardson, 2008).
For all sludges used here, the Bingham plastic model was found to best fit the experimental data. The derived values of the Bingham yield stress and Bingham viscosity for each sludge are listed in Table 1 and plotted in Fig. 2.
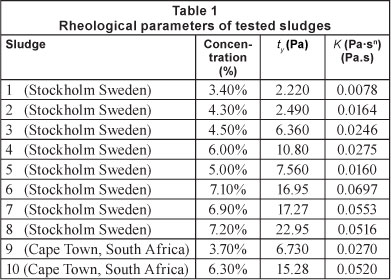
Figure 3 shows the functional dependence of the Bingham rheological parameters (j and K) on sludge concentration. The relationship between Bingham yield stress ry and concentration is given in Eq. (15), and that between Bingham viscosity (fluid consistency index) K and concentration in Eq. (16). Note, however, that in the results presented below (Table 2 to Table 4 and Fig. 4 to Fig. 8) the actual derived values of ry and K (Table 1) were used. The effect of using the correlations visa-vis the actual rheological data was evaluated using the f-Re correlation and is presented in Fig. 9.
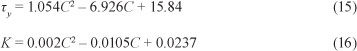
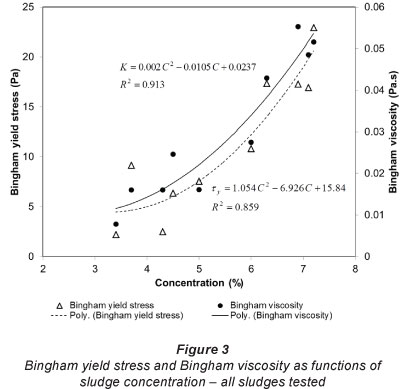
where
C is the concentration in % by mass.
Power-law composite correlations and Reynolds number comparison
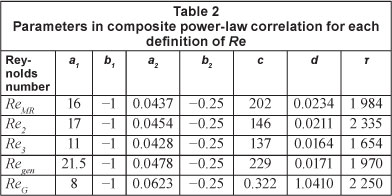
For the sludges tested, all of the data points (586 AP - Q measurements in total) were converted to f-Re form for each considered definition of Reynolds number (Eq. (2), Eqs. 5 to 8). For each Reynolds number, the appropriate parameters of the composite power law curve given by Eq. (9) were determined. Firstly, the laminar flow data points were fitted to the standard form for laminar flow \f=a/Re (i.e. b1 = -1)] to determine Fr Then the turbulent flow data points were fitted to the Blasius form f=[aRe-a25 (i.e. b2 = -0.25)] (Douglas et al., 2006) to find the value of F2. Using these values, each correlation was then completed by fitting Eq. (9) to all of the data points to determine c, d and t. Since the sludges were characterised as Bingham fluids, Eq. (3) and Eq. (4) were used to determine the values of n' and K' for use in the ReMR correlation. Theparameters of Eq. (9) corresponding to each Reynolds number definition are listed in Table 2.
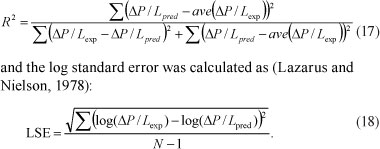
For each Reynolds number, a correlation equation defined by Eq. (9) and the parameters listed in Table 2 was used to calculate the pressure gradients (DP/L) via Eq. (1), and these values were plotted against the experimental pressure gradients. In order to assess the accuracy and to compare the performance of the different Reynolds number correlations in predicting pressure losses, the correlation coefficient (R2) values and the log standard error (LSE) for each correlation were compared. The correlation coefficient
R2 was calculated as:
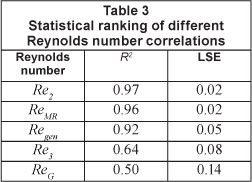
Figures 4 to 8 show the f-Re plots and composite power-law correlations, and corresponding parity plots (AP/L)exp vs. (AP/L)pred for each Reynolds number. The values of R2 and LSE are presented in Table 3, and a visual inspection of the plots, reveal that both ReMR and Re2 represent the experimental data for these sewage sludges well. The fact that the use of Re ° ° MR yields almost as good a prediction of the present data set as the use of Re2 supports the universal validity of ReMR, which has stood the test of time over the past 50 years, with scores of non-Newtonian fluid systems.
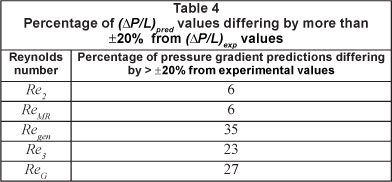
For both the Re and Re correlations only 6% of the data 2 MR points show deviations between experimental and predicted pressure gradients greater than ±20%. The percentage of points for which (AP/L) ed values differ by more than ±20% from (AP/L) exp values for each Reynolds number correlation is given in Table 4.
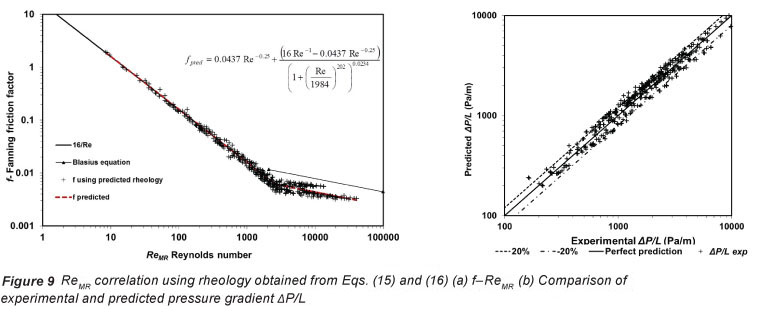
To explore the usefulness of the technique presented here, considering the sensitivity of the pressure drop to rheological parameters, the results from all of the sludges were re-plotted as f-ReMR in Fig. 9a using Ty and K calculated from Eq. (15) and (16), respectively, in the Reynolds number calculation. The results were well within the experimental limits of the actual data points. Fig. 9b shows that when using the calculated rheological properties and the Metzner-Reed Reynolds number, 92% of the predicted pressure gradients lie within a band ±25% of the experimental values. In a new application, the use of Eqs. (15) and (16) rather than measured rheologi-cal properties could result in pipeline pressure drop prediction errors greater than those stated in this work if the actual rheology is significantly different. More pipeline test data will obviously improve the correlations.
Summary and conclusions
Ten different sludges from 2 treatment plants in Sweden and South Africa were tested in a portable pipe viscometer to establish their rheological properties. In all, 586 Q-AP data points were measured, using 3 different test pipe diameters. The Bingham plastic rheological model was used to characterise the flow behaviour of the sludges that ranged in concentration from 3.4 to 7.2%. Empirical relationships between yield stress and concentration and between Bingham viscosity and concentration were established. Measured data were converted to f-Re form for 5 different definitions of non-Newtonian Reynolds number, namely ReMR, Re2, Re3, Re en and ReG. For each of the plots, separate power laws were fitted to the laminar and turbulent data, and the transition region was fitted to a logistic dose curve. This curve fit, referred to as a composite power law, is practical as it covers all flow regimes, i.e., results in one formula for the complete
Reynolds number range. The different f-Re correlations and resulting pipe flow frictional pressure drop predictions were compared and ranked on the basis of R2 and LSE. This indicated that the f-Re correlations using ReMR and Re2 result in the most accurate prediction of pressure loss associated with the flow of sludges for the range of concentrations and pipe diameters tested. For similar sludges of known concentration, Bingham plastic rheological parameters can be estimated from Eqs. (15) and (16) and used with the f-ReMR or f-Re2 correlations to predict pipe flow pressure gradients in a new application to within ±25% for conditions of practical interest.
Acknowledgements
The authors wish to thank the Swedish International Development Cooperation Agency (SIDA), Tillvaxtverket and INNVENTIA in Sweden, and the Cape Peninsula University of Technology (CPUT) in Cape Town, South Africa, for financially supporting this work. We would also like to thank the Hammarby Sjostadsverk research facility in Stockholm, which belongs to the Swedish Environmental Research Institute (IVL), for making their facilities available to conduct the sludge tests. The support of the staff at Biwater, situated at the Zeekoeivlei Waste Water Treatment Plant, who prepared the sludges, is appreciated.
References
BABBITT H and CALDWELL DH (1939) Laminar flow of sludges in pipes with special reference to sewage sludge. Univ. Illinois Bull. 37 (12) 1-57. [ Links ]
CARTHEW GA, GOEHRING CA and VAN TEYLINGEN JE (1983) Development of dynamic head loss criteria for raw sludge pumping. J. Water Pollut. Control Fed. 55 (5) 472-483. [ Links ]
CHHABRA RP and RICHARDSON JF (2008) Non-Newtonian Flow and Applied Rheology: Engineering Applications (2nd edn.). Elsevier, Oxford. [ Links ]
DOUGLAS JF, GASIOREK JM, SWAFFIELD JA and JACK L (2006) Fluid Mechanics (5th edn.). Longman Scientific and Technical, Essex. [ Links ]
GARCÍA F, GARCÍA JC, PADRINO JC, MATA C, TRALLERO JL and JOSEPH DD (2003) Power law and composite power law friction factor correlations for laminar and turbulent gas-liquid flow in horizontal pipelines. Int. J. Multiphase Flow 29 1605-1624. [ Links ]
GÜZEL B, FRIGAARD I and MARTINEZ DM (2008) Predicting laminar-turbulent transition in Poiseuille pipe flow for non-Newtonian Fluids. Chem. Eng. Sci. 64 254-264. [ Links ]
HALDENWANG R, FESTER V, SUTHERLAND A, HOLM R and DU TOIT R (2010) Design construction, commissioning and testing of a portable tube viscometer and pump rig. Proc. 18th International Conference on Hydrotransport, 22-24 September 2010, Rio De Janeiro, Brazil. Hydrotransport 18 287-298. [ Links ]
HONEY HC and PRETORIUS WA (2000) Laminar flow pipe hydraulics of pseudoplastic-thixotropic sewage sludges. Water SA 26 (1) 19-25. [ Links ]
JOSEPH DD and YANG BH (2010) Friction factor correlations for laminar, transition and turbulent flow in smooth pipes. Physica D: Nonlinear Phenomena 239 (14) 1318-1328. [ Links ]
LAZARUS JH and NIELSON ID (1978) A generalised correlation for friction head losses of settling mixtures in horizontal smooth pipelines. Paper B1. Proc. 5th International Conference on the Hydraulic Transport of Solids in Pipes, 8-11 May 1978, Hanover. Hydrotransport 5. [ Links ]
METZNER AB and REED JC (1955) Flow of non-Newtonian fluids - correlation of the laminar, transition and turbulent flow regions. AIChE J. 1 434-440. [ Links ]
MORI M, SEYSSIECQ I and ROCHE N (2006) Rheological measurements of sewage sludge for various solids concentrations and geometry. Proc. Biochem. 41 1656-1662. [ Links ]
MURAKAMI H, KATAYAMA H and MATSUURA H (2001) Pipe friction head loss in transportation of high-concentration sludge for centralized solids treatment. Water Environ. Res. 73 (5) 558-566. [ Links ]
PATANKAR NA, JOSEPH DD, WANG J, BARREE, RD, CONWAY M and ASADI M (2002) Power law correlations for sediment transport in pressure driven channel flows. Int. J. Multiphase Flow 28 1269-1292. [ Links ]
RUDMAN M and BLACKBURN H M (2006) Direct numerical simulation of turbulent non-Newtonian flow using a spectral element method. Appl. Math. Model. 30 1229-1248. [ Links ]
RYAN NW and JOHNSON MM (1959) Transition from laminar to turbulent flow in pipes. AIChE J. 5 433-435. [ Links ]
SKELLAND AHP (1967) Non-Newtonian Flow and Heat Transfer. Wiley, New York. [ Links ]
SLATTER PT and LAZARUS JH (1993) Critical flow in slurry pipelines. Hydrotransport 12. Proc. 12th International Conference on Slurry Handling and Pipeline Transport, 28-30 September 1993, Brugge. 639-654. [ Links ]
SLATTER PT (1994) Transitional and turbulent flow of non-Newtonian slurries in pipes. Ph.D. thesis, University of Cape Town, Cape Town. [ Links ]
SLATTER PT (1996) The laminar/turbulent transition - an industrial problem solved. Hydrotransport 13. Proc. 13th International Conference on Slurry Handling and Pipeline Transport, 3-5 September 1996, Johannesburg, South Africa. 97-113. [ Links ]
SLATTER PT (2004) The hydraulic transportation of thickened sludges. Water SA 30 (5) 66-68. [ Links ]
TORRANCE B.McK (1963) Friction factors for turbulent non-Newtonian flow in circular pipes. S.A. Mech. Eng, 13 89-91. [ Links ]
Received 30 September 2011; accepted in revised form 26 June 2012.
* To whom all correspondence should be addressed. ffi +27 21 4603512; e-mail: haldenwangr@cput.ac.za

