


Servicios Personalizados
Articulo
 Inglés (pdf)
 Articulo en XML
 Referencias del artículo
Indicadores

Links relacionados
-
 Citado por Google
 -
 Similares en Google
Compartir

 Permalink
Water SA
versión On-line ISSN 1816-7950
versión impresa ISSN 0378-4738
Water SA vol.38 no.4 Pretoria ene. 2012
Comprehensive entropy weight observability-controllability risk analysis and its application to water resource decision-making
Xun-Gui LiI, *; Xia WeiI, II; Qiang HuangIII
ICollege of Earth and Environmental Sciences, Lanzhou University, Lanzhou 730000, Gansu Province, China
IICold and Arid Regions Environmental and Engineering Research Institute, Chinese Academy of Sciences, Lanzhou 730000, Gansu Province, China
IIIInstitute of Water Resources, Xi'an University of Technology, Xi'an 710048, Shaanxi Province, China
ABSTRACT
Decision making for water resource planning is often related to social, economic and environmental factors. There are various methods for making decisions about water resource planning alternatives and measures with various shortcomings. A comprehensive entropy weight observability-controllability risk analysis approach is presented in this study. Computing methods for entropy weight (EW) and subjective weight (SW) are put forward based on information entropy theory and experimental psychology principles, respectively. Comprehensive weight (CW) consisting of EW and SW is determined. The values of observability-controllability risk (R) and gain by comparison (G) are obtained based on the CWs. The quantitative analysis of alternatives and measures is achieved based on Roc and Gbc. A case study on selection of water resource planning alternatives and measures in the Yellow River Basin, China, was performed. Results demonstrate that the approach presented in this study can achieve optimal decision-making results.
Keywords: decision making, entropy weight risk analysis, observability-controllability risk, gain by comparison, Yellow River Basin
Introduction
Water resource planning is a complex, multifactorial and multi-objective decision process involving the participation of multiple stakeholders (Wang et al., 2002) and possessing the characteristics of multidisciplinary complexity, domain-dependent knowledge, institutional constraints and cultural dimensions (Cai et al., 2004). It could result in uncertain consequences, complex interactions, and participation of multiple stakeholders with conflicting interests (Hyde et al., 2004). Decision makers are asked to select the best alternative. This decision process is always accompanied by risk. The uncertainty and risk are inevitable in planning and operation of water resource engineering, which may lead to failure in achieving the expected goals. Reliability is the capability to satisfy the requirements of the system while risk is the cost of being unreliable (Kenward et al., 1999). It is necessary to develop effective models and methods for selection of the best alternative, so as to provide strategic support for decision makers, reduce the time for problem solving and increase the probability of a better solution (Cai et al., 2004).
Over the years, many quantitative methods have been developed to facilitate making rational decisions involving multiple criteria (Islam and Abdullah, 2006), such as the analytic hierarchy process (Saaty, 1980), multiple objective analysis (Haimes and Hall, 1974; Cohon, 1978; Raju et al., 2000; Hyde et al., 2004), open and shared vision modelling (Palmer, 1999, 2000; Loucks, 2000), decision support system (Westphal et al., 2003) or group decision support system (Cai et al., 2004), uncertainty-based sensitivity analysis method (Barron and Schmidt, 1988; Triantaphyllou and Sanchez, 1997) and risk analysis (Haimes, 1998; Ezell et al., 2000). These methods or their combinations are to a certain extent effective solutions to the problems, but they have some inherent shortcomings. For example, for the multiple objective analysis method, an important issue is to represent competing objectives clearly and unambiguously to decision makers (Cai et al., 2004), but it is often difficult to provide satisfying objectives for all decision makers and errors may arise to a certain extent when the method is simplified excessively by reducing multiple objectives to one or two. In open and shared vision modelling, planning objectives and performance measures are often incorporated into a single framework to allow for the generation and evaluation of alternatives and to facilitate conflict resolution (Palmer, 1999); however, the incorporation is uncertain and not perfect or feasible. In addition, due to the subjective restriction and divarication of experts coming from different domain-dependent knowledge backgrounds and levels, there are some inevitable insufficiencies and limitations for the decision support system and group decision support system methods. The uncertainty-based sensitivity analysis and risk analysis methods can be used to analyse the change relationships between the input data and the outcomes, but they are incapable of solving their inherent uncertainties and risks (Hyde et al., 2004). The analytic hierarchy process (AHP) is regarded as one of the most successful techniques to solve decision-making problems involving multiple criteria. In AHP, a number of pair-wise comparison matrices are formed in order to derive weights of the criteria and the local weights of the alternatives. The alternative with the highest global weight is selected as the best one (Islam and Abdullah, 2006). But the AHP has some inherent drawbacks: It requires a large number of pair-wise comparisons, especially in the presence of a large number of criteria, and the exhaustive pair-wise comparison is tedious and time consuming when there are many alternatives to be considered (Hotman, 2005; Islam and Abdullah, 2006; Liebowitz, 2005).
The aim of this study is to present a simple analysis approach called comprehensive entropy weight observability-controllability risk analysis (CEWORA), based on information entropy theory (IET) and experimental psychology principles (EPP). A case study of water resource planning in the Yellow River Basin, China, was performed. In the rest of this paper, we first introduce the general concept of IET, then present the method of CEWORA and apply it to the decision of alternatives and measures in the case study.
Methods
General concept of information entropy
The concept of entropy originates from thermodynamics and represents the heat energy that cannot be used to generate work. It is a ratio of the variation of heat to the variation of temperature. In 1948, Shannon and Weaver (1948) introduced the entropy concept into information theory and measured the amount of information with it. Information entropy is a measure of the disorder in a system and can be used to measure the degree of disorder of unpredictable, unstructured and complex systems (Mays et al., 2002; Samanta and Roy, 2005). Information entropy has been applied extensively to the fields of engineering, society and economy. The concept of information entropy as defined by Shannon and Weaver (1948) is:

where:
f(x) is probability density function of independent variable x.
The unit of information entropy varies with the logarithms' base: the unit of base 2 is bits, base 10 is decibels and base natural-logarithm e is napiers (Amorocho and Espildora, 1973). The base 2 logarithm is considered in this study.
According to Eq. (1), the probability density function f(x) needs to be continuous. However, measurements are usually discrete, representing data sets that are limited in time and space in the case of laboratory or field data (Mays et al., 2002). Under this condition, suppose that a system has n kinds of states; the discrete equation is given by:

where:
pK is the probability of the rth state, subject to the condition 
Comprehensive entropy weight observability-controllability risk analysis
The approach is carried out based on the following steps:
Step 1: Suppose that there are m decision-making alternatives. Each alternative includes l indexes. The rth alternative with the j'th index has a value of k ... A decision-making matrix of Q=(k ) , is constructed.
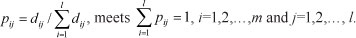
Step 2: Standardise the matrix Q and mark it standardisation matrix D, D=(d. ) where d.. is calculated as follows:

Step 3: Normalise the matrix D and mark it normalisation matrix P, P=(p.) where
According to Eq. (2), the information entropy of the jth evaluation index is

Step 4: When 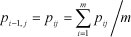 , there exists the maximum entropy i?max=log2m. Then the evaluation entropy value of the j'th index is defined as:
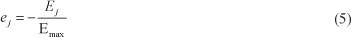
The evaluation entropy indicates the important degree of index. The smaller the value of e , the greater the information content provided by the j'th index (Ding and Shi, 2005).
Step 5: On the basis of Eq. (5), the entropy weight (EW) of the j'th index in the comprehensive appraisal is defined as follows:
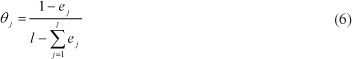
where:
θj is the entropy weight of the jth index and 
The EW calculated by Eq. (6) is an objective weight, which depends on the inherent information of decision alternatives.
Step 6: The experience and judgment from decision makers cannot be ignored in the decision-making process, a subjective weight (SW) of index is presented as follows, based on the EPP:
where:
F(i) is the degree of membership of the ith index F(i)=Ln(/-i+2)/Ln(/+1), i=1,2,..., l It is the degree of membership of the ith index
Step 7: Combining the EW with the SW, the comprehensive weight (CW) is defined as:
where:
wj is the CW of the j'th index and 0<wj<1.
The comprehensive weight matrix W can be built based on all the combined situations of 5 CWs of w: W=(w.) , n=l(l-1)(l-2>-21.
Step 8: A type of risk called observability-controllability risk (Roc) is proposed to indicate the risk that the expected targets cannot be achieved. It results from the uncertainty of the observability-controllability objectives and results, and the limitation of capacity of executants. According to the observability-controllability model of periphery (COMP) presented by Li and Wei (2011), a certain relationship exists between the system inner state and the system input and output. In terms of the feedback information from the system, the controller could make corresponding responses and take some measures to control the system inputs, outputs and states, based on the changing relationship between the system and the environment, in order to promote the coordinated and stable de velopment of the system. This process continues until the termination condition or the system objective requirement is met. However, due to the insufficient information, the uncertainties of observability-controllability objectives and their background and the limitation of controller's capacity, the expected values may not be achieved, which will result in risk. Thus the risk exists objectively between observability and controllability of the system: the higher the degree of observability-controllability of the system, the larger the amount of information, and the smaller the uncertainty and the risk, and vice versa. Even though the expected condition is the same, the risk varies with the observability-controllability controller, objective, background, mode and guidance basis. Therefore, the observability-controllability risk has a statistical significance. It can be defined based on the dispersion degree of the stochastic variable in statistics, which is shown as follows:
where
i=1,2,...,m
k=1,2,...,n
n=l×(l-1)×(l-2)×···×2×1
rik is the value of Roc
wkj is the comprehensive weight
vik is the expected value of each alternative expressed by the product of standardisation matrix D and comprehensive weight W, i.e., V=(vik)=(D·WT)m×n
The gain by comparison (Gb ) is the subsystems' relative income share per unit payout or investment when both the total investment and income of the system approach 100% under the risk condition, which is shown as:

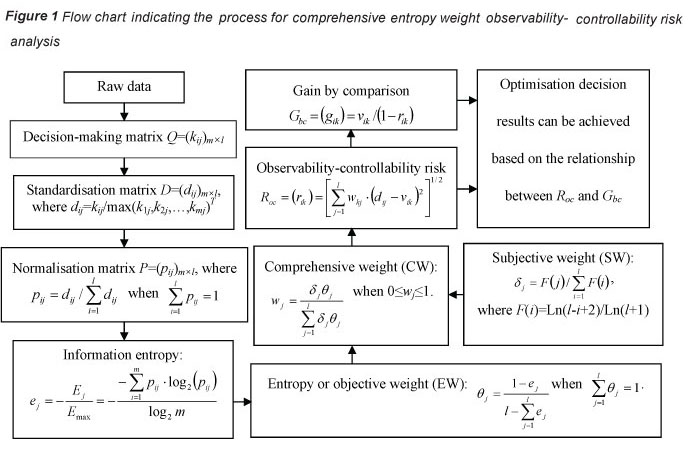
The flow chart of the approach is shown in Fig. 1.
According to Eq. (10), a close relationship exists between G and R . The greater the G is, the greater the R is. It indi bc oc D bc 7 D oc cates that huge risk could be changed into huge gain. Under the permitted value range of risk, the alternative with the largest risk value has the greatest benefit in general. If the real allowable value of risk is set as a certain value, such as R0, then only the alternative with the greatest gain and satisfying the condition of Roc<R0 could be adopted as the optimal one. Therefore, optimal decision results can be achieved based on the alternative with the greatest value of Roc or Gbc under the permitted condition of risk.
Case study
Statement of the problem
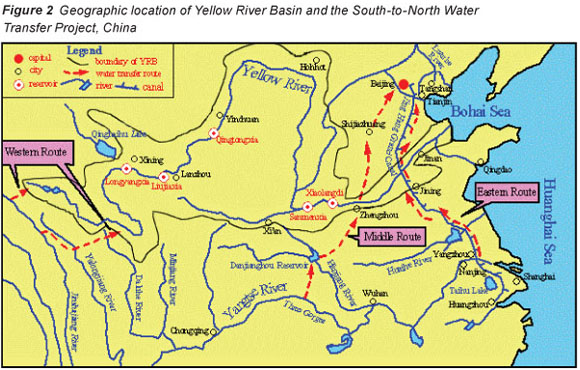
The Yellow River (YR) originates on the Qinghai-Tibet Plateau, China, and makes its way to the Bohai Sea (Fig. 2). The river is the second-longest (5 464 km) in China and its basin covers an area of 722 000 km2. The total average yield is about 72.8 x 10⁹ m3.
With the development of economy and society, the water requirements in the Yellow River Basin (YRB) have increased rapidly. The Yellow River has one of the highest water resource exploitation intensities in the world. For example, the total amount of water consumption by industry, agriculture and domestic uses was 42.1 x 10⁹ m3 in 1998, accounting for 72.5% of the average annual runoff (AAR), and 48 x 109 m3 in 2000, 82% of the AAR (RPDRI, 2001). The intensity of demand for water resources and the alteration of natural conditions have resulted in the occurrence of water resource problems in the YRB, such as water resource shortages, flooding, and deterioration of ecological function.
The key factor leading to the problems mentioned above is the disharmony between the surface water-soil-environment system and the social-econom c system in YRB. The exploitation and utilisation of water resources should be consistent with the natural laws of water resources. However, intensive human activities have strongly altered the natural water cycle, leading to serious contradictions between supply of and demand for water resources. In order to achieve the sustainable development of water resources, it is necessary to use water saving, water recycling, water transfer and flood utilisation processes in the YRB.
Alternatives and measures to solve water resource problems in the Yellow River Basin
In order to achieve harmonisation between demand and supply of water resources, attention should be given to balancing the demand and supply sides of water resource management. The supply side here indicates the quantity of water resource supply, including surface and groundwater, in terms of current exploitation and utilisation capability; while the demand side mainly denotes the quantity of demand for water resources forecast by future planning. The difference and contradiction between the two sides should be considered.
With regard to this situation, some feasible ways to solve the water resource problems in YRB have been suggested, after the appropriate consultation, appraisal and assessment of Chinese governors from the Yellow River Conservancy Commission, stakeholders from all walks of life, experts from all backgrounds and researchers and academics from universities. The suggested methods include: water saving in industry (WSI) and agriculture (WSA); water transfer from the South-to-North Water Transfer Project (WTP) of China (see Fig. 2); recycling utilisation of sewage (RUS); and floodwater utilisation (FWU).
The WSI and the WSA are implemented to cut down the water demand and both are considered to yield a water-saving rate of 10%. The WTP is executed so as to increase the available water supply of YRB. Water is proposed to be transferred from the Yangtze River Basin to the YRB to supplement the water supply. A water volume of 2 or 3 x 10⁹ m3 transferred from the middle and eastern routes of the South-to-North Water Transfer Project (see Fig. 2) is considered.
Under the current permissive social-economic condition, about 0.3 x 10⁹ m3 of water recycling volume from the RUS is realised to increase the available amount of water supply in YRB.
The FWU measure is implemented to raise the flood limit level of Xiaolangdi Reservoir (Fig. 2) from September to October, which could add floodwater storage capability of about 2 x 10⁹ m3 and relieve tensions around water utilisation in the lower reaches of YR.
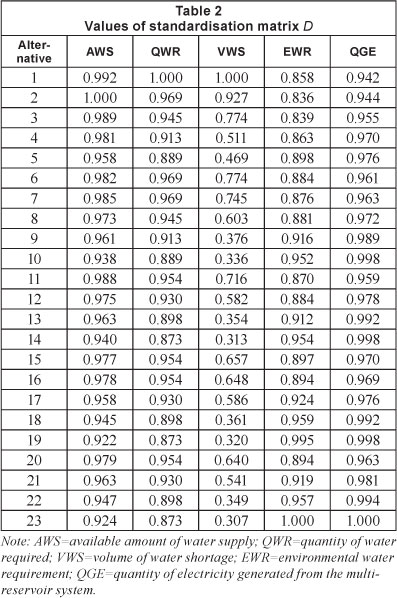
Based on the above methods, 23 groups of alternatives were set after the appropriate consultation, appraisal and assessment by the workgroup (Table 1). Five indexes were selected to evaluate the alternatives, including the available amount of water supply, the quantity of water required, the volume of the water shortage, the environmental water requirement (quantity) and the quantity of electricity generated from multiple reservoirs in the main stream of YR (Longyangxia, Liujiaxia, Qingtongxia, Sanmenxia and Xiaolangdim; see Fig. 2). These indexes can all be easily quantified. Therefore, a decision-making matrix Q23x; is constructed. The values of d of the standardisation matrix D are given in Table 2.

Results and discussion
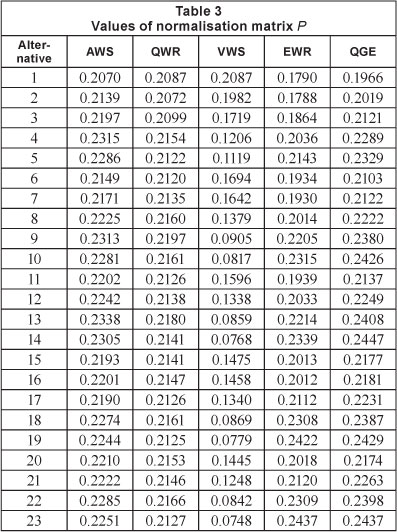
According to the proposed approach (see the flow chart in Fig. 1) and the values dij of standardisation matrix D in Table 2, we can determine the values of normalisation matrix P, information entropy (Ej) and evaluation entropy (ej), based on Eqs. (4) and (5), which are shown in Tables 3 and 4.
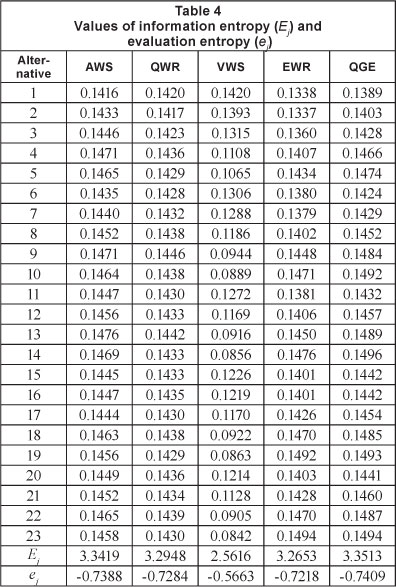
According to Eq. (6), the EWs are determined as (0 62, 63, 64, 65) = (0.2047, 0.2034, 0.1844, 0.2027, 0.2049). The membership degree of F(i) and the subjective weight (SW) are calculated as (F(1), F(2), F(3), F(4), F(5)) = (1.0000, 0.8982, 0.7737, 0.6131, 0.3869) and (81, S2, <53, <54, 8) = (0.2723, 0.2446, 0.2107, 0.1670, 0.1054), respectively, in terms of Eq. (7). The comprehensive weight (CW) can be determined based on Eq. (8): (w1, w2, w3, w4, w5) = (0.2790, 0.2491, 0.1944, 0.1694, 0.1081). Thus a comprehensive weight matrix W120x5 can be built based on all the combined numbers of the 5 CWs. The 36 x 120 size matrix V of expected value v.k is also derived in terms of the product of the standardisation matrix D36x5 and the transposed comprehensive weight matrix (W T)5x120. Therefore, based on Eqs. (9) and (10), two 36 x 120 size matrices of observability-controllability risk (Roc) and gain by comparison (Gbc) are derived. This means that there are 120 types of results for Roc and Gbc, respectively. Further analysis demonstrates that each kind of result of R or Gbc shows the same changing trend. So it can be expressed with the average of 120 values of R or G . The changing trends of average Roc and Gbc and their relationship can be shown in Figs. 3 and 4.
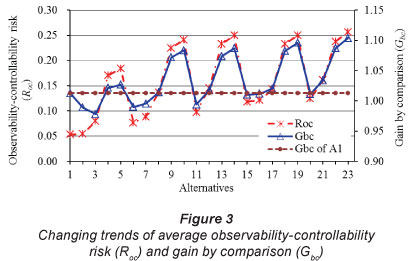
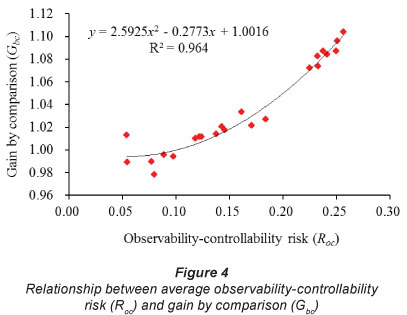
From Fig. 3, the changing trend of average gain by comparison (Gbc) is approximately consistent with that of observability-controllability risk (Roc). Alternative 1 (A1 in Fig.3) is a comparative alternative without any decision measures (see Table 1). Figure 4 shows the relationship between average Gbc and Roc , which shows that Gbc, is in direct proportion to Roc . We fitted the data of Gbc (y) and Roc (x) and obtained a best-fit curve ofy=2.5925x2-0.2773x+1.016 (R2=0.964). The value range of independent variable x in the curve is [0.0538, 0.2566]. The maximal slope K =1.053 when x=0.2566 with y=0.9886. Thus the coordinate point of (0.2566, 0.9886) is the most optimal point in the curve. In addition, according to Fig.3, the values of Roc and Gc of Alternative 23 (A23) are 0.2566 and 1.1039, respectively, and the coordinate point of (0.2566, 1.1039) for A23 is nearest to the most optimal point of (0.2566, 0.9886). In theory, A23 is the most optimal alternative.
On the other hand, Table 1 shows that Alternative 23 encompasses all of the methods/measures which make the greatest contribution to the total amount of available water resources. It is easy to estimate that A23 offers a larger gain than the other alternatives; this is also suggested by the risk value of A23. If a real allowable risk value is considered and is larger than that of A23, then the alternative of A23 can be adopted as the optimal one. But if the allowable risk value is smaller than that of A23, A23 is no longer the best alternative. For example, if the permitted risk is set as 0.2000, then A23 is not the most optimal alternative. Only those alternatives satisfying the condition of Roc<0.2000 could be considered as the better options. From Fig.3, though Alternatives 9, 10, 13, 14, 18, 19, 22 and 23 have larger values of Gbc, they are not satisfactory selections because they can't meet the requirement of R <0.2000. In this case, the optimisation alternative is no longer A23, but A5. Therefore, selection of the optimisation alternative is subject to the allowable value of risk in reality.
According to Table 1, 5 methods/measures, WTP, RUS, FWU, WSI and WSA, have been suggested to solve the water resource problems in YRB. It is difficult to carry out a comparison between the 5 methods because of their different contexts and related industries. In addition, the relationship between input and output is also different. However, from the viewpoint of increasing water resource availability and reducing water resource shortage, their benefits and risks could be quantified and compared in terms of the approach presented in the study, as can their priority-ranked order. In order to explain, quantitatively and efficiently, the priority-ranked order of measures or the influence of a certain measure on the results, only those alternatives with the same measures or without a certain measure could be adopted to perform the comparison. For example, in order to analyse the influence of the RUS measure, the comparison between A7 and A11, or A8 and A12, A9 and A13, A10 and A14, should be carried out. Results show that the difference between R and G is approximate in the case of the same methods, of WTP, FWU, WSI and WSA. This means that the RUS method has a small degree of influence on the results. In a similar way, by the comparison between A1 and A2, or A6 and A7, A15 and A16, the degree of difference between R and Gbc is also not distinct under the same conditions (with the methods WTP, RUS, WSI and WSA), which shows that the FWU method does not have an important effect on the results. The Gbc of A2, in particular, is much smaller than that of A1. From the comparison between A6 and A15 (both alternatives only involve WTP), the values of R and G are rather small.
On the basis of the analysis between A5, A10, A14, A19 and A23, if a certain alternative consists of both WSI and WSA, the values of R and G will be close to the largest. A1 is a basic and comparative alternative which does not involve any of the available methods/ measures (WTP, RUS, FWU, WSI or WSA) and its priority-ranked order of Gbc is 15 (see Fig.4), which is larger than that of A2, A3, A6, A7,A11, A15, A16 and A20. This indicates that these alternatives are rather disadvantageous due to the absence of any water-saving measures in agriculture (WSA). At the same time, based on the comparison among A5, A10 and A19, we see that the greater the water volume transferred from the middle and eastern routes of the South-to-North Water Transfer Project, the greater the values of Roc and Gbc. Therefore, according to the analysis of different measures, a priority-ranked order of decision measures can be achieved as: WSA>WTP>WSI>RUS>FWU. This indicates that the WSA method/measure has the most important positive influence on the results.
Conclusions
This study presents a comprehensive entropy weight observability-controllability risk analysis approach to decision-making for alternatives and measures in water resource planning of the Yellow River Basin, China. Results demonstrate that the approach provides a new analysis method for the decision field of water resource planning.
According to the relationship between Roc (x) and Gbc (y) shown in Fig. 4, there is a best-fit curve ofy = 2.5925x2 -0.2773x + 1.016 with a high degree of correlation (R2=0.964). The Gbc (y) is in direct proportion to the Roc (x). At the point on the curve with coordinates of (0.2566, 0.9886) the maximal slope Kmax= 1.053, indicating the most optimal point. If the real allowable value of risk is considered and set as a certain value, such as R0, only the alternative with the shortest distance of point (Roc, Gbc) to the optimisation point (0.2566, 0.9886), and satisfying the condition of Roc < R0, could be adopted as the optimal one. In addition, a priority-ranked order of measures can be achieved as: WSA>WTP>WSI>RUS>FWU in terms of the comparison of those alternatives with the same measures or without a certain measure.
Acknowledgements
This study was supported by the National Natural Science Foundation of China (Nos. 51109103 and 41001154), the Research Fund for the Doctoral Program of Higher Education of China (No. 20090211120021) and the Fundamental Research Funds for the Central Universities of China (Nos. lzujbky-2010-103 and lzujbky-2012-139). The authors gratefully acknowledge this support. The authors would also like to express their appreciation to the editor and anonymous reviewers for their constructive and valuable comments and suggestions.
References
AMOROCHO J and ESPILDORA B (1973) Entropy in the assessment of uncertainty in hydrologic systems and models. Water Resour. Res. 9 (6) 1511-1522. [ Links ]
BARRON H and SCHMIDT P (1988) Sensitivity analysis of additive multiattribute value models. Oper. Res. 36 (1) 122-127. [ Links ]
CAI XM, LASDON L and MICHELSEN AM (2004) Group decision making in water resources planning using multiple objective analysis. J. Water Resour. Plann. Manage. 130 (1) 4-14. [ Links ]
COHON JR (1978) Multiobjective Programming and Planning. Academic, New York, USA. [ Links ]
DING SF and SHI ZZ (2005) Studies on incidence pattern recognition based on information entropy. J. Inf. Sci. 31 (6) 497-502. [ Links ]
EZELL BC, FARR JV and WIESE I (2000) Infrastructure Risk Analysis Model. J. Infrastruct. Syst. 6 (3) 114-117. [ Links ]
HAIMES YY (1998) Risk Modeling, Assessment, and Management. Wiley, New York, USA. [ Links ]
HAIMES Y and HALL W (1974) Multiobjective in water resources systems analysis: The Surrogate Worth Trade-Off Method. Water Resour. Res. 10 (4) 615-624. [ Links ]
HOTMAN E (2005) Base reference analytical hierarchy process for engineering process selection. Lect. Notes Comput. Sci. 3681 184-190. [ Links ]
HYDE KM, MAIER HR and COLBY CB (2004) Reliability-based approach to multicriteria decision analysis for water resources. J. Water Resour. Plann. Manage. 130 (6) 429-438. [ Links ]
ISLAM R and ABDULLAH NA (2006) Management decision making by the analytic hierarchy process: a proposed modification for large-scale problems. J. Int. Bus. Entrepreneurship Dev. 3 (1/2) 18-40. [ Links ]
KENWARD TC and HOWARD-CHARLES DD (1999) Forecasting for urban water demand management. Proc. 29th Annual Water Resources Planning and Management Conference, ASCE, 6-9 June 1999, Tempe, Arizona. URL: http://ascelibrary.org/doi/abs/10.1061/40430%281999%29245. [ Links ]
LI XG and WEI X (2011) Soil erosion analysis of human influence on the controlled basin system of check dams in small watersheds of the Loess Plateau, China. Expert. Syst. Appl. 38 (4) 4228-4233. [ Links ]
LIEBOWITZ J (2005) Linking social network analysis with the analytic hierarchy process for knowledge mapping in organizations. J. Knowl. Manage. 9 (1) 76-86. [ Links ]
LOUCKS DP (2000) Achieving a consensus in the restoration of the Everglades: a challenge for shared vision modelers. Proc. Joint Conference on Water Resource Engineering and Water Resources Planning and Management, ASCE, 30 July - 2 August, 2000, Minneapolis, Minnesota. URL: http://ascelibrary.org/doi/abs/10.1061/40517%282000%29163. [ Links ]
MAYS DC, FAYBISHENKO BA and FINSTERLE S (2002) Information entropy to measure temporal and spatial complexity of unsaturated flow in heterogeneous media. Water Resour. Res. 38 (12) 1313-1323. [ Links ]
PALMER RN, WERICK WJ, MACEWAN A and WOODS AW (1999) Modeling water resources opportunities, challenges and tradeoffs: the use of shared vision modeling for negotiation and conflict resolution. Proc. 29th Annual Water Resources Planning and Management Conference, ASCE, 6-9 June 1999, Tempe, Arizona. URL: http://ascelibrary.org/doi/abs/10.1061/40430%281999%291. [ Links ]
PALMER RN (2000) Task committee report on shared vision modeling in water resources planning. Water Resour. 104 166-169. [ Links ]
RAJU KS, DUCKSTEIN L and ARONDEL C (2000) Multicriterion analysis for sustainable water resources planning: a case study in Spain. Water Resour. Manage. 14 (6) 435-456. [ Links ]
RPDRI (RECONNAISSANCE, PLANNING, DESIGN AND RESEARCH INSTITUTE OF YELLOW RIVER CONSERVANCY COMMISSION, MINISTRY OF WATER RESOURCES) (2001) Studies of key technology for water resources development and sediment reduction and cleaning in river courses of the middle and lower reaches of the Yellow River. Sub-Project of National Key Science and Technology Plan in the 9th Five-Year Plan Period (NO.98-928-01-01-02). Zhengzhou, China (in Chinese). [ Links ]
SAATY TL (1980) The Analytic Hierarchy Process: Planning, Priority Setting, Resources Allocation. McGraw-Hill, New York, USA. [ Links ]
SAMANTA B and ROY TK (2005) Multiobjective entropy transportation model with trapezoidal fuzzy number penalties, sources, and destinations. J. Transport. Eng. 131 (6) 419-428. [ Links ]
SHANNON CE and WEAVER W (1948) The Mathematical Theory of Communication. University of Illinois Press, Urbana. [ Links ]
TRIANTAPHYLLOU E and SANCHEZ A (1997) A sensitivity analysis approach for some deterministic multi-criteria decision-making methods. Decis. Sci. 28 (1) 151-194. [ Links ]
WANG H, QIN DY and WANG JH (2002) Concept of system and methodology for river basin water resources programming. J. Hydraul. Eng. 33 (8) 1-6. [ Links ]
WESTPHAL KS, VOGEL RM, KIRSHEN P and CHAPRA SC (2003) Decision support system for adaptive water supply management. J. Water Resour. Plann. Manage. 129 (3) 165-177. [ Links ]
Received 12 October 2011; accepted in revised form 9 July 2012.
* To whom all correspondence should be addressed. ffi +86-931-8912712; fax: +86-931-8912712; e-mail: lixung@lzu.edu.cn or lixgwx@yahoo.com

