


Serviços Personalizados
Artigo
 Inglês (pdf)
 Artigo em XML
 Referências do artigo
Indicadores

Links relacionados
-
 Citado por Google
 -
 Similares em Google
Compartilhar

 Permalink
Water SA
versão On-line ISSN 1816-7950
versão impressa ISSN 0378-4738
Water SA vol.38 no.4 Pretoria Jan. 2012
Prioritising alternatives for maintenance of water distribution networks: a group decision approach
Flavio Trojan; Danielle Costa Morais*
Federal University of Pernambuco, Av. Prof. Moraes Rego, 1235, Cidade Universitária, 50670-901 Recife, PE, Brazil
ABSTRACT
Difficulties related to the group decision-making process in the water supply sector, such as physical and economic losses, irrational use of water and maintenance costs, highlight the need to develop procedures to support decisions, reducing unnecessary water use and wastage. This study focused on the rational use of water resources and reduction of water losses, based on the assumption that it is far more economical to develop and improve existing systems rather than build new systems in parallel to the existing one. This study aimed to support a group decision-making process in the maintenance section of a water supply company. A model is proposed consisting of 2 phases, which aggregates individual preferences to achieve a group decision. The first phase is based on the ELECTRE II method, analysing individual preferences, while the second is based on the COPELAND method to aggregate individual preferences. From this model, we developed a software program to prioritise alternatives, simultaneously taking into account subjective and objective criteria, and thereby giving decision makers a clear and comprehensive overview of alternatives, indicating the most suitable alternative based on the preferences of group members from different areas.
Keywords: group decision; multi-criteria; maintenance; water networks
Introduction
Issues related to prioritisation of alternatives or general decision-making in water utility companies are always connected to conflicts of preference among managers who have different interests in attending to the company's goals. The fact that there is more than one decision maker in any kind of prioritisation process regarding water resources implies that conflicts will exist.
In the maintenance sector of water utilities the discrepancies can become even greater because decision makers are simultaneously involved with economic and environmental issues. So what seems to be an ideal alternative to a manager (DM) might not satisfy others or may not be a very attractive alternative.
Furthermore, the problems faced by water utilities in large cities, such as population growth, extended periods of drought, irrational use of water, lack of planned maintenance and the inadequate operation and maintenance of distribution and treatment systems add to the decision making challenge. Making the correct decisions in the implementation of preventive and reparatory actions is necessary in order to minimise losses in the operation of water networks, and thus extend natural resource supply and minimise environmental impacts.
However, there are many difficulties in making decisions regarding the selection or prioritisation of the maintenance processes to be deployed in a water distribution system; alternatives can be assessed by different criteria, which are usually in conflict. Given that the final decision should result from the preferences of a group of managers, the decision problem can become even more complex.
Ganoulis et al. (2008) emphasize that sustainable implementation of private or public utility projects cannot be achieved without public participation and a clear consensus among stakeholders. In addition, when multiple decision makers are involved in water resource management, each one acts in their own right, using different value systems (Morais and Almeida, 2012); for this reason, it is necessary to establish a collective preference based on the aggregation of different individual preferences.
Silva et al. (2010) claim that since water resource management decisions usually have a great impact on activities of the city and also on the private sector, the possibility of generating conflict is very high. Thus, a structured decision model is necessary, using an analyst who is as impartial as possible, in order to establish a relationship of trust between members of the group. All stages of this model should be designed to promote impartiality of the analyst, including the formulation of alternatives and the involvement of a competent committee to evaluate these alternatives. It is also important to include a conflict resolution phase, in which it is possible to change some parameters of the model.
Ganoulis et al. (2008) developed a process in which multi-criteria decision analysis (MCDA) techniques, related to different attributes and a set of goals, were applied to manage potential conflicts in transboundary areas of different countries. Yilmaz and Harmancioglu (2010) developed a water resource management model for the Gediz River Basin in Turkey, which facilitates the elaboration of indicator-based decisions with respect to environmental, social and economic dimensions from a multi-criteria perspective. They indicated that the resulting decision regarding the choice of alternative is basically independent of the multi-criteria method used, but slightly sensitive to weights assigned to criteria as well as data used in the analyses.
Other studies are being undertaken using MCDA to aggregate preferences of decision makers in a single result as a group view. For example, Alencar et al. (2010) presented a decision model applying ELECTRE methods for aggregation of individual priorities to resolve conflicts among decision makers. Multicriteria analysis has been applied to provide solutions for complex water decision-making problems (Pietersen, 2006; Morais and Almeida, 2007; Morais et al., 2010; Morais and Almeida, 2010; Silva et al, 2010), and this earlier work has led to the study reported herein, which is based on the aggregation of individual preferences of decision makers in the maintenance sector of water supply networks.
Several multicriteria techniques exist; adoption of a particular model is usually justified by arguments dictated by the nature of the problem under investigation (Vincke, 1992). The best-known family of outranking methods is ELECTRE (Elimination Et Choice Traidusaint la REalite), which consists of the following methods: ELECTRE I (Roy, 1968), ELECTRE II (Roy and Bertier, 1971), ELECTRE III (Roy, 1978), ELECTRE IV (Roy and Hugonnard, 1981), ELECTRE IS (Roy and Skalka, 1985) and ELECTRE TRI (Yu, 1992). Since its appearance, this method has been widely used by multi-criteria decision making (MCDM) researchers, mainly in Europe, and has proven useful in numerous applications (e.g. Al-Kloub et al., 1997; Al-Rashdan et al. 1999; Dotto et al., 1996; Duckstein et al., 1982; Lamy et al., 2002).
Also Borda's method, which in essence is a sum of the ranks, has a great advantage of simplicity, and therefore some of its variants are used in sporting competitions (Kladroba, 2000). All alternatives are arranged in descending order of score (which guarantees respect for the axiom of totality). However, in spite of its simplicity and extensive use of its variations, the Borda method does not respect one of the most important axioms of Arrow and Raynaud (1986): the independence from irrelevant alternatives. This may lead to distortions, especially in the extreme dependence of the results on the chosen set of assessment and the possibility of dishonest manipulations.
The method developed by Condorcet, considered to be the founder of the French school of multicriteria, works with relationships of resilience. In the Condorcet method, the alternatives are compared in pairs and a graph that expresses the relationship between them is built. Through the representation of preference relation by a graph, the determination of dominant and dominated alternatives (if any) is greatly facilitated. As there is one, and only one, dominant alternative, it is chosen. However, this can lead to the 'Condorcet paradox', or intransitivity situation. This happens when alternative a overcomes alternative b, which exceeds alternative c, which in its turn overcomes alternative a ('Condorcet triplet'). This situation, although it can be utilised in certain problems, makes it impossible to generate an ordering of alternatives. When transitivity cycles do not appear, the Condorcet method is preferred to the Borda method.
Copeland's method uses the same adjacency matrix that represents the graph of the Condorcet method. From this, the sum of victories minus defeats is calculated, in a simple majority vote. The alternatives are then arranged according to the result of that sum. Copeland's method combines the advantage of always providing one total order (unlike the Condorcet method) and giving the same result as Condorcet when the latter does not show any transitivity cycle. When these cycles exist, the Copeland method allows for sorting and maintaining the ordering of alternatives that do not belong to any cycle of transitivity.
In this study, efforts were focused on the ELECTRE II method, to obtain individual rankings derived from the decision maker's preference. This was done by considering the alternatives against criteria that did not generate any level of dissatisfaction for any criteria examined. With individual rankings from all decision makers, the Copeland method was then chosen to aggregate the rankings and produce a final global ranking.
Proposed group decision model
The proposed group decision model to prioritise alternatives for water distribution network maintenance considers relevant criteria to evaluate the problem and different preferences of water utility managers (managers who represent different sectors, such as network maintenance, production, planning, administration and commercial).
The model consists of 2 main phases. In the first phase, each group member evaluates the alternatives against all criteria based on their own preferences, with the assistance of the ELECTRE II method to rank the alternatives. From the results presented by ELECTRE II, a new matrix of alternatives per decision maker is built. This information will then be input for the analysis of preferences aggregation, which is the second phase of the model. In the latter phase, the individual rankings are aggregated, based on Copeland's method, to achieve a final ranking that represents the preferences of the group of decision makers.
Thus, with this model decision makers will not be exposed to negotiations or resolution of direct conflict between them. Through multi-criteria methods each decision maker will establish an order, according to his/her preferences, and later this order will be compared with the rankings of other decision makers to generate a comprehensive and consensual decision. Development of the model aimed to improve procedures to order the alternatives that also maintain the quality of the water supply to the population connected to the distribution networks.
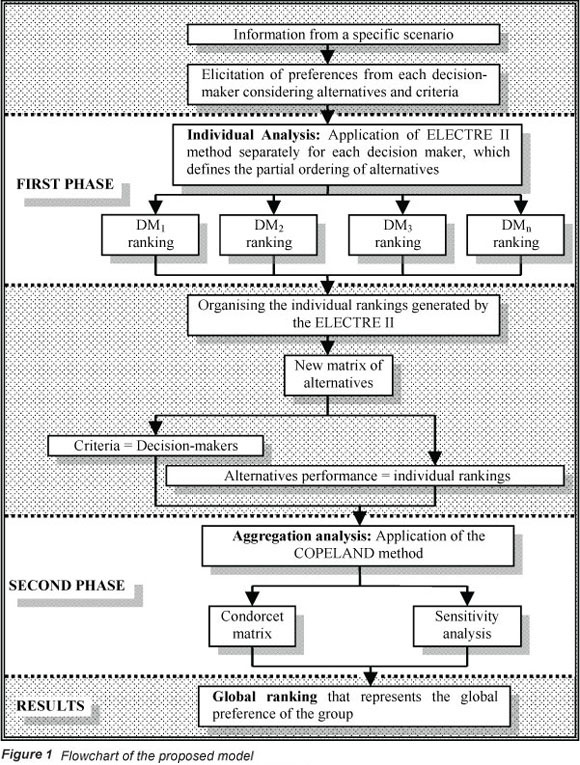
Firstly, information must be collected from a specific scenario that is a definition determined in a higher-level forum by directors or governors. At this stage the alternatives and criteria are already defined. The next step is the determination of decision-makers and elicitation of preference for each decision maker, considering alternatives and criteria as well as their respective weights, scales and values. In the first phase the application of the ELECTRE II method occurs separately for each decision maker, which defines the partial ordering of alternatives. At this stage this partial ordering represents the preferences of an individual decision maker. Several individual and partial orderings about the problem are then generated.
Before the second phase, organisation of the individual rankings generated by the ELECTRE II method is carried out. This creates a new matrix of alternatives, where the decision makers are now considered as criteria, and the performance of each alternatives is the ranking generated in the first phase. In the second phase an aggregation analysis is done by application of the COPELAND method. This is based on the Condorcet matrix, which will give support to the generation of a global order that represents the opinions or preferences of the decision makers. Even at this stage it is possible to do a sensitivity analysis in order to know the possible variations of the model. Finally, the results are presented as a global ranking that represents the group preferences.
Figure 1 shows a flow chart of the model with the sequence of the steps. It is possible to visualise the tasks that must be met to develop the model efficiently.
The ELECTRE II Method
The ELECTRE II method, in its analysis process, breaks down the goals into criteria. The comparisons between alternatives are carried out at the last level of decomposition and in pairs, through the establishment of a relationship that follows the margin of preference dictated by the decision agents, seeking an order from the set of potential alternatives, through the concept of dominance (MOUSSEAU et al., 2002). It is a noncompensatory method that requires inter-criterion information corresponding to the relative importance among the various objectives, in other words, criteria weights. These weights may be due to technical calculations or expressions of judgment of value. Thus, this method promotes more balanced actions, which have better average performance.
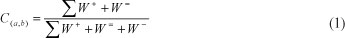
ELECTRE II, exploiting outranking relationships, aims to categorise actions from the best to the worst, through the concepts of Concordance Index - C(a,b) Discordance Index - D(a,b) Threshold of Concordance -p, Threshold Mismatch - q, and Relationships Overrating (Vincke, 1992). According to Vincke (1992), a p. weight is assigned for each criterion, which grows with the importance of the criterion, and for each ordered pair (a,b) of actions indices are associated with the construction of the outranking relationship. Thus, the correlation between two alternatives, a and b, is a considered weighted measure of the number of criteria under which alternative a is preferred or equivalent to alternative b. The mathematical expressions for these indices were proposed by Olson (1996) as follows:
W+ Weights of the criteria under which a-<b;
W = Weights of the criteria under which a = b;
k → criteria under which b >J a;
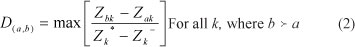
Zbk → evaluation of Alternative b under the Criterion k;
Zak → evaluation of Alternative a under the Criterion k;
Zk* → better evaluation degree obtained for Criterion k;
Zk- → worse evaluation degree obtained for Criterion k
Concordance rates are presented in the form of a matrix of agreement, where the expression (1), C(a,b) represents the element of Line a and Column b; in other words, the decision maker's satisfaction if they prefer Alternative a to Alternative b, under certain criteria.
The rates of discordance in the expression (2), D(a,b) represent the discomfort felt by the decision maker in choosing Alternative a instead of Alternative b.
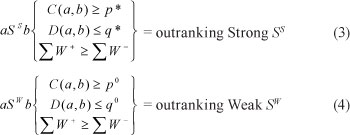
This method still exploits two levels of outranking: one strong (SS) in (3) and one weak (SW) in (4) and assumes that some parameters (p *, q *, p0, q0) that will serve as boundaries of concordance and discordance are required to identify the relationships of dominance.
The ELECTRE II provides one complete ordering of alternatives by building two complete pre-orders, one descendant from the best alternatives to the worst RankS, and another built from the least favourable alternatives towards the best Rankw The alternatives are analysed in relation to RankS and Rankw in various interactions. To the alternatives that pass the 2 tests a new order is attributed, and they are removed from the analysis process which is restarted with the remaining alternatives until all of them have been sorted.
The second pre-order is constructed similarly, but upside down (from the worst to the best alternatives), obtaining a reverse order. From the reverse order, the weak order is performed, considering the formula proposed by Olson (1996):
RankW = 1 + number of interactions - reverse order of the alternative in question
According to Vincke (1992), both pre orders obtained, in general, are not the same and the decision maker should be offered a median pre-order (RankM = (RankS + Rankw) / 2), the position of which is the identification of their order of preference.
The Copeland Method
Copeland's method can be considered to be a compromise between the opposing philosophies of Borda and Condorcet, combining as much as possible the advantages of both methods, and was therefore the chosen approach for this study.
The Copeland score of an alternative x is determined by taking the number of alternatives that x defeats and subtracting from this number those alternatives that beat x. In a slightly more formal fashion, we define the Copeland score of Xj with respect to the set X of alternatives and the preference configuration P = . . . , Pn} as follows:

where:
xMy (yMXj respectively) means that the majority of voters preferred x.( y) to y(x.).
The Copeland choice function, in turn, can be expressed as follows (Nurmi, 1993):

Case study
In the maintenance of water distribution networks, the scenarios are diverse, but in this study a scenario where alternatives and criteria are initially defined by a single decision maker, represented by the government or the water utility company director, was considered. This decision maker has the power over the financial resources required to implement actions. Thus, the proposed model was applied with a group of decision makers who had the same alternative set and pre-defined criteria. Each decision maker evaluated these alternatives according to their individual preferences or the necessity of his/her area, within the context presented to him/her for prioritisation.
The objective is to demonstrate the limitations which the group of managers is subject to, when, for instance, the directors of the company define what is possible to be carried out (alternatives) and what will be considered in the decisions (criteria). This scenario is commonly found in the activities of water supply companies, that are mostly public or of joint economies, and where the investments are determined by the partners, directors or rulers.
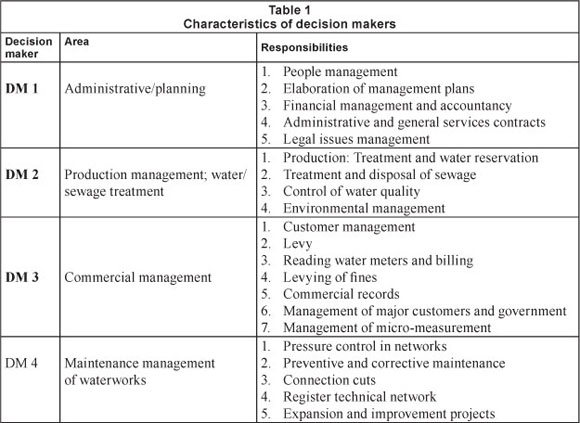
In this case study, we used a water distribution network that suffers loss and damage with poor maintenance and deployment, through the assessment made by 4 managers from a company that serves approximately 100 000 water connections. The characteristics of each decision maker involved in this process are shown in Table 1, which describes their areas of work and responsibilities.
Alternatives
Firstly, the strategies or actions defined by the water company director to achieve environmental and economic goals, separately, are verified. These are called individual alternatives, which can generate the expected results for these targets. These alternatives are listed based on statistical data for the system or even based on political desire or the availability of public funding for the sector. The strategies presented to the group of decision makers, in the first phase, which were elicited from the government, to solve problems encountered in maintaining networks are presented in Table 2.
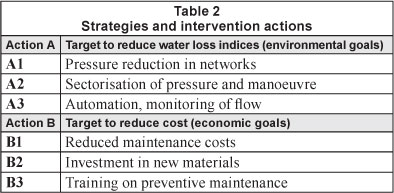
Action A - Target to reduce water loss indices
A1 Pressure reduction in distribution networks: This strategy aims to minimise the occurrence of leaks in distribution networks, and consequently reduce the rate of loss. By reducing the average pressure in the pipes, the flow of leakage will also be reduced and the volume of lost water therefore will be lower.
A2 Implementation of sectors of pressure and manoeuvre:
This action aims to subdivide large areas into smaller areas of supply to provide control over the maintenance operations. In other words, it seeks to avoid a shortage occurring over a large area when maintenance is needed on a specific location, by instead only influencing the restricted area that contains the location of interest.
A3 Automation: the automation of processes has also been targeted by sanitation companies, mainly to monitor and control water loss. In spite of requiring high investment, it contributes to a reduction in the rate of system losses in the medium term. The cost-benefit ratio ends up being advantageous for systems with high levels of losses.
Action B - Target to reduce cost
B1 Preventive maintenance, reduction of maintenance costs: In the maintenance of water distribution networks preventive maintenance plays an important role in the anticipation of events that trigger high maintenance costs. An effective action of preventive maintenance can help the maintenance manager to avoid emerging problems.
B2 Investment in new materials: Investment in new materials can mean aggregation of technology and new techniques to support optimal system operation. The costs can initially represent a barrier, but the long-term results are worth the effort in implementing this type of action.
B3 Training in preventive maintenance: Qualification is essential to the proper functioning of any company, particularly in the area of maintenance, the skills of employees can bring about economic gain when required routines are performed more efficiently than before.
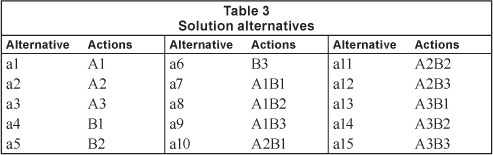
With the knowledge of these actions, several combinations that can achieve the goals outlined in the previous stage can be visualised. These combinations bring viable solutions for both goals (environmental and economic). However, one cannot attend to one or the other goal in its entirety. So the alternative needs to be found that represents the level of confidence that the group has in the combination of actions that might help them reach the goals, without being dominated by other alternatives. The combinations of interest are listed in Table 3.
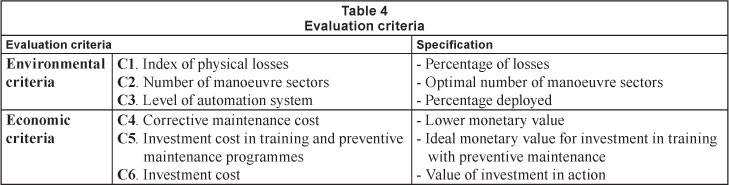
Evaluation criteria
Along with alternatives, criteria were also defined as presented in Table 4. The criteria were also imposed by the water company director, due to the fact that the financial resources used must meet these criteria, which represent levels of efficiency for this industry.
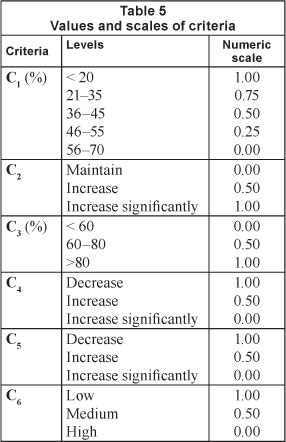
C1 Index of physical losses: The alternatives will be evaluated by decision makers according to the efficiency that each individual action or combination of actions will have in reducing the rate of system losses. This is a percentage index and it is calculated according to the lost volume (distributed volume - measured volume) divided by the amount distributed in the networks.
C2 Setting number of manoeuvre sectors: For this criterion the alternatives will be evaluated subjectively in relation to what the decision maker prefers. The alternative may cause an increase in the number of sectors of manoeuvre, maintain the current number or promote a significant increase in that number.
C3 Automation level of the system: The automation level is related to the ability of the alternative to promote an increase in the percentage level of implementation to achieve the optimal level of automation in the system.
C4 Cost with corrective maintenance: The alternative in this case will be assessed by the ability to promote a decrease, increase or significant increase in costs related to corrective maintenance.
C5 Cost with investment in training and preventive maintenance programmes: This criterion exploits the ability of the alternative to improve employees' skills as well as the effective implementation of preventive maintenance.
C6 Investment cost: The evaluation of alternatives will be also considered for its cost of implementation. The decision-maker might consider the cost of investment in alternatives to be evaluated as low, medium or high.
The maximum values of the numerical scales of the criteria considered to be benchmarks in the context of maintenance of water networks, which were used to create the 'Social Assessment of Alternatives', are shown in Table 5.
Phase 1: Individual analysis
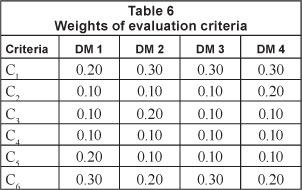
The criteria were previously established; however, their weights should be assigned by the decision makers according to the vision that they have for the process, as shown in Table 6. Consequently each decision maker will choose the weight that suits for each criterion or that will have more influence in their field.
Each decision maker does the individual assessment of the alternatives against the criteria and with the application of ELECTRE II method, as shown, for example, below, in the evaluation matrix of Decision Maker 1 (Table 7). Then, through the concordance and discordance matrices, the ordering of preferences for each individual occurs.
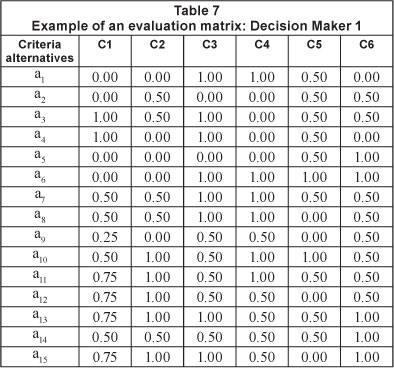
The subjective variables were defined with values 'high', 'medium' and 'low' for Criterion C6 and, 'decrease', 'increase' and 'increase significantly' for the criteria C2, C4 and C5, and represent the personal choice of each element of the group. It is expected that some differences of opinion will occur because decision makers have their own experiences in different areas such as network maintenance, management, planning, production and business.
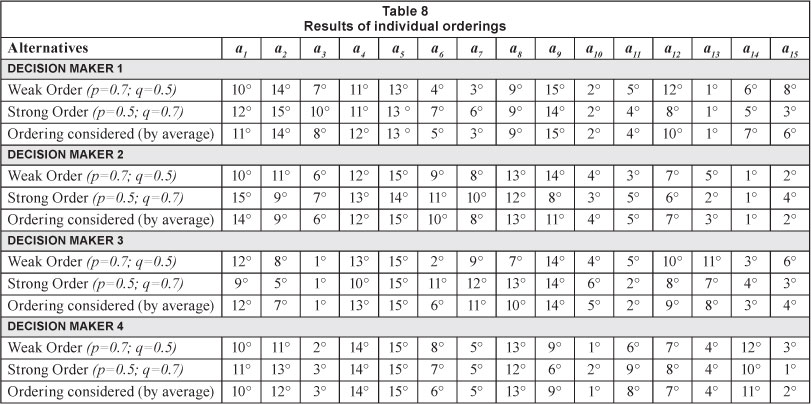
The results of the individual evaluations of each decision maker are presented in Table 8. Based on data from assessments made by decision makers, which represent the different areas of the company, an array of Concordance and Discordance of ELECTRE II can be built, and so achieve the ordination: Strong (p=0.5; q=0.7) and Weak (p=0.7; q=0.5), and a final ranking, characterised by the average of the Strong and Weak ordinations for each decision maker.
Phase 2: Aggregation analysis
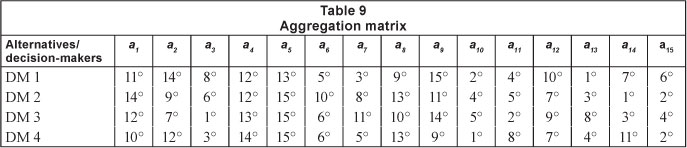
With the application of ELECTRE II method it was possible to order the alternatives under the individual preferences of each element for a group of decision makers. The goal is then to aggregate this information into a single ordinance, which will represent the preferences of the group in agreement. Table 9 shows a new matrix elaborated from the results of ELECTRE II which will be the input to the aggregation procedure.
The aggregation analysis was based on the Copeland method. As previously explained, this method represents the number of victories each alternative has in a pairwise comparison. Due to the fact that the Borda and Condorcet methods may present incompatibilities when applied, in this study we chose the Copeland method, which combines the virtues of the other two, and uses the structure of both to calculate the final ranking.
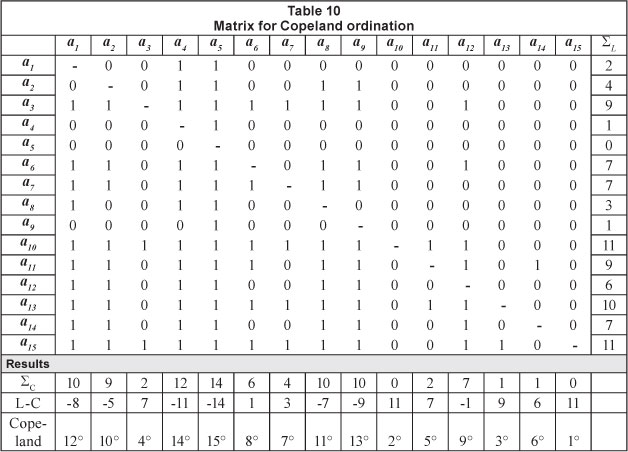
Table 10 presents the matrix configuration of the Copeland method and the interactions between the lines and columns to generate the Copeland ordination. The establishment of rules regarding the tie between the alternatives was necessary because the initial intention was not to have alternatives that present ties with one another. Thus, the number of defeats of the alternatives was defined as a tie-breaking rule, or the number of defeats is equal to the order of the definition of alternatives. Therefore, considering the tied alternatives, one that accounted for the lowest number of defeats or that was set later in the choice of alternatives will assume a privileged position over others. The weight related to the decision makers was considered equal; in other words, all four decision makers have the same importance in the decision making process, with weight = 1.
Sensitivity analysis
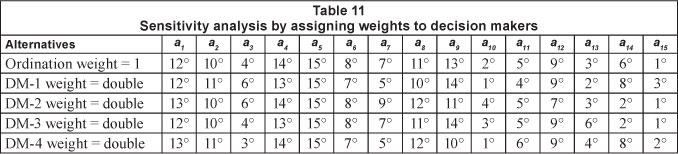
A sensitivity analysis was carried out using different weights assigned to each decision maker, with the aim of understanding whether this change in the relative importance of a decision-maker would substantially alter the final result. It can be concluded that some changes occurred, but the differences between individual exchanges of views were more pronounced in the higher orders (Table 11). The relative weight of 0.5 was considered; in other words, the decision maker with this weighting had their preferences valued twice as much in relation to the others. Clearly this situation could lead the group preferences to tend toward the preference of the major decision maker; however, the first place alternatives still remained within the expectation of the group, as if the weights were equal.
By performing ordinances from D1 to D4 it can also be seen that there was no variation in the Copeland ordination with equal weights when compared to the allocation of double-rated weights to each decision maker. Thus, assigning additional weight to a decision maker will certainly lead to results closer to that decision maker's choices; however, the result is not far from the result expected regarding the most preferred of the alternatives.
Developed software
In order to make the model more dynamic and practical an application was developed which enables the process of eliciting preferences, evaluating alternatives and even visualising the process of calculation, by presenting matrices of concordance and discordance of ELECTRE II and the Copeland matrix in order to aggregate the results.
Figure 2 shows the opening screen of the developed software, source and year of development. Sequentially and proportionally, Figs. 3, 4, 5 and 6 start the application to the ordinance of the alternatives presented in this paper, as well as allow some variation in the number of decision makers, the number of alternatives and also of the criteria, in addition to their weights and scales for each step of the process:
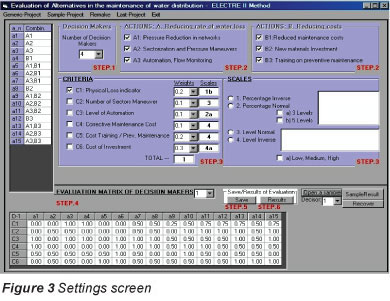
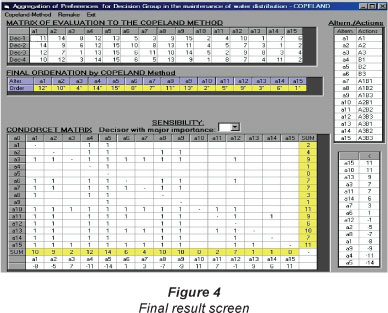
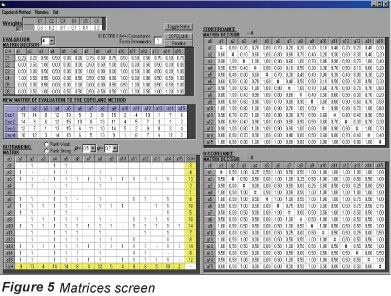
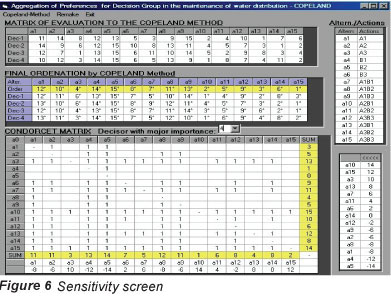
Figure 3 Settings screen: On this screen you can set the number of decision makers, planned alternatives, the criteria that will determine the evaluation process, the weights to these criteria and the scales which they are subject to.
Figure 4 Matrices screen: This presents the matrices of concordance and discordance used by the ELECTRE II method, and the results of the ordinations for each individual decision maker. This result is used to implement the subsequent Copeland method, which will use this ordinance as a matrix in which the results will be the new alternatives and the criteria from the decision makers.
Figure 5 Final results screen: On this screen you can visualise the result after applying the COPELAND method, as well as the Condorcet matrix used by the method to calculate the result. This final result represents the ordinance of the aggregate individual preferences of decision makers.
Figure 6 Sensitivity screen: On this screen some variations are allowed, for example, changing weightings. For each assignment of weight to a decision maker a new line is generated that represents the ordinance in which the decision maker will certainly have the value of his preferences increased in the evaluation.
Results and discussion
The results can be measured at two points:
- after the construction of the individual rankings by the ELECTRE II method, and
- after the analysis by the Copeland method.
These latter tests are related to building global preferences, which are the dominant alternatives in the view of the group.
When analysing the results of the individual ordinances promoted by the application of ELECTRE II it can be seen that the differences between the preferences of decision makers in the group have points of convergence for both the individual opinions and the group. This assessment was only possible after aggregating the results of the first method (ELECTRE II) and the adaptation and application of the Copeland method. The proposed model seeks to solve these types of conflicts and differences, and utilises a scale that represents the true preference for one alternative, with certain criteria taken into account, a scenario that involves multiple decision makers from different fields, however interconnected.
The result of these combinations, by the use of the ELECTRE II and the Copeland method concurrently, provides decision makers with a clearer picture of which alternative would help more consistently to achieve the goals that they face and promotes an agreement of opinions and preferences of the group. Moreover, variations can be provided and new analyses can be undertaken after a change of scenario or even goals.
The final ranking showed that the group presented some points of convergence related to some preferences, because the opinions were unanimous when the final result was presented. Certainly each decision maker had already thought individually of their preferences, while participating in the elicitation process to generate the evaluation matrix in ELECTRE II. For this reason, the opinions ended up converging in a natural manner, after analysis and application of the Copeland method, which provided the aggregation.
It is noteworthy that any changes in the characteristics of the criteria or alternatives, whether in a technical, political or administrative area, will produce different results, leading to re-evaluation of the scenario and repetition of the model application.
Concluding remarks
Applying the proposed model, based on ELECTRE II and Copeland methods, it is possible to get relevant results from different points of view to achieve water utility company goals within a complex scenario involving the maintenance of water distribution systems, and in which multiple objectives and targets and a selected group of decision makers are involved.
This model can certainly help managers to visualise a nucleus of viable alternatives to solve problems inherent to maintenance in water utilities, such as loss, implementation of alternative maintenance, implementation of automation, and monitoring, among others. With this visualisation, making decisions becomes more comfortable, as there is a tendency for the group to reach consensus, and goals are met, with the likelihood of better results. The multi-criteria approach might not present an ideal solution to the problems, but, among all possible alternatives for a decision, it points to the most consistently preferred ones.
In this particular case, the application provides an important context for decision support, to a group of decision-makers who were initially confronted with conflicting opinions and preferences regarding possible alternatives for the solution of the problems listed in the study. At some point it is necessary to resort to higher-ranking positions to solve the conflicts between the group when agreement was not reached. With the model, decision makers can individually analyse all alternatives and can reach consistent decisions while having their point of view preserved.
Acknowledgments
This work is part of a research programme funded by the Brazilian Research Council (CNPq). The authors gratefully acknowledge the valuable suggestions made by anonymous reviewers to a previous version of this paper.
References
ALENCAR LH, MORAIS DC and ALMEIDA AT (2010) A multi-criteria group decision model aggregating the preferences of decision-makers based on ELECTRE methods. Pesquisa Operacional. 30 (3) 687-702. [ Links ]
AL-KLOUB B, AL-SHERMMERI T and PEARMAN A (1997) The role of weights in multicriteria decision aid, and the ranking of water projects in Jordan. Eur. J. Oper. Res. 99 (2) 278-288. [ Links ]
AL-RASHDAN D, AL-KLOUB B, DEAN A and AL-SHERMMERI T (1999) Environmental impact assessment and ranking the environmental projects in Jordan. Eur. J. Oper. Res. 118 (1) 30-45. [ Links ]
ARROW KJ and RAYNAUD H (1986) Social Choice and Multi-criterion Decision-Making. The MIT Press, London. [ Links ]
DOTTO SE, SINGER EM and SANTOS RF (1996) The selection and the hierarchical classification of water quality parameters for irrigated crops through an ELECTRE I and II. Bragantia 55 (1) 185-192. [ Links ]
DUCKSTEIN L, GERSHON M and MCANIFF R (1982) Model selection in multiobjective decision making for river basin planning. Adv. Water Resour. 5 (3) 178-184. [ Links ]
GANOULIS J, SKOULIKARIS H and MONGET JM (2008) Involving stakeholders in transboundary water resource management: The Mesta/Nestos 'HELP' basin. Water SA 34 461-467. [ Links ]
KLADROBA A (2000) Das aggregations problem bei der erstellung von rankings: Einige anmerkungen am beispiel der formel 1 weltmeisterschaft 1998. Jahrbucher für Nationalokonomie und Statistik 220 (3) 302-314. [ Links ]
LAMY F, BOLTE J, SANTELMANN M and SMITH C (2002) Development and evaluation of multiple-objective decision-making methods for watershed management planning. J. Am. Water Resour. Assoc. 38 (2) 517. [ Links ]
MORAIS DC and ALMEIDA AT (2012) Group decision making on water resources based on analysis of individual rankings. Omega (Oxford) 40 42-52. [ Links ]
MORAIS DC and ALMEIDA AT (2010) Water network rehabilitation: a group decision-making approach. Water SA 36 (4) 487-493. [ Links ]
MORAIS DC and ALMEIDA AT (2007) Group decision-making for leakage management strategy of water network. Resour. Conserv. Recycl. 52 441-459. [ Links ]
MORAIS DC, CAVALCANTE CAV and ALMEIDA AT (2010) Priorização de Áreas de Controle de Perdas em Redes de Distribuição de Água. Pesquisa Operacional 30 15-32. [ Links ]
MOUSSEAU V, FIGUEIRA J and ROY B (2002) ELECTRE METHODS. Universit'e Paris-Dauphine, Paris. 1-35. [ Links ]
NURMI H. (1983). Voting Procedures: A summary analysis. Brit. J. Oper. Res. 82 522-539. [ Links ]
OLSON DL (1996) Decision Aids for Election Problems. Springer Verlag, New York. [ Links ]
PIETERSEN K (2006) Multiple criteria decision analysis (MCDA): A tool to support sustainable management of groundwater resources in South Africa. Water SA 32 (2) 119-128. [ Links ]
ROY B (1968) Classement et choix en présence de points de vue multiples (la méthode ELECTRE). RIRO 8 57-75. [ Links ]
ROY B (1978) ELECTRE III: Un alghoritme de methode de classements fonde sur une representatio floue des preferences em presence de criteres multiples. Cahieres de CERO 20 (1) 3-24. [ Links ]
ROY B and HUGONNARD JC (1981) Classement des prolongements de lignes de stations em banlieu parisienne. Lamsade (Université Dauphine) et RATP. [ Links ]
ROY B and SKALKA JM (1985) ELECTRE IS: Aspects methodologiques et guide d'utilization. Document du Lamsade. Paris-Dauphine: Universite Pauris-Dauphine 30 1-125. [ Links ]
ROY B and BERTIER PM (1971) La methode ELECTRE II: Une methode de classement en presence de criteres multiples. Paris: SEMA (Metra International) 142 1-25. [ Links ]
SILVA VBS, MORAIS DC and ALMEIDA AT (2010) A Multicriteria Group Decision Model to Support Watershed Committees in Brazil. Water Resour. Manage. 24 4075-4091. [ Links ]
VINCKE P (1992) Multicriteria Decision-Aid. Wiley, Bruxelles, Belgium. [ Links ]
YILMAZ B and HARMANCIOGLU NB (2010) Multi-criteria decision making for water resource management: a case study of the Gediz River Basin, Turkey. Water SA 36 (5) 563-576. [ Links ]
YU W (1992) ELECTRE TRI - Aspects Methodologiques et Guide d'Utilisation. Document du LAMSADE. Université de Paris-Dauphine, Paris. [ Links ]
Received 26 Julyy 2011; accepted in revised form 26 June 2012.
* To whom all correspondence should be addressed. ffi +55 81 2126-8728 ext 205; fax: +55 81 2126-8728 ext 4; e-mail: daniellemorais@yahoo.com.br

