


Services on Demand
Article
 English (pdf)
 Article in xml format
 Article references
Indicators

Related links
-
 Cited by Google
 -
 Similars in Google
Share

 Permalink
Water SA
On-line version ISSN 1816-7950
Print version ISSN 0378-4738
Water SA vol.38 n.4 Pretoria Jan. 2012
Spectrophotometric determination of fluoride in drinking water using aluminium complexes of triphenylmethane dyes
Zaher BarghouthiI, *; Sameer AmereihII
IIinstitute of Chemistry, Karl-Franzens University, Universitaetsplatz 1, A8010 Graz, Austria
IIPalestine Technical University-Kadoori, Tullkarm, Palestine
ABSTRACT
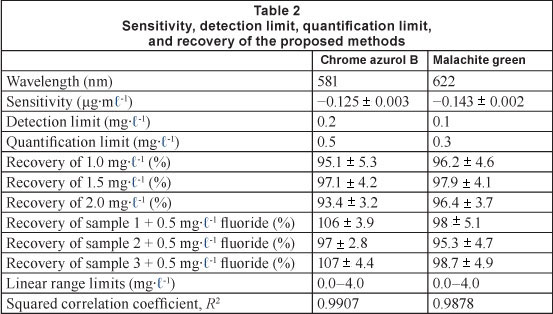
A sensitive spectrophotometric determination of fluoride in drinking water has been developed using aluminium complexes of triphenylmethane dyes (chrome azurol B and malachite green) as spectrophotometric reagents. The method allowed a reliable determination of fluoride in the range of 0.5-4.0 mg-l-1 for chrome azurol B and 0.0-2.0 mg-l-1 for malachite green. The molar absorptivity for the complexes of chrome azurol B at 582 nm and malachite green at 622 nm is 1.44 x 10⁴ and 2.56 x 10⁴ l-mol-1cm-1, respectively. The sensitivity, detection limit, quantitation limit, and percentage recovery for 1.5 mg-l-1 fluoride for the method using chrome azurol B were found to be 0.125 ± 0.003 ug-ml-1, 0.2 mg-l-1, 0.5 mg-l-1, and 97.1 ± 4.2, respectively, and for malachite green were 0.143 ± 0.002 ug-l-1, 0.1 mg-l-1, 0.3 mg-l-1, and 97.9 ± 4.1, respectively.
Keywords: Fluoride analysis, spectrophotometric method, drinking water, aluminium triphenylmethane dye complexes, chrome azurol B, malachite green
Introduction
Fluoride (F") occurs in almost all waters from trace to high con" centration (Dar et al., 2011). It has been shown to cause significant effects in humans through drinking water (WHO, 2006). Low concentrations of fluoride in drinking water have been considered beneficial to prevent dental carries (Maliyekkal et al., 2008; Quin et al., 2009), but excessive exposure to fluoride in drinking water can give rise to a number of adverse effects (WHO, 2006; Armienta and Segovia, 2008; Aldrees and Al-Manea, 2010; Arveti et al., 2011; Dunne and Verrel, 2011). WHO has set a limit value of 1.5 mg-l-1 for fluoride in drinking water (WHO, 2004; Rafique et al., 2008). There is a narrow margin between the desired and harmful doses of fluoride in drinking water (Czarnowski et al., 1996; Jha et al., 2011). Therefore, an accurate, simple, rapid and cost"effective analyti" cal method is of high importance.
Spectrophotometric methods are widely used in the determination of fluoride because of advantages such as simplicity, convenience, accuracy and reproducibility (Zolgharnein et al., 2009). They are based on the reaction of fluoride with coloured metal chelate complexes, producing either a mixed"ligand ternary complex or replacement of the ligand by fluoride to give a colourless metal-fluoride complex and the free ligand with a colour different to the metal-ligand complex (Einaga and Iwasaki, 1981).
Triphenylmethane (TPM) dyes of most value today are those with auxochromic and bathochromic groups like amino and hydroxyl in para position to the methane carbon (Witterholt, 1969). TPM dyes with groups capable of holding metals in stable combination, such as eriochrome cyanine R and azurol S, have been used successfully as spectrophotometric reagents for fluoride determination (Thrun, 1950; Macnulty et al., 1956; Sarma, 1964; Dixon, 1970; Einaga and Iwasaki, 1981; Kiernan, 1984). TPM dyes absorb strongly in the visible region to produce intense, brilliant shades of red, violet, blue, and green (Witterholt, 1969). They are characterised by high molecular extinction coefficients and by 2 bands in the visible absorption spectra. The longer wavelength (X band), which corresponds to an oscillation of the charge in the X direction, is of greater intensity than the shorter-wavelength (Y band), which corresponds to an oscillation of the charge in the Y direction (Witterholt, 1969; Zollinger, 2003).
The present study aimed to develop spectrophotometric methods for determination of fluoride in the range of 0.0-2.0 mg-l-1, compatible with the WHO limit value of 1.5 mg-l-1 using aluminium complexes of TMP dyes such as chrome azurol B and malachite green as fluoride spectrophotometric reagents, due to their spectrophotometric properties described above.
Experimental
Instrumentation
Beckman DU-7500 single beam spectrophotometer with 1.0 cm quartz cells was used for wavelength scanning and for spectral studies. Hitachi U-1500 UV/Vis single beam spectrophotometer with 1.0 cm quartz cells was used for the absorbance measurements at fixed wavelength.
Reagents
Chrome azurol B provided by Fluka, malachite green carbinol base provided by Aldrich, and aluminium chloride hexahydrate provided by Fluka were used without any further purification. All the chemicals were of analytical reagent grade except where stated otherwise. Solutions were prepared using double-distilled water. Chrome azurol B and malachite green ligand solutions and their aluminium complex solutions were prepared using ethanol from Merck (96%). Standard fluoride stock solution was prepared by dissolving 0.1382 g of sodium fluoride provided by Merck in 250 ml water. The stock solution was further diluted as needed.
Preparation of the metal complexes solutions
Job's method of continuous variation was adopted for the determination of the composition of the coloured complex (Werner and Boltz, 1971a; Werner and Boltz, 1971b). Aluminium to ligand (chrome azurol B or malachite green) ratio was also studied by preparing complexes with the most common molar ratios (1:1, 1:2, 1:3, 2:1, 3:1, 2:3, and 3:2) to enable comparison between the spectra of these different complexes. The blank was prepared by the same procedure using the solvent instead of the aluminium ionic solution.
Aluminium to ligand ratio was found to be 1:2 for both chrome azurol B and malachite green. Thus, the complex solutions for the spectrophotometric measurements were prepared as 1:2 ratios from aluminium and ligand of 1 x 10⁻⁴ M in ethanol solutions, and the solutions were then diluted to the concentration (=5 x 10⁻⁵ M) suitable for the spectrophotometric measurements.
Reaction of fluoride with the prepared complex solutions
Various amounts of fluoride were added in the range 0-2 mg-l-1 to a 25 ml volumetric flask containing aluminium complex solution of chrome azurol B or malachite green in ethanol (5x10⁻⁵ M, 24.5 ml). The solution was made up to volume with water. The absorbance was measured at the wavelengths of maximum difference (425, 581 nm for chrome azurol B; 428, 622 nm for malachite green) in the electronic spectra between the ligand and the complex. The spectra for the reaction of different amounts of fluoride with the complex were compared.
Determination of fluoride in real drinking water samples
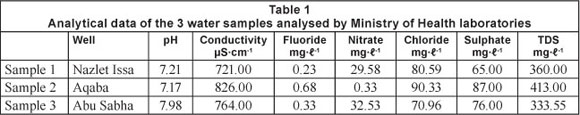
The method under investigation was tested using 3 real drinking water samples which had been collected and analysed by the Central Public Health Laboratory of the Ministry of Health, Palestine, which is responsible for managing water quality. Samples were collected in June 2011 from 2 groundwater wells in Tulkarm District (Nazlet Issa well and Abu Sabha well in the village of Atteel) and 1 groundwater well in Tubas District (Aqaba well). Fluoride was analysed colourimetrically using SPADNS as fluoride reagent and a Hack - DR/2010 spectrophotometer. Nitrate, sulphate, chloride and other characteristic data of the 3 samples are given in Table 1. According to the Ministry of Health, fluoride ranged between 0.2 and 0.8 mg-l-1 in the West Bank groundwater resources (Salem, 2011). Therefore, fluoride was measured after spiking the water samples with 0.5 mg-l-1 fluoride. The results obtained were then compared with those reported by the Central Public Health Laboratory using the SPADNS method (Table 1 and Table 2).
Results and discussion
Selection of dye
In this work, 24 TPM dyes were examined as new TPM ligand reagents for fluoride determination, including methyl green, brilliant green, methyl blue, m-gresol red, crystal violet, light green SF yellowish, leucomalachite green, bromocresol purple, fast green FCF, brilliant blue R, Patent blue VF sodium salt, acid violet, alphazurine A, parafuchsin, Victoria blue R, ethyl violet, light green, bromocresol green, malachite green oxalate, lissamine green B, pyroatechol violet, aluminon, chrome azurol B, and malachite green carbinol base. The maximum difference between the absorption spectra of each examined TPM dye and its aluminium complex was obtained with chrome azurol B, and malachite green.
Chrome azurol B and its aluminium complexes
Chrome azurol B is commonly known as 2//, 6//-dichloro-4/ -hydroxy-3-3/ -dimethyl fuchsone-5, 5/-dicarboxylic acid; solo-chrome azurine B; and omega chrome azurine B (Gurr, 1971). It is used in the spectrophotometric determination of uranium, palladium, copper, etc. (Gregorowicz et al., 1983; Jancar et al., 1989; Guo, 1992), and makes stable complexes with different elements (Uesugi and Shigematsu, 1977; Boodts et al., 1982).
Chrome azurol B is dark orange in ethanol. Figure 1 shows its electronic absorption spectra; it displays 1 band with 2 heads at 280 and 296 nm in the UV region, and a main broad band of greater intensity with heads at 444 and 580 nm in the visible region. The molar absorptivity at 444 and 580 nm is 13 830 ± 64 and 12 520 ± 68 ℓ mol-1xm-1, respectively. The main absorption band is due to a II>II* transition, while the electron donors generally cause strong bathocromic shift (Zollinger, 2003). In general, TPM dyes exhibit 2 bands in the visible absorption spectra (Witterholt, 1969). In the ligand under investigation, the 2 band transitions overlap to produce a single band with only a shoulder on the shorter wavelength side. The greater the fraction of the positive charge on the auxochromes is the longer the wavelength of the absorption. However, there is hypsochromic shift (decrease in the wavelength) in the Y band of chrome azurol B due to the ability of the auxochromes (carboxylic and hydroxyl group) to eliminate the charge by resonance.
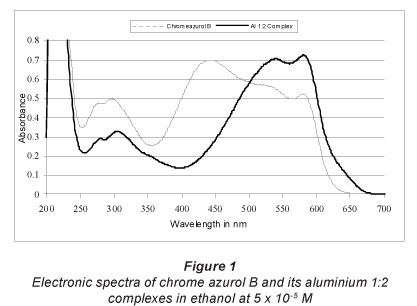
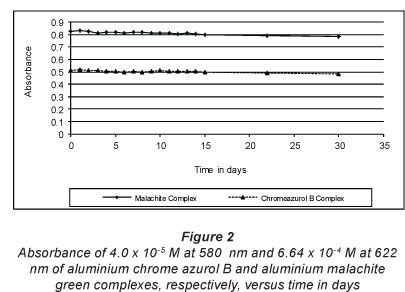
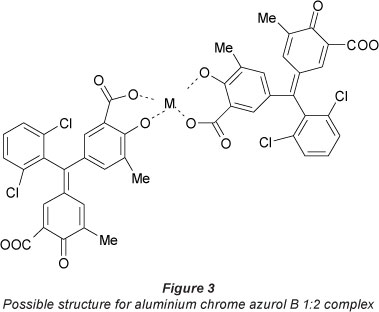
Aluminium chrome azurol B ratio was determined as 1:2. The complex exhibits a dark pink colour in ethanol and displays 1 band in the visible region with 2 heads at 538 and 582 nm (Fig. 1). The molar absorptivity at these 2 heads is (1.40 ± 0.023) x 104 and (1.44 ± 0.026) x104 «-mol-1-cm-1 respectively. There is a bathochromic shift of about 94 nm after complexation with aluminium. The stability of the complex in ethanol solution was examined for 1 month, as shown in Fig. 2, and the complex is stable. A possible chemical structure of aluminium chrome azurol B 1:2 complex is given in Fig. 3. The sensitivity of the colour reaction between metals and chrome azurol B is enhanced by the presence of surfactants (Uesugi and Shigematsu, 1977). N-cetyl-N,N,N-trimethylammonium romide was examined as a surfactant to enhance the colour of the investigated complex. However, the results showed that it has no significant effect at the spectrum of the complex.
Malachite green and it aluminium complex
Malachite green is a cationic basic dye which has found a widespread use as colorant in industry and as microbial agent (Green, 1990; Eldem and Ozer, 2004; Rajgopal et al., 2006). It is also used as a spectrophotometric reagent for determination of dissolved phosphate in both water and soil extracts (Motomizu et al., 1983; Linge and Oldham, 2001). Malachite green reaches equilibrium between its cationic and the colourless carbinol forms at pH 10.1, whereas the complete ionisation to the salt occurs at pH 4.0 or lower (Goldacre and Phillips, 1949; Golding et al., 1998).
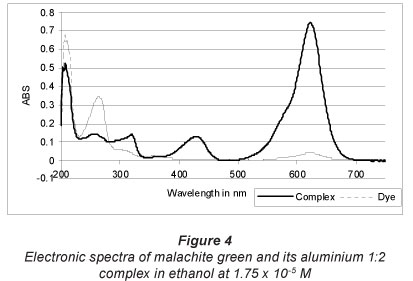
Malachite green displays 2 bands in the visible region in ethanol, at 428 and 622 nm (Fig. 4). The long wavelength band provides a blue component to the colour, while the short band provides a yellow component to the colour. The combination of these two components of the colour is the colour of the dye, which appears green to human eyes. The long wavelength band is characterised by an oscillation of an electron cloud across the molecule between the two auxochromes, while the shorter band corresponds to an oscillation through the phenyl group (Mason and Nord, 1951; Green, 1990; Zollinger, 2003).
The results obtained from applying Job's method of continuous variation indicated the 1:2 aluminium complex. The complex is possible because the lone electron pair of the nitrogen atom in the malachite green is delocalised into the outer orbitals of the Al3+ ion, and a compound which is analogous to a donor-acceptor complex is formed (Minczewski et al., 1975). The proposed complex has a n-bond, between the donor (nitrogen atom) and the acceptor (Al3+ ion), which increased the binding energy of the central Al atom. In general, the electron transition between the donor and the acceptor was not complete (Minczewski et al., 1975).
Aluminium malachite green 1:2 complex is very dark green in ethanol. It displays 2 bands in the visible region at the same wavelength as the ligand, at 428 and 622 nm (Fig. 4), with a hyperchromic effect, which leads to an increase in the absorption after complexation with aluminium. The molar absorptivity at 622 nm is (2.56 ± 0.045) x 104 l-mol-1 -cm-1.
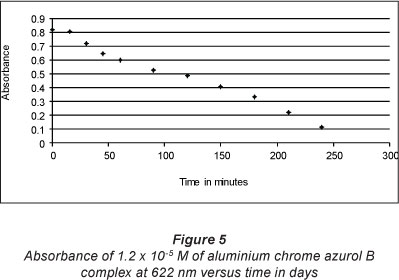
The stability of aluminium malachite green 1:2 complex was examined over 1 month. Figure 2 shows that the complex is stable at 622 nm at high concentrations such as 6.64 x 10⁻⁴ M. On the other hand, the complex is only stable for a few hours at a concentration below 1.2 * 10-5 M (Fig. 5) due to the hydrolysis of the complex and release of the free ligand. This results in a change in the colour of the ligand to light green.
Reaction of fluoride with aluminium chrome azurol B complex
Fluoride reacts with the dark pink aluminium chrome azurol B complex to produce a colourless aluminium fluoride complex by replacement of the chrome azurol B by fluoride and liberation of the free ligand. This leads to a change in colour from that of the complex, dark pink, to that of the free ligand, dark orange (Fig. 6), according to the equation below. Aluminium reacts with fluoride to give compounds of the nature of (AlF6-3) or (AlFy(OH)6-y)-3 (Macnulty et al., 1956).
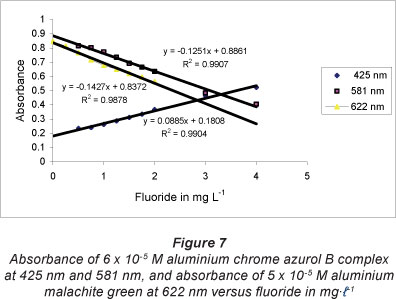
The absorption spectra of the reaction of fluoride with the Al chrome azurol B complex showed that fluoride interacts to cause an increase in absorbance of the aluminium complex at 425 nm and a decrease in absorbance at 581 nm, due to the formation of the aluminium fluoride complex and release of the free ligand. Figure 7 shows that the absorbance of the aluminium complex is related linearly at 425 and 581 nm to the concentration of fluoride in the range 0.0 to 4.0 mg-l-1; the squared correlation coefficient, R2, is 0.9904 and 0.9907, respectively. The equation of the linear calibration curve at 425 and 581 nm is y = 0.0885* + 0.1808 and y = -0.1251* + 0.8861, respectively.
The sensitivity, detection limit, limit of quantification, and recovery, of 1.0, 1.5, and 2.0 mg-l-1 F of the Al chrome azurol B complex for the spectrophotometric determination of fluoride at 581 nm, are given in Table 2. The sensitivity was taken as the average of the slope of the calibration curve for 5 replicates. The detection limit and the limit of quantification were calculated as 3.3a/S and 10a/S, respectively, where a is the standard deviation of response and S is the slope of the calibration curve. The recovery was measured as the average of 10 replicates.
Fluoride was measured using the proposed field method in 3 real water samples, and, because of the low fluoride content in the West Bank's groundwater, the samples were spiked by 0.5 mg-l-1 fluoride. The recovery of fluoride by the proposed field method is given in Table 2, and is in agreement with that reported by the Central Public Health Laboratory using SPADNS as fluoride colorimetric reagent.
The interference studies were done by measuring the influence of anions such as chloride, nitrate, and sulphate on the determination of 1.0 and 1.5 mg-l-1 fluoride. Therefore, the expected interfering anions were added in such concentrations commonly found in the natural water (Table 3). Nitrate and chloride were added in the range of 0-100 and 0-500 mg l-1, respectively. The data on interference in Table 3 show that nitrate concentrations up to 20 mg-l-1 do not interfere with the determination of fluoride. However, higher results for fluoride are obtained when the amount of nitrate is 20 mg-l-1 or more. Chloride at concentrations up to 100 mg-l-1 does not interfere (Table 3). Large amount of chloride (>100 mg-l-1) may be overcome by adding an excess of silver perchlorate to the solution (Hensley and Barney, 1960).
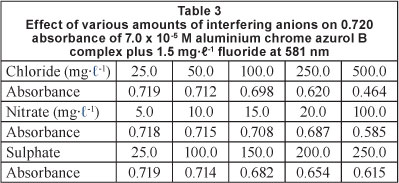
Sulphates interfere with most visual and photometric methods for determination of fluoride. Sulphate interferes through competition with fluoride to form a complex with the metal, thereby resulting in higher concentrations (Price and Walker, 1952; Ruzicka et al., 1966). In the present work, when the amount of sulphate is higher than 100 mg-l-1 sulphate interferes with the determination of fluoride by increasing the absorption at 425 nm and decreasing the absorption at 581 nm. This can be overcome by precipitating sulphate in cold solutions by the addition of aqueous barium chloride solution and aqueous agar-agar solution, and then separating the precipitate by filtration (Dixon, 1970).
Interference may also be due to the presence of metal ions that give a colour with the dye or to the presence of cations, e.g., iron, zirconium, magnesium, which form complexes with fluoride in competition with aluminium (Nishimoto et al., 2001; Dixon, 1970). However, metal ions from scarce sources are not expected in drinking water. The stability constants of the metal fluoride complexes increase in the following order: [CuFn]2-n < [MgFn]2-n [FeFn]3-n < [AlFn]3-n < [ZrFn]3-n (Aikens and Reflly, 1963). When the sample solution is expected to contain a large amount of these cations, and because of the high tendency of quinalizarin to form colour chelates with various metal ions (Snell, 1978; Srivastava and Banerji, 1967), it is recommended that the metal interferences are masked by adding complexing agents such as DCTA (trans-1,2-aminocyclohexane-N,N,N',N'-tetraacetic acid) (Nishimoto et al., 2001) or EDTA (ethylenedi-aminetetraacetic acid (Snell, 1978).
Reaction of fluoride with aluminium malachite green complex
Fluoride interacts with aluminium malachite green 1:2 complex to cause a decrease in the absorbance of the aluminium complex at 622 nm. The absorbance of the aluminium complex is related linearly at 622 nm to the concentration of fluoride in the range of 0.0-2.0 mg-l-1 (Fig. 7); the squared correlation coefficient, R2, is 0.9878 and the equation of the linear calibration curve is: y = -0.1427x + 0.8372. The sensitivity, detection limit, limit of quantification, and recovery of 1.0, 1.5, and 2.0 mg-l-1 F of the Al malachite green complex for the spectrophotometric determination of fluoride at 622 nm, are given in Table 2. The only interference comes from sulphate at a concentration of more than 250 mg-l-1, resulting in a positive error of about 20%. This error can be overcome by precipitation of sulphate using barium chloride (Dixon, 1970).
Conclusions
Two members of the triphenylmethane dye group were examined as spectrophotometric reagents for fluoride determination. Promising results were obtained with aluminium 1:2 complexes of chrome azurol B and malachite green. These two complexes can be used as spectrophotometric reagents for fluoride in the ranges 0.5-4.0 and 0.3-2.0 mg-l-1, respectively. Aluminium chrome azurol B complex can be recommended as a sensitive reagent but with low selectivity, while aluminium malachite green complex can be recommended as a fluoride reagent at concentrations higher than 1.5 x 10⁻⁵ M.
Acknowledgments
The author (ZB) thanks Professor Walter Kosmus from the Analytical Chemistry Institute in Karl-Franzens University of Graz, Austria, for his advice, suggestions, ideas, comments, helpful discussions, generous help with instruments and references, and for his supervision of the Ph.D. research. The authors thank the director (Mr Ibrahim Salem) and the staff of the Central Public Health Laboratory, Ramallah, for their cooperation and for sharing their data. The Austrian Exchange Service (CAD) is gratefully acknowledged for the scholarship (ZB).
References
ALDREES AM and AL-MANEA SM (2010) Fluoride content of bottled drinking waters available in Riyadh, Saudi Arabia. Saudi Dent. J. 22 189-193. [ Links ]
AIKENS DA and REILLY CN (1963) Formation constants of metal complexes. In: Meites L (ed.) Handbook of Analytical Chemistry. McGraw-Hill Book Company, New York. 1-40. [ Links ]
ARMIENTA MA and SEGOVIA N (2008) Arsenic and fluoride in the groundwater of Mexico. Environ. Geochem. Health 30 345-353. [ Links ]
ARVETI N, SARMA MRS, ATIKENHEAD-PETERSON JA and SUNIL K (2011) Fluoride incidence in groundwater: A case study from Talupula, Andhra Pradesh, India. Environ. Monit. Assess. 172 427-443. [ Links ]
BOOT JFC, CUSTODIO R and ROMERO JR (1982) The reduction mechanism at the mercury electrode in neutral and alkaline aqueous media of an hydroxytriphenylmethane dye: Eriochrome Azurol B. J. Electroanal. Chem. 139 (1) 143-156. [ Links ]
CZARNOWSKI W, WRZESNIOWSKA K and KRECHNIAK J (1996) Fluoride in drinking water and human urine in Northern and Central Poland. Sci. Total Environ. 191 177-184. [ Links ]
DIXON EJ (1970) Determination of micro amounts of fluoride with zirconium and solochrome cyanine R. Analyst 95 272-277. [ Links ]
DAR MA, SANKAR K and DAR IA (2011) Fluorine contamination in groundwater: a major challenge. Environ. Monit. Assess. 173 955-968. [ Links ]
DUNNE K and VERRELL P (2011) Acute effect of exposure to sodium fluoride on the red compost earthworm Eisenia fetida: Lethality and avoidance behavior. Fluoride 44 210-214. [ Links ]
EINAGA H and IWASAKI I (1981) Spectrophotometric study of the reaction of zirconium with chrome azurol S and fluoride. Talanta 28 889-900. [ Links ]
ELDEM Y and OZER I (2004) Electrophilic reactivity of cationic triarylmethane dyes towards proteins and protein-related nucleophiles. Dyes Pigments 60 49-54. [ Links ]
GOLDACRE RJ and PHILLIPS JN (1949) The ionization of basic triphenylmethane dyes. J. Am. Chem. Soc. 3 1724-1732. [ Links ]
GOLDING PS, KING TA, MADDOCKS L, DRUCKER DB and BLINKHORN AS (1998) Photosensitization of Staphylococcus aureus with malachite green isothiocyanate: inactivation efficiency and spectroscopic analysis. J. Photochem. Photobiol. B: Biol. 47 202-210. [ Links ]
GREEN FJ (1990) The Sigma-Aldrich Handbook of Stains, Dyes and Indicators. Aldrich Chemical Company, Milwaukee. 436-439. [ Links ]
GREGOROWICZ Z, GORKA P, KOWALSKI S and CEBULA J (1983) Spektralphotometrische methode zur bestimmung von palladium (II) mit hilfe von erichromazurol B und cetyltrimethylam-moniumbromide. Mikrochim. Acta. 80 (3-4) 181-185. [ Links ]
GUO X (1992) Colour reaction of copper with chromeazurol B-quinoline and cetyltrimethylammonium bromide. Yankuang Ceshi 11 (4) 359-360. [ Links ]
GURR E (1971) Synthetic Dyes in Biology, Medicine and Chemistry. Academic Press INC, New York. [ Links ]
HENSLEY AL and BARNEY JE (1960) Spectrophotometric determination of fluoride with thorium chloranilate. Anal. Chem. 32 (7) 828-831. [ Links ]
JHA SK, NAYAK AK and SHARMA YK (2011) Site specific toxicological risk from fluoride exposure through ingestion of vegetables and cereal crops in Unnao district, Uttar Pradesh, India. Ecotoxicol. Environ. Saf. 74 940-946. [ Links ]
JANCAR L, SLEZACKVA B and SOMMER L (1989) Spectrophotometric determination of trace uranium with eriochrome azurol B and chrome azurol S in the presence of the cationic surfactant septonex. Talanta 36 (5) 549-555. [ Links ]
KIERNAN JA (1984) Chromoxane cyanine R. 1. Physical and chemical properties of the dye and some of its iron complexes. J. Microsc. 134 13-23. [ Links ]
LINGE KL and OLDHAM CE (2001) Interference from arsenate when determining phosphate by malachite green spectrophotometric method. Anal. Chim. Acta. 450 247-252. [ Links ]
MACNULTYA BJ, HUNTER GJ and BARRETT DG (1956) The determination of microgram quantities of fluoride: The use of aluminium-eriochromecyanin complex. Anal. Chim. Acta. 14 368-380. [ Links ]
MALIYEKKAL SM, SHUKLA S, PHILIP L and NAMBI IM (2008) Enhanced fluoride removal from drinking water by magnesia-amended activated alumina granules. Chem. Eng. J. 140 183-192. [ Links ]
MASON CD and NORD FF (1951) Studies on the chemistry of heterocyclics. XIII. Triarylmethane dyes containing a thiophene ring. J. Org. Chem. 16 722-727. [ Links ]
MINCZEWSKI J, CHWASTOWAKA J and PTH MAI (1975) Spectrophotometric determination of trace amounts of vanadium by formation of the vanadium-4-(2-pyridylazo) resorcinol (PAR) -crystal violet complex: Application to the analysis of plant materials. Analyst 100 708-715. [ Links ]
MOTOMIZU S, WAKIMOTO T and TOEI K (1983) Spectrophotometric determination of phosphate in river waters with molybdate and malachite green. Analyst 108 361-367. [ Links ]
NISHIMOTO J, YAMADA T and TABATA M (2001) Solvent extraction and fluorometric determination of fluoride ion at ppb level in the presence of large excess of aluminum(III) and iron(III) by using an expanded porphyrin, sapphyrin. Anal. Chim. Acta. 428 201-208. [ Links ]
PRICE MJ and WALKER OJ (1952) Determination of fluoride in water. Anal. Chem. 24 (10) 1593-1595. [ Links ]
QIN X, WANG S, YU M, Zhang L, LI X, ZUO Z, Zhang X and WANG L (2009) Child skeletal fluorosis from indoor burning of coal in Southwestern China. J. Environ. Public Health 2009 1-7. DOI: 10.1155l2009l969764. [ Links ]
RAFIQUE T, NASEEM S, BHANGER MI and USMANI TH (2008) Fluoride ion contamination in ground water of Mithi Sub-district, the Thar Desert, Pakistan. Environ. Geol. 56 317-326. [ Links ]
RAJGOPAL S, KARTHIKEYAN T, KUMAR BGP and MIRANDA LR (2006) Utilization of fluidized bed reactor for the production of adsorbents in removal of malachite green. Chem. Eng. J. 116 211-217. [ Links ]
RUZICKA JA, JAKSCHOVA H and MARKLAS L (1966) Determination of fluoride in bones and teeth with xylenol orange. Talanta 13 1341-1344. [ Links ]
SALEM (2011) Personal communication, 30 May 2011. Mr Ibrahim Salem, Director, Central Public Health Laboratory, Ministry of Health, Ramallah, Palestine. [ Links ]
SARMA PL (1964) Spectrophotometric determination of fluoride by zirconium-eriochrome cyanine R. Anal. Chem. 36 (8) 1684-1685. [ Links ]
SNELL FD (1978) Photometric and fluorometric methods of analysis metals, John Wiley & Sons, New York. [ Links ]
THRUN WE (1950) Rapid method for determination of fluoride in water. Anal. Chem. 22 (7) 918-920. [ Links ]
UESUGI K and SHIGEMATSU (1977) A highly sensitive spectrophotometric determination of gallium with Pontachrome Azure Blue B and cetyltrimethylammonium chloride. Talanta 24 (6) 391-393. [ Links ]
WERNER L and BOLTZ DF (1971a) Theory of continuous variations plots and a new method for spectrophotometric determination of extraction and formation constant. Anal. Chem. 43 (10) 1265-1272. [ Links ]
WERNER L and BOLTZ DF (1971b) Spectrophotometric determination of extraction constants of certain metal 1-pyrrolidinecarbod-ithioates. Anal. Chem. 43 (10) 1273-1277. [ Links ]
WHO (2004) Guidelines for Drinking-Water Quality (2nd edn.) Vol. 1. World Health Organization, Geneva. 375-377. [ Links ]
WHO (2006) Fluoride in Drinking-Water. IWA Publishing, London. [ Links ]
WITTERHOLT VG (1969) Triphenylmethane and related Dyes In: Kirk-Othmer Encyclopedia of Chemical Technology. (2nd edn.) Vol. 20. John Wiley & Sons, Wilmington. 672-737. [ Links ]
ZOLGHARNEIN J, SHAHRJERDI A, AZMI G and GHASEMI J (2009) Spectrophotometric determination of trace amounts of fluoride using an Al-xylenol orange complex as a colored reagent. Anal. Sci. 25 1249-1253. [ Links ]
ZOLLINGER H (2003) Colour Chemistry: Syntheses, Properties, and Applications of Organic Dyes and Pigments. Verlag Helvetica Chimica Acta, Zuerich. [ Links ]
Received 14March 2011; accepted in revised form 4 July 2012.
* To whom all correspondence should be addressed. ffi +97 042511119; fax: +97 022403312; e-mail: zaher_bar@hotmail.com
Present address: Department of Natural Resources Research, National Agricultural Research Center (NARC), PO Box 197, Ramallah, Palestine

