


Serviços Personalizados
Artigo
 Inglês (pdf)
 Artigo em XML
 Referências do artigo
Indicadores

Links relacionados
-
 Citado por Google
 -
 Similares em Google
Compartilhar

 Permalink
Water SA
versão On-line ISSN 1816-7950
versão impressa ISSN 0378-4738
Water SA vol.38 no.3 Pretoria Jan. 2012
A groundwater-planning toolkit for the main Karoo basin: Identifying and quantifying groundwater-development options incorporating the concept of wellfield yields and aquifer firm yields
R MurrayI, *; K BakerI; P RavenscroftII; C MusekiwaIII; R DennisIV
IGroundwater Africa, 54 Irene Avenue, Somerset West, 7130, South Africa
IIMaluti GSM, PO Box 6336, Uniedal, 7612, South Africa
IIICouncil for Geoscience, Western Cape Unit, POBox 572, Bellville, 7535, Cape Town, South Africa
IVNorth-West University, Potchefstroom Campus, PO Box 19140, Noordbrug, 2522, South Africa
ABSTRACT
This paper provides an overview of groundwater-planning tools that were developed during a Water Research Commission project that was initiated due to the need to place the significant knowledge on groundwater of the Karoo Basin within the realms of water resource planning. In essence, the project aimed to identify favourable areas of groundwater potential for bulk municipal water supplies, to provide a method to quantify them, and to package the information so that it is assessable for planning purposes. In identifying favourable groundwater areas, the focus turned to developing a detailed transmissivity map of the Main Karoo Basin. In order to present yields in an accessible manner to water-supply planners, the same concept used in surface-water resource assessments and dam or reservoir design were adapted and applied to groundwater. Two methods were developed, namely the Aquifer Assured Yield Model and the Aquifer Firm Yield Model (the latter of which was developed into a software package together with the other products). The Aquifer Firm Yield Model provides the historical firm yield and uses historical monthly rainfall data together with recharge, evapotranspiration and baseflow to determine aquifer storage in any given month. The firm yield can be considered to define the upper limit of the groundwater resource. In order to establish possible wellfield yields, the C-J Wellfield Model (based on the Cooper-Jacob approximation of the Theis groundwater-flow equation) was developed whereby borehole spacing can be optimised after inputting estimated transmissivity values from the transmissivity map. To aid the planning process, groundwater-quality maps were produced together with the Wellfield Cost Model which provides an easy way to obtain first-order cost estimates of the wellfield options. This paper briefly describes these 'tools' that were produced and provides slightly more detail on how the transmissivity maps were developed
Keywords: aquifer yield, wellfield yield, transmissivity, water-balance models, groundwater quality, well-field costs
Introduction
This paper describes the resources that were developed during the Water Research Commission (WRC) project entitled 'The delineation of high-yielding wellfield areas in Karoo Aquifers as future water supply options to local authorities' (Murray et al., 2012). This project aimed to identify favourable areas of groundwater potential for bulk municipal water supplies, to provide a method to quantify them, and to package the information so that it is assessable for planning purposes. A software package containing these 'tools' was developed which is available from the WRC in a model suite (with the same title as this paper). The package is aimed primarily at hydrogeologists, but components of the suite such as the water-quality maps and the Wellfield Cost Model would also be useful to others in the water resource planning sector. This paper summarises these 'tools'.
Study area
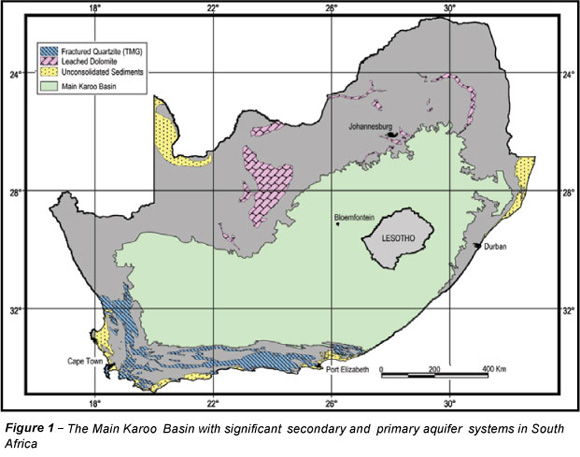
The study area extends over 560 000 km2, and is defined by the outcrop of the Main Karoo Basin (Fig. 1), but excludes the folded strata along the southern margin and areas in the north and north-eastern margin that are partly covered by Kalahari sediments.
Resources or 'tools' for identifying and quantifying suitable groundwater areas
A process for identifying and quantifying suitable groundwater targets is outlined in Fig. 2. The items in italics on the right-hand side of the diagram are the resources or tools that were developed during this project. Each step in the process makes use of a number of resources, both existing and new. For example, the first step in identifying areas of high groundwater potential usually involves identifying existing high-yielding boreholes and aquifers, and identifying drilling targets using geological maps and airborne or satellite imagery. The transmissivity maps are based on the geological maps and can therefore be used in the early stages of identifying drilling target areas.

Groundwater quality maps
In order to provide guidance on expected groundwater quality and treatment requirements, data from the National Groundwater Archive (NGA) and the Water Management System (WMS) were assessed, merged and mapped; and based on this information, treatment requirements and associated costs were also mapped. Sufficient data were available for the mapping of salinity (electrical conductivity), sodium, calcium, magnesium, sulphate, fluoride, iron, nitrate and arsenic. Chloride was previously mapped as part of DWA's GRAII dataset (DWAF, 2005) and was not repeated. Where sites had multiple readings the harmonic mean was used. An example of the electrical-conductivity map that was produced is shown in Fig. 3.

Groundwater targets
Areas of relatively high permeability in the Main Karoo Basin, and thus favourable drilling targets, are predominantly associated with:
- Dolerite dykes
- Dolerite ring structures
- Dolerite sill margins (especially inclined sheets)
- Thick alluvial deposits
- Folded and faulted formations
Dolerite intrusions can have the effect of baking, deforming and fracturing the sedimentary rocks thereby allowing transmissive zones to develop along these geological contacts. Alluvial deposits, if sufficiently coarse-grained, allow for easy flow through the aquifer. If these deposits are expansive, thick and permeable they form highly productive aquifers (for example the Cedarville Flats). Where these deposits overlie fractured hard-rock aquifers, the groundwater potential is likewise substantial. Folded and faulted formations owe their permeability to deformation and fracturing. While faulting in the Karoo Basin is rather limited, the southern margin of the Basin is highly folded where it meets the excessively deformed Cape Fold Belt.
The other factor that dictates the exploitation potential of hard-rock Karoo aquifers is the type of host rock that has undergone deformation. From the borehole-yield data it is evident that the groundwater potential is higher where the host rocks are predominantly sandstones rather than mudstones. This is because fractured sandstones are more permeable than fractured mudstones, and because fractures within sandstones are more extensive than in the more ductile mudstones.
The 1:250 000 published geological maps were used to develop seamless maps (GIS datasets) of the Main Karoo Basin for dolerite dykes, dolerite sills, faults and alluvial deposits. Folded areas were not done due to the complexity of this task, and this remains a task that should be done in future. These maps/datasets show the areas of high groundwater potential. They are effectively maps of geological structures that are commonly associated with higher permeability.
For the purpose of generalising about the hydraulic characteristics of areas within the Main Karoo Basin, the Basin was divided up into domains that reflect lithological, metamorphic and depositional areas of commonality. Together with the maps/ datasets of favourable geological structures, they were used to delineate the potentially high-transmissivity areas.
While permeability (or transmissivity) is considered the main factor that limits groundwater potential in the Main Karoo Basin, the overall potential of groundwater resources is a function of recharge and storage. For this reason, it is necessary to assess an aquifer's potential in these terms as well as a wellfield's localised groundwater potential. Two tools were developed for these purposes: The Aquifer Firm Yield Model and the C-J Wellfield Model.
Transmissivity maps
The reason why a transmissivity map is of great value is because of the direct correlation between the yield of a borehole and the transmissivity of the aquifer, the yield increasing as the transmissivity increases and vice versa. Transmissivity maps (GIS datasets) of the Main Karoo Basin were developed to provide guidance on groundwater targets and potential borehole yields. Whilst this is seemingly an impossible task owing to the heterogeneous nature of fractured rocks, the approach took both existing borehole yields and geology into account, and provides a range of possible values for each identified hydrogeological domain (based on lithologies and in some cases, subdivided lithologies), dolerite dykes and sills, fractured margins of sills and areas of thick alluvium.
The approach used to develop the transmissivity maps was based on the work of Mr A Woodford on the Eastern Karoo Basin, and is described in detail in Dondo et al. (2010). While Woodford's method is problematic in that it equates pumping tests' constant discharge test rates to transmissivity values, it is nonetheless the most comprehensive approach to date in developing a regional transmissivity map in South Africa. Previously produced transmissivity maps that cover the Main Karoo Basin, such as those of Conrad (2005) and Rosewarne (2008), show large areas in excess of 100 km in length with transmissivity values of greater than 25 m2/d. Values such as these only represent the most permeable part of an aquifer and not the bulk of Karoo formations which have very low permeabilities. Conrad's values were obtained using drilling yields from the National Groundwater Database and multiplying them by 10 to obtain transmissivity values - a crude method proposed by Kirchner and Van Tonder (1995) to obtain first estimates.
Woodford's method is shown to perform significantly better than the crude methods previously used, but possibly could have performed even better had he aimed to relate specific yield values to transmissivity rather than constant discharge rates. Being the best method available, Woodford's approach was modified and extrapolated to the entire Karoo Basin by applying various yield-transmissivity equations to the lithological domains, dolerite dykes and sills, and areas of potentially thick alluvium. Woodford analysed hundreds of pumping tests in order to produce equations that relate borehole yields to aquifer transmissivity. He dissected the drawdown vs. time curves taking into account the nature of fractured Karoo aquifers and their response to pumping. Once transmissivity values were determined for each portion of the drawdown curves (early-, mid- and late-time periods) for each lithology and groundwater target structure (e.g. dyke, sill, sheet, etc.), graphs were produced by plotting the constant discharge pumping test rate vs. transmissivity and fitting a power function to the data (Eq. (1)). These graphs were then used to develop generalised equations that relate borehole yield to transmissivity for each lithology and type of structure in the Eastern Karoo Basin.

where:
T = transmissivity
A and b = constants
Qp = yield of the lithological domain
Woodford's method was adapted to obtain ranges of transmissivity values to cover the entire Main Karoo Basin. An example of the transmissivity-yield equations used for dykes is shown in Eq. (2):

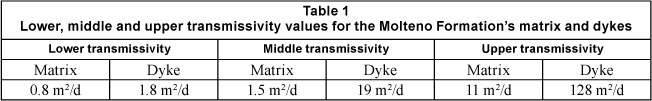
In order to provide a range of transmissivity values the harmonic mean, median and arithmetic mean were used, respectively, on the lower, middle and upper 33% of Woodford's data values from the Eastern Karoo Basin. For a full description of the method and the results the reader is referred to Murray et al. (2012). An example of the transmissivity values obtained for the Molteno Formation's matrix (or unfractured host-rocks) and dykes is shown in Table 1.
Table 1 shows, for example, that if a borehole is located in the Molteno Formation on a dyke with the host rock consisting predominantly of mudstones, then the estimated transmissivity value would be obtained by adding up the lower values (0.8 + 1.8) to obtain 2.6 m2/d. The reason why these 2 values are added up is because water flowing to the pumped borehole would be drawn from both the matrix and the dyke (or alluvium and the matrix below if a borehole penetrated both). If the area consisted of roughly equal proportions of sandstone and mudstone, the middle values should be used to get a total of 20.5 m2/d, and if the host rock is predominantly sandstones, a value of 139 m2/d (upper values) would be obtained. Using this approach, transmissivity maps for the Main Karoo Basin were developed that reflect lower, middle and upper values. In using these maps the user would need to decide which to use depending on the geology and information of local borehole yields. The transmissivity maps were produced as 'working' maps, and can only be used as such in electronic format. At small scales, they appear rather 'uneventful'; however, as the scale increases, so the high-transmissivity areas stand out and linear zones, e.g. dykes, can be seen. Figure 4 shows how the maps can be used in electronic format to provide guidance in selecting transmissivity values. The linear zones in this example reflect dykes and the light-blue area reflects an alluvial basin.

The aquifer firm yield model (AFYM)
Geohydrologists traditionally provide a single, time-invariant estimate of the average safe or sustainable yield of an aquifer using average inputs and outputs (i.e. mean annual recharge and evapotranspiration, etc.). The Harvest Potential (Baron et al., 1998) and the Groundwater Resource Assessment Phase II (GRAII) (DWAF, 2005) are commonly used examples of these static datasets. Their static nature prevents users of these datasets from changing the yields or parameter values used to obtain the yields even if better values are known. While the Harvest Potential (HP) provides a single yield, the GRAII data provide 2 yields; one based on 'normal' rainfall and the other on 'drought' conditions. The practical usefulness of such estimates of 'safe groundwater yield' to water planning is questionable, especially in the arid and semi-arid areas of South Africa where the rainfall is extremely variable (including the Karoo Basin). For this reason it was deemed necessary for groundwater resource assessments to be brought on par with assessments applied by surface-water planners. The new regional aquifer yield methods developed during this project (the aquifer yield model) use data such as recharge that can be set to represent the specific area under study. While default values are provided, the user can input site-specific data if available. The significant difference between the new approach developed and the GRAII and HP methods is that the user must specify the variables based on local knowledge to obtain the most realistic yield, whereas the GRAII and HP methods simply present their yield values and do not allow the user to modify them.
Two versions of the aquifer yield model were developed during the project:
- The Aquifer Assured Yield Model (AAYM). This version provided assured yields; similar to assurance levels given in surface-water reservoir design. The assured yield of the system is estimated by statistical analysis of long-term time-series data of inflow vs. reservoir/aquifer storage and can vary according to various design-demand criteria. This type of risk analysis is regularly performed when assessing hydrological information. The risk, in this context, is defined as the percentage of years when the assured yield may not be supplied in full, e.g. a 90% assurance of supply implies a risk that there may be shortages on average in 10 out of every 100 years.
- The Aquifer Firm Yield Model (AFYM). This version is a modification of the AAYM and provides historical firm yields and not assurances of supply. The firm yield is defined as the maximum volume of water that can be guaranteed from a reservoir/aquifer during a critical dry period, which is often based on the lowest natural stream flow/recharge sequence on record. This is the yield model that was delivered in software format as part of the packaged 'tools'.
These models are single-cell, lumped-parameter models and make use of a critical management water level below which aquifer storage levels cannot be drawn down to provide estimates of the firm or assured yield of an aquifer. This level defines the volume of water held in aquifer storage that is available for abstraction and would take into account various physical, legal, societal or environmental constraints. Figure 5 shows the essential components of the lumped-box AFYM. The aquifer yield models are only intended for use during the early planning stages of groundwater resource assessment studies where spatial and temporal hydrogeological information is scarce and perhaps several alternative schemes for increasing water supply are being considered. Like all models, its limitations are related to both the assumptions on how well it simulates physical processes, which in this case is basic, being a box model, and the datasets from which the simulations are run. To account for the latter concern, users of this model should feed site-specific data into the model whenever possible.

The approach used in the AFYM is exactly the same as the approach used in surface-water assessments of historical firm yields. The key difference between the 2 approaches is the nature of the reservoir - for a dam, 'empty' is defined by the level of the dead storage volume, whereas for an aquifer it is defined as the maximum allowable drawdown; the latter being a user-specified management level below which it is considered undesirable to draw down the water level.
However, there are 2 critical differences between the yield assessments for surface-water reservoirs and groundwater aquifers. The first is that a surface-water reservoir has a specified volume, whereas an aquifer does not. The second is that a surface-water reservoir is infinitely permeable whereas an aquifer is not. An aquifer will still be able to source water even though it has reached the specified maximum allowable drawdown, as opposed to a dam reaching its dead storage level.
The model makes use of existing geohydrological data such as the GRAII dataset (DWAF, 2005), WR2005 (Midgley et al., 1994) which provides an output of monthly flow per quaternary catchment, and various other data sources for individual parameters. It is a simple groundwater-balance model that reproduces storage dynamics based on variable volumes of inflow and outflow and provides groundwater yields at 100% assurance of supply. The model assumes that Karoo fractured-rock aquifers can be adequately represented as single-layer conceptual hydrogeological systems; the aquifer is unconfined to semi-unconfined and characterised by a specific yield; the aquifer system is 'water-tight' in that no groundwater inflow from or outflow to adjoining aquifers occurs; and groundwater abstraction takes place evenly across the entire surface area of the aquifer system.
While it is acknowledged that recharge to Karoo aquifers occurs primarily as episodic events during periods of high rainfall, it is not possible to model this process in the AFYM. The model is run using time series of monthly rainfall data available from the WR2005 data set, and to a limited extent the user can accommodate the episodic nature of recharge by assigning a recharge threshold value (the minimum volume of rainfall required in a month for an aquifer to be recharged). This way, months with low rainfall can result in no recharge to the aquifer.
The software model is run in monthly time increments on a quaternary catchment scale whereby inflow and outflow parameters (such as recharge as a percentage MAP, evapotranspiration, baseflow and threshold) have default values, or alternatively can be set according to the user. The yield obtained, like the GRAII and HP yields, provides a rough estimate of the catchment's groundwater potential - a yield to bear in mind (and generally not exceed) when undertaking more detailed, localised estimates with tools such as the C-J Wellfield Model. Figure 6 shows the firm yields for the Main Karoo Basin quaternary catchments using the recommended default parameter values.
The results of the AFYM were checked against aquifers where recharge assessments had been conducted and yields previously established through detailed assessments. One such example is the De Aar Aquifer which falls within quaternary catchment D62D. A study was carried out on the De Aar Aquifer by Kirchner et al. (1991), which calculated a recharge range of 1.4% to 4.4% MAP using the saturated volume fluctuation (SVF) method. A manual on groundwater recharge estimation by Bredenkamp et al. (1995), provided a rainfall/recharge formula of RE = 0.048(Rf-27). The value of 27 mm is the rainfall threshold below which no recharge takes place. If an Rf value of 287 mm/a is taken from Kirchner et al. (1991), the recharge value calculated using the equation of Bredenkamp et al. (1995) is 12.48 mm, which is 4.3% MAP. This recharge value lies within the range suggested by Kirchner et al. (1991) which took a threshold into account; thus the AFYM was run with this recharge value and no threshold.
Woodford (SRK, 2007) describes the investigation undertaken by SRK Consulting in De Aar during which potential recharge from rainfall was estimated. He used a process named the Maxey-Eakin technique (Maxey and Eakin, 1949; Davisson and Rose, 2000). This process describes a relationship between groundwater recharge and mean annual precipitation in the following formula: Re = 0.0001 x MAP2. This equation produced a range of recharge values from 2.7% to 3% MAP for different wellfields.
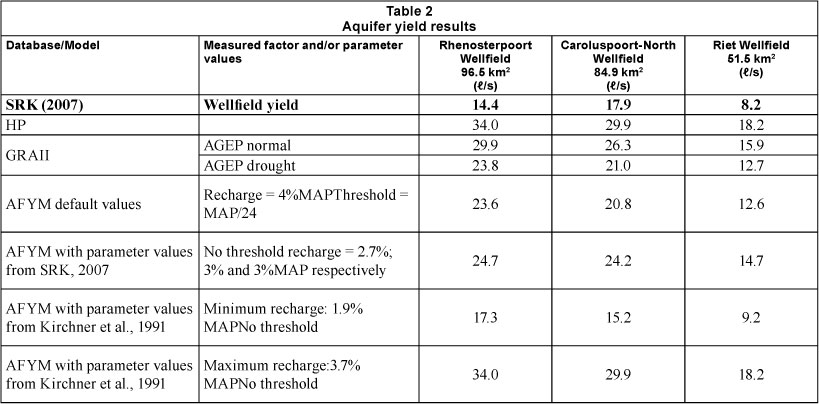
The AFYM was run a number of times to compare all recharge values from the various sources. All regional approaches (HP, GRAII and AFYM) were scaled back to the wellfield areas so that they could be compared to each other (i.e. the yield for the entire quaternary catchment was reduced accordingly). The results are shown in Table 2.
The following points can be noted:
- Harvest Potential (HP): The HP yield is significantly higher than SRK's estimated wellfield yield, and also higher than the AFYM with default recharge values.
- GRAII: Both GRAII yields (AGEP normal and drought) are higher than SRK's estimated wellfield yield. The GRAII AGEP normal value is slightly higher than the default AFYM values, and the AGEP drought values are very similar to the default AFYM yields.
- AFYM with recharge values from SRK (2007): By applying the SRK recharge values to the AFYM, the firm yields obtained are fairly similar to the default firm yield results.
- AFYM (Kirchner et al., 1991): If the recharge values obtained from Kirchner et al. (1991) are used in the AFYM, the lower recharge value (1.9% MAP) compares very favourably to the SRK wellfield yields, but the higher recharge values are significantly higher than the SRK wellfield yields.
In this case study, it was assumed that the assessment by SRK (2007) produced realistic wellfield yields. In comparing AFYM results with the SRK results, it can be seen that the AFYM gives similar yields to those of SRK if the lower recharge values obtained by Kirchner et al. (1991) are used and if the SRK recharge values are used (2.7% to 3% MAP) in the AFYM. If the default recharge value (4% MAP) with the default threshold value (MAP/24) isused, the AFYM gives yields that are higher than the SRK wellfield yields, but not nearly as high as the HP and GRAII (normal) values. This example shows that the AFYM gives good results for this area when conservative recharge values are applied to the model, and reasonable results when the default values are used.
Wellfield model
When designing a wellfield a number of factors need to be considered such as the number and location of production and monitoring boreholes, the pumping rates and daily pumping duration of each borehole, borehole interference and spacing, environmental considerations such as potential impacts on surface-water bodies and groundwater-dependent ecosystems, and potential impacts on existing users.
Key to these factors is the effect of abstraction from one borehole on another and the optimisation of borehole spacing. With correct abstraction rates and borehole spacing, a wellfield can yield a reliable flow with negligible impacts on other users and the environment. Although recharge to the aquifer and the wellfield area affects borehole water levels, for optimising borehole spacing it is aquifer permeability (or transmissivity) that is of paramount importance. Localised effects on borehole water levels such as impermeable boundaries and sources of likely recharge such as nearby rivers or lakes should also be taken into account in wellfield design. If needs be, a sophisticated numerical model that takes recharge, boundaries and spatial differences in aquifer parameters into account should be developed to predict aquifer water levels with various abstraction scenarios. However, for early-stage planning purposes, it is usually not necessary to develop a detailed numerical model; nor is the data usually available.
A simple model, called the Cooper-Jacob Wellfield Model (abbreviated to the C-J Wellfield Model) was developed to assist in estimating borehole spacing for planning and costing purposes. This model is based on the commonly used Cooper-Jacob approximation of the Theis groundwater flow equation (Cooper and Jacob, 1946; Theis, 1935). Numerous borehole configurations were modelled and guidance on spacing with levels of water-level interference given. An example of this is shown in Fig.7 which illustrates the borehole spacing required between 2 pumping boreholes. In this example, if the aquifer is assumed to have a transmissivity value of 20 m2/d and the boreholes are pumped at 5 l/s, they would have to be placed 500 m apart in order to restrict their interference to 5 m over a year of abstraction.

As can be seen when applying the AFYM, the C-J Wellfield Model will give good results if the aquifer parameters are realistic, and thus if real values obtained from case studies in the near vicinity are available - such as transmissivity values estimated from pump test data - they should be used. If such values are not available, the transmissivity maps can provide good first estimates.
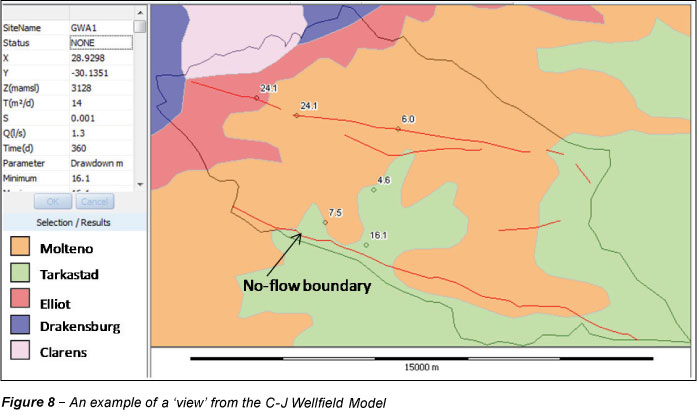
Figure 8 provides an example of the model 'view' with a geological map as the background and the simulated drawdowns in individual boreholes. In this example each borehole was assigned an abstraction rate and the model was run. The model runs for the duration (days) set for each abstraction borehole at their stipulated rates and presents the drawdowns in all the boreholes that have been affected by pumping. These values are the result of the drawdown caused by pumping together with the additional drawdown due to abstraction from adjacent boreholes (borehole interference).
Borehole water level and abstraction data from pumped wellfields were used to test the C-J Wellfield Model. The results from one example, namely, De Aar's Vaalbank Wellfield, are shown in Table 3. These boreholes were pumped (virtually) continuously between 1992 and 2006 at an average combined rate of 11.8 l/s. The aquifer-parameter values such as transmissivity and storativity were obtained from the De Aar report compiled by Rinkel (1974) and were used in the model.
From a number of examples like the one presented above it appears that the C-J Wellfield Model is successful in reproducing the wellfield environment and modelling the water-level response of monitoring boreholes to abstraction. In using the model, it is important to gain adequate knowledge of the area and geology in which the boreholes are sited to ensure that the Cooper-Jacob flow equation incorporated into the wellfield model is applicable to the area of interest.
Wellfield cost model
The Wellfield Cost Model (WCM) provides a means of rapidly evaluating the capital cost and operation and maintenance cost of a new wellfield. The WCM considers all infrastructure and associated fees required to establish a wellfield; from the identification of suitable borehole sites, to drilling, test pumping, pump installations and the construction of pipelines, water-treatment facilities and bulk storage.
The model outputs comprise cost information and detail of the associated infrastructure. This information is presented at 2 levels of detail:
- The main infrastructure detail and cost information that can be used for generating lifecycle unit costs (Fig. 9)

- A full schedule of quantities of the different infrastructure components used to calculate the scheme cost.
Conclusion
This paper provides a brief overview of the planning tools that were developed to identify favourable areas of groundwater potential for bulk municipal water supplies, to provide a method to quantify them, and to package the information so that it is assessable for planning purposes. Where possible, the tools were tested in areas with observed data and the results proved favourable for use in the planning stages of a water-supply project. In summary, the following tools were developed:
- Groundwater Quality Maps (and GIS datasets) which provide an indication of expected water quality and treatment requirements
- Transmissivity Maps (and GIS datasets) which provide an indication of potentially high permeability areas throughout the Main Karoo Basin and estimated transmissivity values
- The Aquifer Firm Yield Model which provides an indication of the groundwater potential of an area
- The C-J Wellfield Model which provides an indication of how many boreholes are needed and the spacing required between them to obtain the required yield
- The Wellfield Cost Model which provides an indication of the capital and O&M costs of developing a groundwater-supply scheme.
The abovementioned tools, which are primarily aimed at hydrogeologists, have been packaged for use in electronic format.
Acknowledgements
The authors would like to thank the following people and organisations for their valuable inputs into this project:
- The Water Research Commission for funding the project and in particular Dr Shafick Adams, the project manager, for his active support
- Alan Woodford, initially from SRK Consulting and later from Specialist Groundwater Solutions, for his initial involvement in all aspects of the project, including programming the Aquifer Assured Yield Model
- Luc Chevallier, Council for Geoscience, for input on groundwater targets and in delineating the lithological, metamorphic and depositional domains of the Main Karoo Basin
- Jonny Harris, Maluti GSM, for developing the Wellfield Cost Model
- Ian Wilson, Spatial Modelling Solutions, for the GIS processing of the groundwater-quality data
- Gerrit van Tonder, IGS, for his ideas and comments on approaches to developing transmissivity maps, well-field models and aquifer-yield estimates
- The members of the Project Reference Group for their advice and support. The following list includes all people who contributed to Reference Group Meetings:S Adams (WRC); F Fourie (DWA); M Basson (HATCH); J Denison (Umhlaba Consulting Group); L Chevallier and A Nomnganga (CGS); P Ravenscroft (Maluti GSM); A Woodford (SRK/SGS); E Bertram (DWA); H Goosens (DWA); J A du Plessis (U. Stel); H Boning (Vela VKE); J Harris (Maluti GSM); R Dennis (NWU); K Baker (GWA); and R Murray (GWA).
We would also like to thank the following people who shared their knowledge on approaches to quantifying surface and groundwater resources that incorporate concepts of assurance of supply: Mike Shand (Aurecon), Andre Gorgens (Aurecon), Verno Jonker (Aurecon), Karim Sami (WSM Leshika), Koos Vivier (AGES) and Thinus Basson (HATCH).
References
BARON J, SEWARD P and SEYMOUR A (1998) The Groundwater Harvest Potential Map of the Republic of South Africa. Technical Report Gh 3917. Directorate of Geohydrology, Department of Water Affairs and Forestry, Pretoria, South Africa. [ Links ]
BREDENKAMP DB, BOTHA LJ, VAN TONDER GJ and VAN RENSBURG HJ (1995) Manual on Quantitative Estimation of Groundwater Recharge and Aquifer Storativity. WRC Report No.TT73/95. Water Research Commission, Pretoria, South Africa. [ Links ]
CONRAD J (2005) Preparation and Production of a Series of GIS-based Maps to Identify Areas where Groundwater Contributes to Baseflow. Report No. G2005/02-1. GEOSS, Stellenbosch, South Africa. [ Links ]
COOPER HH and JACOB GE (1946) A Generalized Graphical Method for Evaluating Formation Constants and Summarising Well Field History. Am. Geophys. Union Trans. 27 526-934. [ Links ]
DAVISSON ML and ROSE TP (2000) Maxey-Eakin Methods for Estimating Groundwater Recharge in the Fenner Watershed, Southeastern California. Lawrence Livermore National Laboratory, University of California on behalf of US Department of Energy, Contract W-7405-Eng-48. 15 pp. [ Links ]
DWAF (DEPARTMENT OF WATER AFFAIRS AND FORESTRY, SOUTH AFRICA) (2005) Groundwater Resource Assessment II -Groundwater Planning Potential. Technical Report No. 2C, Project No. 2003-150. DWAF, Pretoria, South Africa. [ Links ]
DWA (DEPARTMENT OF WATER AFFAIRS, SOUTH AFRICA) (2010) Groundwater Resource Determination Method (GRDM), Version 4. DWA, Pretoria, South Africa. [ Links ]
DONDO C, CHEVALLIER L, WOODFORD AC, MURRAY EC, NHLEKO LO, NOMNGANGA A and GQIBA D (2010) Flow Conceptualisation, Recharge and Storativity Determination in Karoo Aquifers, with Special Emphasis on Mzimvubu-Keiskamma and Mvoti-Umzimkulu Water Management Areas in the Eastern Cape and KwaZulu-Natal Provinces of South Africa. WRC Report No. 1565/1/10, Water Research Commission, Pretoria, South Africa. [ Links ]
KIRCHNER J and VAN TONDER GJ (1995) Proposed Guidelines for the Execution, Evaluation and Interpretation of Pump Tests in Fractured-Rock Formations. Water SA 21 (3) 87-200. [ Links ]
KIRCHNER J, VAN TONDER GJ and LUKAS E (1991) Exploitation Potential of Karoo Aquifers. WRC Report No. 170/1/91. Water Research Commission, Pretoria, South Africa. [ Links ]
MAXEY GB and EAKIN TE (1949) Ground Water in White River Valley, White Pine, Nye, and Lincoln Counties, Nevada. State of Nevada, Office of the State Engineer, Water Resources Bulletin No. 8. Prepared in cooperation with the United States Department of the Interior Geological Survey 1949. 59 pp. [ Links ]
MIDGLEY DC, PITMAN WV and MIDDLETON BJ (1994) Surface Water Resources of South Africa 1990. Vol. I-VI. WRC Report Nos. 298/1.1/94-298/6.1/94. Water Research Commission, Pretoria, South Africa. [ Links ]
MURRAY R, BAKER K, RAVENSCROFT P, MUSEKIWA C and DENNIS R (2012) A Groundwater Planning Toolkit for the Main Karoo Basin: Identifying and Quantifying GroundwaterDevelopment Options Incorporating the Concept of Wellfield Yields and Aquifer Firm Yields. WRC Report No. 1763/1/11. Water Research Commission, Pretoria, South Africa. [ Links ]
RINKEL MW (1974) Pumping Test Evaluation in the Southwest Region of De Aar. Department of Water Affairs and Forestry, Pretoria, South Africa. [ Links ]
ROSEWARNE PN (2008) Aquifer Transmissivity. Document prepared as part of the Water Resources of South Africa 2005 Study (WR2005). WRC Report No. K5/1491. Water Research Commission, Pretoria, South Africa. [ Links ]
SRK (2007) Geohydrological Assessment of De Aar's Groundwater Resources. Report for Emthanjeni Municipality by AC Woodford, SRK Consulting, Rondebosch, South Africa. [ Links ]
THEIS CV (1935) The Relationship between the lowering of the piezometric surface and the rate and duration of discharge of a well using groundwater storage. Am. Geophys. Union Trans. 16 519-524. [ Links ]
This paper was originally presented at the International Conference on Groundwater: Our Source of Security in an Uncertain Future, Pretoria, 19-21 September 2011.
* To whom all correspondence should be addressed. +27 21 852-0847; fax: +27 86 616-5146 e-mail: ricky@groundwaterafrica.co.za

