


Servicios Personalizados
Articulo
 Inglés (pdf)
 Articulo en XML
 Referencias del artículo
Indicadores

Links relacionados
-
 Citado por Google
 -
 Similares en Google
Compartir

 Permalink
Water SA
versión On-line ISSN 1816-7950
versión impresa ISSN 0378-4738
Water SA vol.38 no.3 Pretoria ene. 2012
Sand, salt and water in the Stampriet Basin, Namibia: Calculating unsaturated zone (Kalahari dunefield) recharge using the chloride mass balance approach
AEC StoneI, II, *; WM EdmundsI
IOxford Water Futures Programme School of Geography and the Environment, University of Oxford, South Parks Road, Oxford, OX1 3QY, UK
IILandscapes Dynamics Research Cluster, School of Geography and the Environment, University of Oxford, South Parks Road, Oxford, OX1, 3QY, UK
ABSTRACT
Estimating groundwater recharge rates in the Stampriet Basin is important for assessing the sustainability of the groundwater resource both within south-east Namibia, and across the borders of this transboundary resource into Botswana and South Africa. The 65 000 km2 basin contains a multi-layered aquifer system, of up to 9 superimposed aquifers, with a major upper unconfined and 2 major artesian levels. The majority of water abstraction (66%) is from the unconfined Kalahari Aquifer. This research investigates the direct recharge pathway through the dune-sand cover of the southern Kalahari dunefield which overlies ~80% of the basin. This is undertaken using established chloride mass balance methods within 4 unsaturated zone profiles (9 m to 11.5 m depth) from 2 regions of the basin. The results indicate that recent recharge rates are between 7 mmy-1 to 46 mmy-1, with profiles representing between 10 years and 30 years of rainfall infiltration. This is the first time that substantial direct (diffuse) recharge has been quantified for the Stampriet Basin, and this part of the southern Kalahari. These 4 profiles indicate potentially similar levels of spatial variability as seen in many other semi-arid, sand-rich unsaturated zones across the world. Further studies using the unsaturated zone should be employed in this region, to better inform our understanding of recharge mechanisms across the basin. The chloride mass balance technique provides information about the unsaturated zone, and important insights about recharge in various sand-covered regions of the basin for which very little is known, or is possible to determine using conventional water balance approaches. Direct recharge rates estimated in this way constitute a vital part of constraining the water balance of the basin, and particularly of the Kalahari Aquifer from which the majority of groundwater abstraction occurs.
Keywords: groundwater, direct recharge, chloride mass balance, unsaturated zone, Stampriet Artesian Basin, Kalahari
Introduction
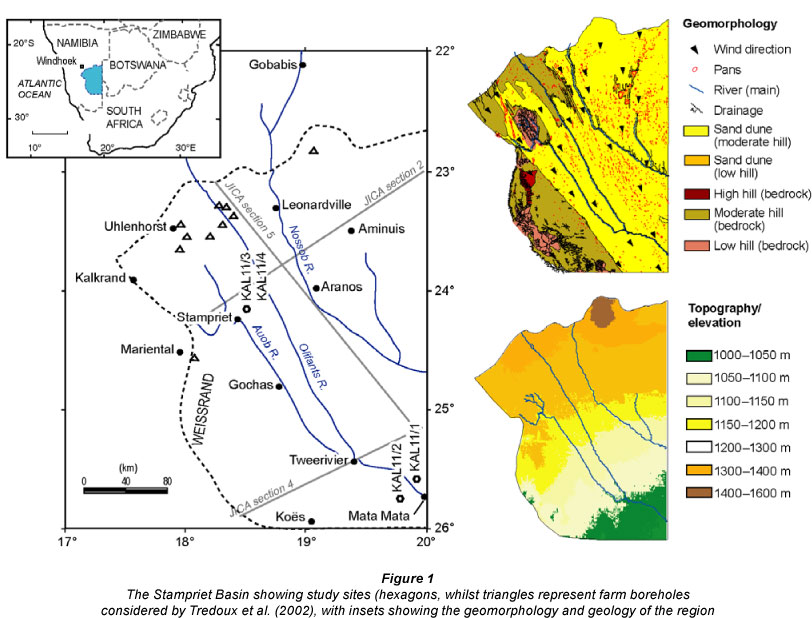
The Stampriet Basin (often referred to as the Stampriet Artesian Basin, SAB, whether or not the artesian layers are being considered) is a multi-layered aquifer covering ~65 000 km2 in Namibia (JICA, 2002; Tredoux et al., 2002) and extending an unknown distance into Botswana and South Africa (Fig. 1). It is a vital resource in this semi-arid part of the southern Kalahari, where surface water is scarce and unreliable. Groundwater supports domestic use of water and also agriculture (including the practice of irrigation farming and livestock), which is the main contributor to job creation and the economy of this region (Christelis and Struckmeier, 2001). As a transboundary resource its sustainability is an important issue for continuing human and economic development, not only in the Namibian portion of the aquifer, but in the largely unstudied and undeveloped portions within eastern Botswana and the northern reaches of the Northern Cape of South Africa. Declining artesian aquifer water levels, of ~5 cmy-1 have been reported (JICA, 2002) and establishing sustainable management of this aquifer requires assessment of present-day, Recent reassessment of the recharge behaviour of the northwest fringes of the SAB by Tredoux et al. (2002) and Kirchner et al. (2002) (Fig. 1) suggests that recharge via faults and karst features (focused recharge) is the dominant mechanism of recharge in this north-west portion of the SAB, and specifically to the Auob artesian layer (Fig. 1, karst features are in Weissrand and NW, seen as regions of dense drainage lines). By extension, considering that the flow direction in this multilayered aquifer basin is north-west to south-east, it is assumed by those authors that focused recharge through sinkholes and faults is the major recharge source for the entire basin.
This paper provides the first application of the chloride mass balance (CMB) technique (Edmunds et al., 1988) in the unsaturated (or vadose) zone (USZ) above the SAB to address whether direct (or diffuse) recharge through the Kalahari linear sand-dune cover is occurring as potential recharge to groundwater. CMB approaches are a well-established method for estimating direct recharge in arid and semi-arid regions (see Scanlon et al., 2006 for a recent review). We note that without large-scale drilling at these sites, and borehole level monitoring from unconfined and confined layers it is not possible to assess what happens to the water beneath the sampled depth of the unsaturated zone within the Kalahari dunes. Where dated using optically stimulated luminescence dating, often to full dune depth, the Kalahari linear dunes are of Quaternary age, with those at the western margin (toward Mariental) < 50 ka (from samples at the base of dunes), and ~ 186 ka ± 15 ka at 6.5 m to 8.5 m depth east of Stampriet (Stone and Thomas, 2008). In Botswana there has been a lively debate over the past century as to whether rainfall is able to penetrate the depth of the Kalahari sand dunes (representing the USZ) to reach underlying aquifers. For example, whilst Foster et al. (1982) concluded that direct recharge was unlikely for sands exceeding 4 m in thickness, Gieske (1992), Gieske et al. (1995), Selaolo et al. (1995), Selaolo (1998) and De Vries et al. (2000) have all shown that recharge may be occurring in thicknesses of 10 m and more. This contrasts with earlier ideas from a number of authors who thought that diffuse recharge could not occur through sand thickness of > 6 m (e.g. Martin, 1961; Boocock and Van Straten, 1962; Foster et al., 1982; De Vries, 1984).
In the present study 4 USZ dune cores have been sampled above the SAB; in the SE of the basin, a core to the south and a core to the north of the Auob River and near Stampriet a pair of cores (~5 m apart to investigate small-scale site similarity) (Fig. 1, hexagons). As the dunefield mantle covers 80% of the surface of the basin, infiltration through the sands (USZ) representing the direct (or diffuse) recharge mechanism to those underlying aquifer levels with a hydrological connection, is a very important regional parameter, and has currently not been addressed for this basin.
Location
The SAB lies in the south-east of Namibia, between ~22º S to 26º S, extending as far west as 17º 30'E near Kalkrand, and extending an uncharted distance into Botswana and the north of the Northern Cape, South Africa, to the east (Fig. 1). The basin slopes slightly from north-west to the south-east, with a highest elevation of 1 350 m amsl at the north and north-west boundary and lowest elevation of 950 m amsl in the south-east near Mata-Mata and Koés (Fig. 1 - inset with topography). Geomorphologically, the region is dominated by the southern Kalahari dunefield (Fig. 1 - inset with geomorphology), which covers ~80% of the surface of the basin, with linear dunes oriented broadly NW-SE. The dunefield extends about 20 km west of the Auob River, and gives way to exposed bedrock in the south-west from Koés up to Mariental, and again in the north-west. There is a distinctive gap in the dunes north-west of Stampriet, which lies between upper reaches and dry tributary streams of the Auob River (Fig. 1 a geomorphological inset). Surface drainage follows the elevation pattern, via ephemeral rivers, the Auob, Olifants and Nossob Rivers, and the former water courses and tributaries also describe this trend. The ephemeral rivers only flow in periods of high rainfall, but remain endorheic within the Orange River basin. The Auob was observed to flow as far as ~60 km from the border with South Africa in April 2011 during fieldwork.
Mean annual rainfall varies across the basin with values of ~240 mmy-1 at Leonardville, 205 mmy-1 at Aranos, 190 mmy-1 at Stampriet and 175 mmy-1 at Koés. It is estimated by the local farmers that the 2010-2011 rainy season experienced about 3 times the annual average precipitation. The last time rainfall was this high was during the mid-1970s (1974 and 1976), with 600 mmy-1 recorded at Leonardville for 1974. Another good rainfall season occurred in 1999/2000, in which lakes were forming in the dune areas east of Kalkrand (Kirchner, 2012). In 2011, during sampling, there was water in pans just east of Stampriet. Levels of mean annual potential evaporation are high in the region, and estimated to be between 3 000 mmy-1 in the north to 3 500 mmy-1 in the south. Rainfall is characteristically episodic in semi-arid regions, including southern Africa, which means that recharge is also often similarly episodic (Van Wyk, 2012).
Hydrogeology
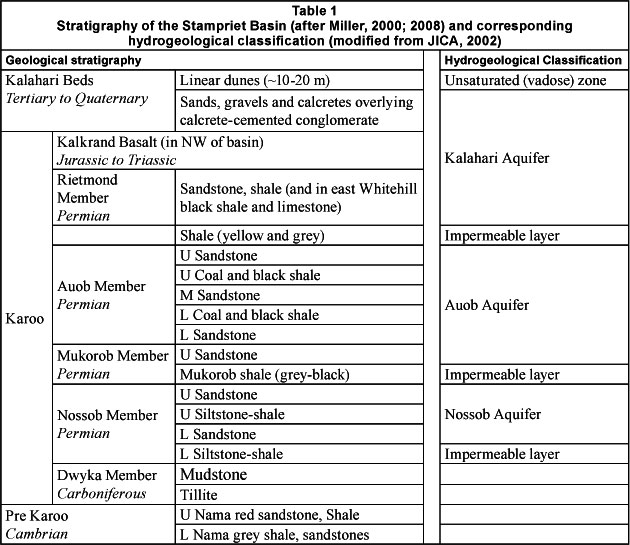
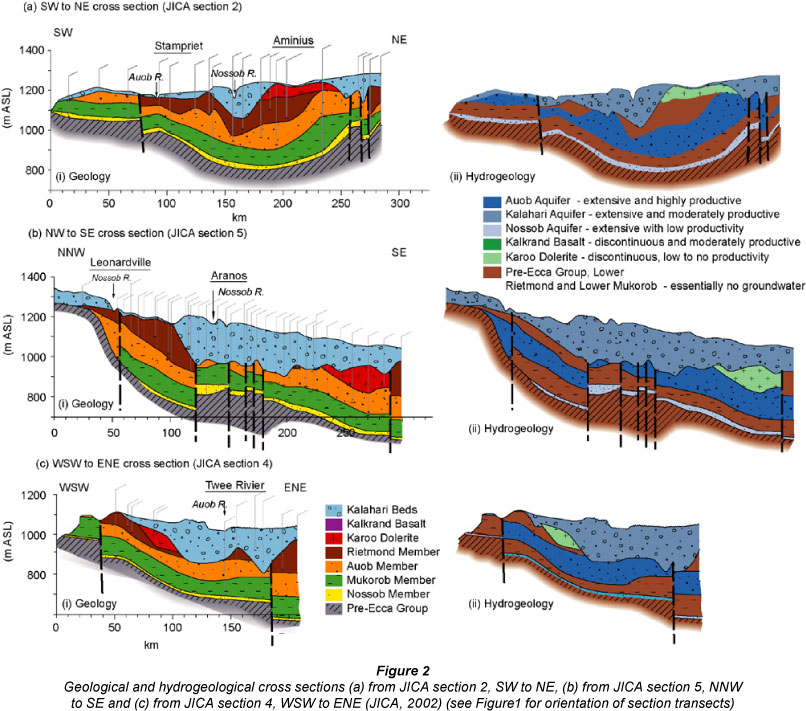
A detailed geological reinterpretation of earlier reports (Range, 1914; Martin, 1962; Heath, 1972) and new boreholes drilled during the JICA (Japan International Cooperation Agency) study (1999-2001) has been undertaken by Miller (2000) and JICA (2002). Table 1 illustrates a simplified geological stratigraphy and corresponding hydrogeological classification, and Fig. 2 illustrates 3 geological and inferred hydrogeological cross sections for the region. The reinterpretation confirmed the multi-layer nature of the aquifer, with water being contained in the Nossob, Auob and Kalahari members. It also illustrated the complexity of the stratigraphy, with erosional contacts, faults and dolerite intrusions, which means that the aquifer units do not overlie each other in all regions of the basin (JICA, 2002). Erosion prior to the deposition of the Kalahari Basin formed channels, which in the south-eastern region of the basin reached the lowermost Auob levels (Miller, 2008). The implication is that any hydraulic linkage between the aquifer units is also complex. Across much of the basin the Auob Aquifer is clearly confined. This is demonstrated in regions such as Olifantswater in the north-west of the basin, where piezometric data suggest a lack of direct hydraulic linkage between the Kalahari and Auob Aquifers (see Tredoux et al., 2002 and JICA, 2002), and may be the case over much of the basin. However, there may be some connection where the erosion channels occur and where faults and dolerite intrusions exist.
Good progress has been made in understanding the recharge mechanisms in the north-western and western part of the basin. The combination of piezometric data, geological sections that indicate the Auob and Nossob artesian members wedge out at the north-west and western edge of the SAB and the observation of sinkhole structures in near Uhlenhorst and on the Wiessrand near Mariental (indicated as dense drainage lines on geomorphology inset, Fig. 1), and the observations of the 1960 cloudburst and infiltration by Schalk (1961) have led Tredoux et al. (2002) to suggest focused recharge through the sinkholes and geological fault lines as being the most important in that region. However, as Tredoux et al. (2002) note, there is poor understanding of the recharge mechanisms elsewhere in the basin. Radiocarbon ages taken from Kalahari, Auob and Nossob Aquifers are all relatively high, with ages < 2000 years along the north-western part of basin and Nossob River (e.g. JICA, 2002). JICA (2002) also report finding tracers of tritium in boreholes into the Kalahari Aquifer (and one into the Auob Aquifer) and suggest it is possible that more recent water has become blended into groundwater and also note that chemical reactions within the groundwater system can lead to overestimations of radiocarbon ages. It has remained difficult to come to definitive conclusions about levels of recharge to upper layers and artesian layers.
Sample sites and methods
Linear dunes (making up the uppermost USZ) were sampled in 2 regions (Fig. 1, hexagons), with cores taken from bare patches of sand, and away from dense vegetation cover, with particular care to sample as far as possible from small trees (at least 30 m), to reduce the chance of striking roots and locally high areas of evapotranspiration. Of course, these localised effects need to be considered, when estimating the overall regional recharge pattern. In the south-east of the basin core KAL1/1 was taken at 25°29'31.65" S, 19º40' 52.78'' E, 3 km north of the Auob River valley, and core KAL11/2 was taken at 25º44'05.42'' S, 19º40'56.90'' E, 24km south of the Auob River valley. In the centre of the SAB, at Bysteek Farm, near Stampriet (20 km east/north-east) 2 neighbouring cores were extracted (~5 m apart), at 24º16'57.17'' S, 18º35'41.08'' E. The second (KAL11/4) was closer (<1 m) to a clump of grass (Stipagrostis amabilis). The vegetation on the Kalahari dunes includes small 2 m to 3 m Acacia species such as camel thorn (Acacia erioloba), shrubs such as Rhigozum trichotomum, and prevalent grasses (which thrive after the rainy season), including Stipagrostis amabilis, Schmidtia kalahariensis and Aristida congesta. Tsamma melon was also observed (Citrullus lanatus), particularly at Site KAL11/2. Cores into the sand dunes were taken by hand auger (Edmunds and Gaye, 1994) at 20 cm, 30 cm or 50 cm intervals, down to 9.2 m or >11 m depth. Samples were transferred from an aluminium compression sampling head into 15 cm long (representing the vertical plane) sections of opaque drainpipe (as employed by Stone and Thomas, 2008) with tight-fitting lids and sealed tightly to seal in moisture during transit to the laboratory.
The superficial geology comprises virtually carbonate-free linear dune sands, standing between 15 m to 25 m above the inter-dune surface. It is possible to infer the geology underlying the sampled sites from nearby boreholes, sampled and described during the JICA (2002) project. In the southeast, Borehole J8, 25 km west of KAL11/1 and KAL11/2, at Tweerivier (without dune cover) indicates that our sampled dune sands are underlain by Kalahari beds (~140 m thick), and the contact with dunes is a calcrete layer (~3 m thick). The calcrete is moderately karsted, implying that water could drain through the karst solution features, down into the underlying conglomerate (~9 m), sandy calcrete (~7 m) and unsorted sandstone (~110 m thick). The farm boreholes at Terra Rouge Farm, where KAL11/1 and KAL11/2 were sampled, indicate that the water table is reached at ~50 m depth. Near Stampriet, at Bysteek Farm, the nearest JICA borehole (J5) is 20 km west, where the Kalahari beds have wedged out, exposing the upper Rietmond Member (Table 1). However, we can infer from local exposures on Bysteek Farm that there is a shallow Kalahari bed unit (perhaps 20 m to 30 m) including patches of the conglomerate. Locally, the water table is much closer to the surface here, with some flooding in some of the inter-dune pans in the region, including ~2 km south-west of the cored dune, observed during sampling in April, 2011. The ponding in pans appears to be a patchy process, as also reported by Schalk (1961) in the Uhlenhorst region in 1960 and all across the region by Martin (1961). The farmer at Bysteek reports that the boreholes are ~30 m deep, again suggesting that the Kalahari beds (unconfined aquifer layer, Table 1) do underlie the dunes here, rather than at Stampriet, where the Kalahari beds are absent and water is artesian. The base of the Kalahari beds contains fluviatile gravels, which are extensively cemented by calcrete, in some places shallow and weathered (Miller, 2000; JICA, 2002; Miller, 2008). In the north-west this is underlain by Kalkrand Basalt, whilst in the east this is underlain in some places by the Whitehill formation, and elsewhere this directly overlies the Upper Rietmond member. The Upper Rietmond contains sandstone layers of different colours and calcareous contents (over ~40 m). Underneath the Upper Rietmond member, and above the Auob Aquifer sits the Lower Rietmond member (~10 m), composed of siltstones and shales, and considered to be impermeable. Therefore at this site, it is unlikely that direct recharge through the sand dunes would replenish the Auob Aquifer, unless there is hydrological connection at a fault line.
Representative subsamples of each sample were used to determine moisture content, using a gravimetric method, drying at 110ºC for 48 h (Black, 1965) and particle size, using a laser granulometer with statistics calculated using GRADISTAT (Blott and Pye, 2000) and applying the Folk and Ward (1957) method. For chloride analysis the pore water was extracted from 30 g of sand-dune material by elutriation with 12 ml of ultrapure, deionised water (Edmunds et al., 1988; Gates et al., 2008), placed in a shaker tray for 1 h and centrifuged, before filtering the supernatant at 0.2 um. The chloride concentrations of the elutriated samples were analysed at the Oxford Centre for the Environment using ion chromatography, and analytical precision was ~5%, based on repeat measurements of the same elutriated solution on different days, and the detection limit was ~0.1 mgl-1, based on measurements of standard solutions. Sample reproducibility was ~1% to 22% on the basis of multiple elutriations of a number of samples, indicating a reasonable degree of sample homogeneity (wherever multiple elutriations were made, the average value for chloride concentration is used).
Using the steady-state chloride mass balance (CMB) approach, average direct recharge (Rd) through the sampled depth of the unsaturated zone is given by the following equation (Allison and Hughes, 1978):
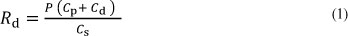
where:
P is the long-term average annual precipitation of the region
Cp is the mean concentration of chloride in rainfall
Cd is the mean chloride from dry deposition (Cp and Cd can be considered together as total deposition (TD))
Cs is the mean concentration of chloride in the pore waters in the unsaturated zone
This uses the fact that chloride is an inert tracer for moisture in the sand and further details on the theoretical basis of the chloride mass balance method can be found elsewhere (Allison and Hughes, 1978; Edmunds et al., 1988). The CMB method integrates recharge at a given site over many years, based on the assumption of steady-state conditions, transmission of water via diffuse (piston) flow and that a representative average for rainfall chemistry (Cp) can be ascertained. Cp is the largest source of uncertainty in the calculations (Scanlon, 2000) and is problematic for the SAB region of Namibia, as no such data have yet been recorded. However, inferences can be made from 2 extensive projects in neighbouring Botswana (GRES I and GRES II, Beekman et al., 1996a; b; Selaolo, 1998), which yield comprehensive maps of the spatial distribution of total chloride deposition up to the border with Namibia. Values for precipitation for the 2 study sites in the SAB are taken from the Namibian Meteorological Service Records from Stampriet (from 1927 to 2002), Koes (from 1951 to 2004) and from farmer Pieter Möller at Terra Rouge (from 1993 to 2010).
It is also possible to calculate the travel time (t) represented by the chloride at a specified depth (z), assuming that cumulative chloride is proportional to time (Cook et al., 1992). The time at a given depth (z) is calculated as:

where:
t represents time
θ is volumetric moisture content
The other variables are defined as in Eq. (1) (Tyler et al., 1996)
Results and discussion
Vertical profiles
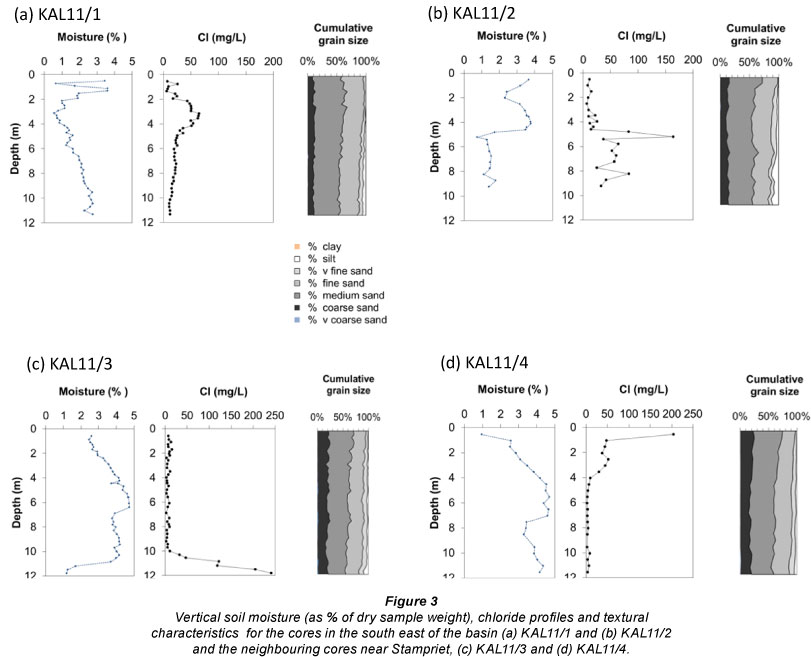
Figure 3 illustrates the sediment texture, moisture contents and chloride concentrations of the 4 profiles. All profiles are relatively homogenous sands, dominated by unimodal, moderately sorted to moderately well-sorted medium sand, with only small textural variations with depth. There is a trend of increasing fine sand and silt content (and less well sorted) with depth. This is most pronounced in KAL11/2 which below 5 m contains poorly-sorted medium sand, with 2 lenses of coarse silty medium sand (10% to 13% silt) towards the base. In both KAL11/3 and KAL11/4 the sediment changes from moderately sorted, to poorly sorted medium sand at 11 m, with small increases in silt (to 9%).
Moisture contents are low, ranging from 0.9% to 4.7%, and all the profiles are above the water table. At the sites of KAL11/1 and KAL11/2 the farm boreholes would suggest that the water table lies at ~50 m depth, whilst at the site of the neighbouring cores (KAL11/3 and KAL11/4) the water table (perched or otherwise) may lie just beneath the 15 m to 20 m high dunes, with localised standing surface water within a 2 km radius. However, it is also possible that the localised standing water may simply represent low permeability in the pan. In KAL11/1 there is an upper (2 m) zone of fluctuating moisture, which would suggest that this is above the zero-flux plane. Below this is a trend of increasing moisture with depth to 2.8%. In KAL11/2 there is a thicker (~4.5 m) fluctuating zone between 3.7% and 2.3% before a rapid drop down to 0.8% at a depth of 5.2 m, below which an average of 1.4% is established. This transition from a moister upper section to a drier lower section does not coincide with a transition in sediment texture (Fig. 3b). The neighbouring cores (KAL11/3 and KAL11/4) describe a very similar moisture-depth relationship, with 2 noticeable differences. The first is the drier uppermost sample of KAL11/4 (that is not seen in KAL11/3), which could be related to different levels of surface disturbance to the sand in the upper 0.5 m. The second is a deep zone of reduced moisture content in KAL11/3 from 11 m depth that is not seen in KAL11/4. It is possible that a comparable region of decreased moisture content in KAL11/4 lies beneath the maximum sampling depth of 11.5 m (limit imposed by available hand-auguring equipment). The dune contains small topographical variations along the crest and it is expected that some variations in dune thickness may occur in horizontal dimension. The trend in the Stampriet cores is of an increase of moisture with depth to 4.7% between 6 m to 7 m and then a slightly lower and more uniform moisture content for the next 3.5 m (before KAL11/3 encounters the drier basal unit). There is no consistent correspondence between the small changes in lithology and moisture content, such as sediment sorting, or the percentage of silt in the sample, contrary to what has been demonstrated by various authors (Tandia, 1990; Gaye and Edmunds, 1996; De Vries et al., 2000).
Concentrations of chloride in these profiles vary from a minimum of 1.7 mgl-1 (at 4 m in KAL11/4) to 240 mgl-1 (at the base of KAL11/3). The 2 cores from the south-east of the SAB (KAL11/1, KAL11/2), tend to have higher steady-state averages than the neighbouring cores near Stampriet (KAL11/3, KAL11/4), which experience larger magnitude fluctuations (Fig. 3). There are considerable differences in shape and concentrations of chloride in the 4 profiles, which is a common finding for semi-arid unsaturated zone chloride profiles (Scanlon et al., 2006). This is observed, for example in southern Australia (Sharma and Hughes, 1985; Cook et al., 1989), Western Australia (Allison, 1988), Senegal (Edmunds and Gaye, 1994; Gaye and Edmunds, 1996), NE Nigeria (Edmunds et al., 1999), eastern Botswana (Beekman et al., 1996b; Selaolo, 1998; De Vries et al., 2000) and northern China (Gates et al., 2008). Spatial variability has been found to occur at the scale of a groundwater basin and also within small subregions (~ 0.5 km2) near Louga in Senegal (Edmunds and Gaye, 1994). The variations in chloride concentration with depth in profiles has been related to variable inputs of chloride into the profile (not including the mixing zone) that correspond to different climatic periods (Edmunds et al., 1988).
KAL11/4 is the only core to show a surface peak of chloride (~200 mgl-1). Surface peaks in chloride are widely seen in arid and semi-arid environments, where evaporation and transpiration processes actively remove moisture and increase the concentration of solutes (Phillips, 1994; Scanlon, 1991; Stone, 1992). This core site was closest to vegetation, encountering some small rootlets of Stipagrostis amabilis as deep as 3 m, which suggests that the zone above 4 m may represent the mixing zone at this site. The uppermost sample (0.55 m) has a concentration 4 times greater than that at 1.05 m. It has previously been noted that the upper 1 m in dryland profiles can represent a separate zone, or reservoir of chloride within the mixing layer (Cook et al., 1992). This is thought to relate to solutes within occluded pore spaces, which do not contribute to water flowing more freely. This would tend to be measured when using elutriation to extract the pore moisture (via dilution), and has been shown to be present in elutriated samples and absent in sub-samples of the same material for which moisture was extracted simply by centrifugation (Edmunds et al., 1992). However, the neighbouring core (KAL11/3) does not have this peak, which again reflects the variation between profiles, and the absence of absolute replicates of chloride profiles discussed above. In addition, the location is 4 m further from the Stipagrostis amabilis which may be indicative of the localised influence of vegetation. Without more detailed field-based observation, or laboratory-based analysis and testing it is not possible to evaluate the potential influence of unstable wetting fronts and fingered flow (e.g. Hill and Parlange, 1972; Selker et al., 1992). In the experience of WM Edmunds, such features tend to propagate over the top ~50 cm and below this tend to homogenise and approximate piston flow.
The base of KAL11/3 contains a zone of higher chloride concentration below 10.3 m (rising from an average of ~7 mgl-1 to >200 mgl-1 by 11.5 m), starting 1 m above the zone of low moisture (< 1.7%). Neither chloride nor moisture features are seen in the adjacent core (KAL11/4), which is difficult to explain definitively without additional profiles, and again indicates the frequent lack of direct replication in tracer profile studies (Edmunds and Gaye, 1994). It is difficult to explain this profile without additional data from the sediment below that sampled. It is unlikely to be an active capillary fringe in view of the lower moisture contents, but may represent a former incursion, or represent residual geological artefacts (e.g. former surface feature, where water ponded, before further dune accumulation has occurred above). There is a small change in sedimentology with an increase in the silt content from 3% to 9% between 10.3 m to 11.8 m (also reflected in sediment sorting changing from moderately sorted to poorly sorted for the lower 3 samples, at 11.2 m to 11.8 m depth).
By contrast to the Stampriet profiles (KAL11/3 and 11/4) the cores from Region 1 (KAL11/1 and 11/2) both contain a region of higher chloride mid-way down the profile. In KAL11/1 this occurs from 2.1 m to 4.7 m depth, in a broadly higher peak of Cl (concentrations are above 35 mgl-1) and peaking at 65 mgl-1 at 3.1 m depth. In KAL11/2 there is a deeper and more abrupt increase in chloride from 14 mgl-1 to 164 mgl-1between 4.6 m and 5.2 m depth, before returning to lower values (that fluctuate around an average of 50 mgl-1) over the bottom 4 m of the core (Fig. 3b). Again these differences in the chloride-depth profiles between cores reflect the site-to-site differences that are widely observed in other tracer studies. It is again most likely that these peaks again relate to changing chloride inputs that reflect fluctuating climatic conditions (Edmunds et al., 1988).
All 4 cores exhibit a broad inverse trend between pore moisture chloride concentration and sample moisture content of the sample. This is the opposite of the trend observed in Senegal profiles by Gaye and Edmunds (1996), but the same as the trend in profiles from the Chihahuan Desert presented by Scanlon (1991). Many authors have attributed variations in moisture content within cores to variations in sediment texture.
However, in these cores not only is there very little variation in sediment texture, there is no consistent relationship observed between moisture content and textural parameters such as silt component or sediment sorting (in KAL11/1 below the mixing zone, moisture increase tracks a reduction in sediment sorting, and a small increase in silt, whilst in KAL11/2, KAL11/3 and KAL11/4 the reductions in sorting and small increases in silt are not accompanied by unidirectional changes in moisture content).
Recharge rates
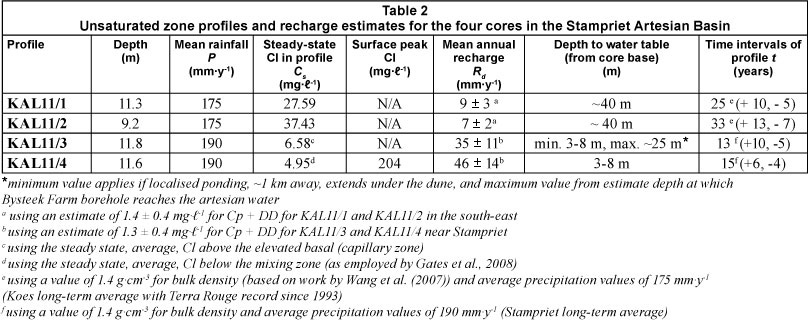
There are as yet no local measurements of rainfall chemistry for the SAB from which to input into Eq. (1) for calculating recharge. The best estimates come from extending the spatial distribution of rainfall chloride compiled for Botswana from an observation network (compiled from long-term regional monitoring and intensive local-scale observations) during the detailed GRES I and GRES II studies (Beekman et al., 1996a; b). For total deposition (C + Cd) a value of between 150 mgm-2y-1 and 350 mg-m-2-y-1 is indicated for the SAB region, with a best estimate for an average input over time of 250 mg-m-2-y-1 (following the approach of De Vries et al., 2000 for the central Kalahari in Botswana). This equates to a chloride concentration in rainfall of 1.4 mgl-1 for the south-east (KAL11/1 and KAL11/3) (with mean rainfall of 175 mmy-1) and 1.3 mgl-1 for Stampriet (KAL11/3 and KAL11/4) (with a mean rainfall of 190 mm-y-1). Conservative error margins of 0.4 mgl-1 are applied to these estimates. These values are very close to the minimum concentration of dune moisture chloride (Cs) measured in the profiles and applying these error margins captures the regional variations observed in the nearby Northern Cape region of South Africa, where sites were monitored between 2003 and 2009 (including measurements for early, peak and dry rainfall season) by Van Wyk et al. (2011), and the value of 2.4 mgl-1 applied by Adams et al. (2004) for the central Namaqualand region of South Africa.
Using the steady-state average of chloride concentrations for the whole profile for each core, recharge rates range from 7 mm-y-1 ± 2 mmy-1 to 46 mm-y-1 ± 14 mmy-1 (Table 2). For KAL11/4 this is based on the steady-state average beneath the mixing zone, interpreted to be influenced by the localised grassy vegetation (exclusion of the mixing as illustrated by Edmunds (2001) and employed by many authors, including Gates et al., 2008). In KAL11/3, the steady-state average is calculated above the capillary zone, to capture solely the USZ. The observed variation in recharge rates between cores is not unusual within a dunefield, or an even smaller region, for example 0.5 km2 near Louga, Senegal (Edmunds and Gaye, 1994).
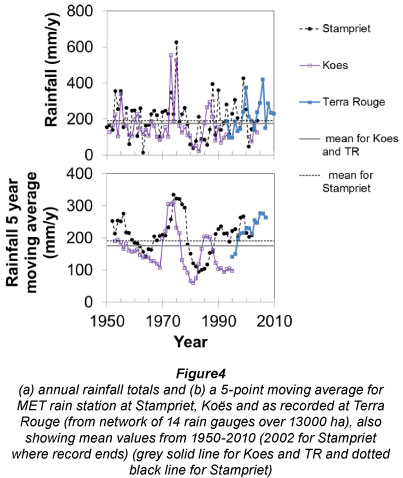
The residence times indicated for moisture in each profile in Table 2 have been calculated using Eq. (2) (Cook et al., 1992; Tyler et al., 1996). These represent 13 to 33 years (Table 2). This covers a period of time in which the mean climate has varied. At Stampriet years with above-average rainfall include 1985, 1990, 1996 and 1999-2000 (record ends in 2002), whilst at Koês and Terra Rouge years of above average rainfall are 1985-1988, 1999-2000, 2004-2006 and 2008-2010 (Fig. 4a). This indicates that there is a high level of inter-annual variability. When a 5-year moving average is considered (Fig. 4b), a wetter phase is suggested from ~1971-1975 (slightly longer at Stampriet than Koês/Terra Rouge), a drier phase during the years ~1976-1985 and a second wetter phase from the late 1990s until 2010. If the main control over chloride depth profiles is climatic (wetter phases leading to lower chloride concentrations, and drier phases leading to enriched chloride concentrations), we would expect to see this reflected in the chloride fluctuations with depth, assuming piston flow.
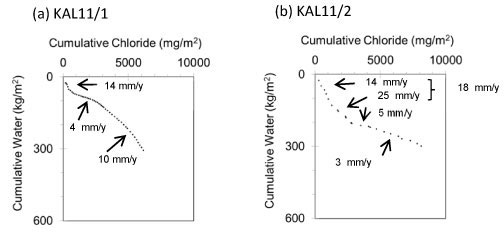
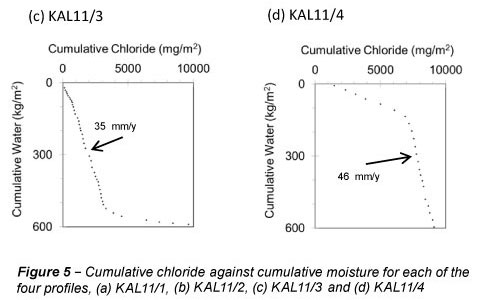
Plots of cumulative chloride concentration against cumulative moisture content for each profile are an effective way to examine the possibility of changing recharge rates and environmental conditions (Allison et al., 1985; Scanlon, 1991; Cook et al., 1992). Cumulative chloride concentration in place of depth makes it possible to factor out variations in moisture content (Allison et al., 1985). Figure 5 indicates that in both KAL11/1 and KAL11/2 an upper region of higher recharge, of 14 mmy-1 and 18 mmy-1, respectively (taking input of chloride to be 1.4 mgl-1), followed by lower recharge of 4 mmy-1 or 5 mmy-1, however without a similar recharge trend at the base, with a higher rate in KAL11/1 than KAL11/2. Considering these profiles (profile ages of 25 years for KAL11/1 and 33 years for KAL11/2) in light of the rainfall record for Koes and Terra Rouge, the upper part may reflect the recent 1990s wet phase, whilst the middle sections may reflect the 8 drier years (19761984) with particularly dry conditions between 1981 and 1984 (annual totals ranging from 20 mmy-1 to 79 mmy-1, around 100 mmy-1 less than the long-term average). The deviation in apparent recharge rates in the lower parts of KAL11/1 and KAL11/2 (10 mmy-1 or 3 mmy-1) is harder to account for. In KAL11/3 and KAL11/4 the comparable higher rates of recharge through the bulk of the profiles is readily apparent (and illustrates the influence of higher concentrations of chloride in the surface mixing zone, and basal zone on the slope of the line in these plots) (Fig. 5c, d). A period of high recharge over the past decade's worth of these profiles makes sense in light of the relatively high rainfall experienced over the SAB since the late 1990s (Fig. 4).
Comparison with other chloride mass balance recharge estimates in the southern Kalahari
The profiles therefore record evidence that significant direct recharge from rainfall is occurring through these dunes, with long-term average values for profiles ranging from 7 mmy-1 to 46 mmy-1. There are no other estimates for direct recharge through the USZ using the CMB methodology above the SAB with which to compare these estimates; however, work has been done in the eastern Kalahari in Botswana (reported by Beekman et al., 1996b; Selaolo, 1998; De Vries et al., 2000). De Vries et al. (2000) used a subset of these profiles to conclude that the spatial pattern of recharge via direct pathway was only ~5mmy-1 in the eastern fringes and ~ lmm-y-1 in the centre of the Kalahari. However, the 10 profiles from the Letlhakeng-Bothapatlou area of Botswana considered by Selaolo (1998) contain a similar range of recharge estimates as found here for the SAB (0.8 mmy-1 to 33.8 mmy-1). The 10 profiles covered a range of geomorphological settings, including high areas (presumed to be on the surface of dunes), palaeo-valleys and the floor of a pan (where the highest recharge rate was calculated). In addition, it was suggested that the recharge mechanism is compounded by preferential flow (up to 90% might be preferential in some profiles) (Selaolo, 1998; De Vries et al., 2000). In contrast to the Botswana sites, the 4 SAB cores sampled here consisted of sand cover without the complication of dual porosity; we did not encounter calcrete layers or variations in sediment texture that were found in eastern Botswana. There are, however, limitations to these provisional estimates of recharge relating to spatial variability (Edmunds and Gaye, 1994).
Comparison with other recharge rates estimated from other methods for the Stampriet Basin
Other estimates for recharge for the SAB (and predominantly for the Kalahari Aquifer) come from CMB work using the saturated zone (JICA, 2002). This uses the chloride concentration in the saturated zone from groundwater itself (C ) in Eq. (1), instead of Cs (chloride content of soil). From the boreholes measured, a map of recharge distribution, created by JICA (2002) suggests values of 0 mmy-1 to 1 mmy-1 in the southern part of the basin and 1 mmy-1 to 2 mmy-1 (with patches of 2 mmy-1 to 5 mmy-1) in the northern part of the basin. We note here that the use of CMB in the saturated zone is complicated by the fact that the groundwater-chloride concentrations are almost certainly a mixed signature from the unsaturated zone inputs and from any lateral flow of groundwater in the basin (in this case lateral flow from NW to SE in the confined Auob Aquifer, following the piezometric surface), which may relate to different input times and conditions. Saturated zone values can provide minimum recharge values, but true present-day values will almost certainly be higher due to geological inputs (evaporite dissolution, mixing with older formation waters, etc.). Any geological inputs via the USZ on the other hand are immediately recognisable through sustained higher chloride signatures with depth.
In addition, isotopes of oxygen and hydrogen from borehole groundwater were analysed by JICA (2002) and compared to a local meteoric water line, which gave a crude estimate of 2 mmy-1 to 7 mmy-1. However, it was noted that the isotopic signatures in groundwater are not straightforward, with kinetic effects and non-equilibrium enrichment. 'JICA (2002) also looked directly at groundwater levels in boreholes (mainly into the confines Auob aquifer unit), and saw an increase (of up to 50 cm) after the exceptional 1999-2000 rainy season; whilst in other years (considered by JICA (2002) to be average years) drawdown of ~5 cm was observed. Any measurements from water levels must also account for abstraction rates, and factor these in to convert this information into data about recharge rates.
Results for the USZ recharge in the Stampriet Basin are in line with the recharge estimates using chloride (and other isotopic tracers) in other semi-arid regions. For example, in Senegal the long-term average recharge near Louga was estimated to be 30 mmy-1 (~10% of the average precipitation of 290 mmy-1) (Gaye and Edmunds, 1996). In the Manga Grasslands of Nigeria the recharge rate was estimated to be 44 mmy-1, whilst the regional pattern for NE Nigeria was even higher (60 mm- y-1), where mean annual rainfall is 434 mmy-1 (Edmunds et al., 1999). Scanlon et al. (2006) reviews applications of CMB to semi-arid areas, which illustrate a range of recharge rates calculated from sand-rich profiles. The lowest value is 0.06 mm-y-1 (in a region covered by Mallee vegetation, Allison et al., 1990), whilst in less vegetated areas magnitudes range from 1 mm-y-1 to 94 mm-y-1. By comparison, recharge rates in clay-rich sands are 0.5 mm-y-1 to 24 mm-y-1; volcanic alluvium < 0.01 mm-y-1 to 9.9 mm-y-1; streams 41 mm-y-1 to 91 mm-y-1; and interfluvial areas 0.3 mmy-1 to 5.8 mm-y-1.
Contribution of direct recharge to groundwater
The finding that recent recharge rates are between 7 mmy-1 and 46 mm-y-1 (or between ~4% and 20% of average rainfall) through the superficial Kalahari sand dune cover suggests direct drainage into the Kalahari Aquifer underlying the dunes (although there may be small areas where the Kalahari beds have been eroded down to the Upper Rietmond Member, Fig. 2). The calcrete that is known to underlie the Kalahari beds in many places is karstified, as are the interbedded congolomerates and other calcretes, with good examples of sinkholes in the former where it is exposed on the Wiessrand and above the Kalkrand Basalt (Christelis and Struckmeier, 2001; Tredoux et al., 2002). It is suggested here that the calcrete layer may be similarly weathered and eroded (and not necessarily continuous) between the superficial sand dune cover and the Kalahari beds. This provides hydraulic continuity with the Kalahari Aquifer through the dune cover. This provides the first evidence to support the inference identified by Tredoux et al. (2002), on the basis of water-table fluctuations, that recharge mechanisms other than focused recharge through the Weissrand calcrete sinkholes have to be in operation in different parts of the basin, and particularly where the sand cover thickens. From the provisional estimates made here it can be suggested that comparable recharge rates are occurring for the vast (~80%) portion of the basin that is covered in dune sand, although it is not possible to ascertain to what extent this would only recharge the Kalahari Aquifer level, or also feed to some extent into the artesian layers. Despite the detailed reinterpretation of the geology of the region, the potential, and extent of, hydraulic connection between the unconfined Kalahari Aquifer and the confined Auob Aquifer is incompletely understood, with Tredoux et al. (2002) suggesting potential connectivity through geological faults, but highlighting the importance of recharge in the north-western and western regions where the Auob beds outcrop on the Weissrand.
Therefore, the direct recharge rates calculated here are most relevant for the unconfined Kalahari Aquifer and are an important indicator toward the assessment of the amount of renewable resource in the region, and should be considered in any future assessments of the water balance in the region. A hydrocensus in 2000 carried out by DWAF (Namibian Department of Water Affairs) and JICA illustrated that 3 915 of 4 915 boreholes tap the Kalahari Aquifer, and that 65.5% of the total abstracted water in the SAB comes from the Kalahari Aquifer, with a rate from the Kalahari Aquifer of ~9.8 x10⁶ m3y-1 (DWAF/JICA, 2000). That JICA (2002) study also concluded that present abstraction was exceeding estimates of recharge, implying that current use was unsustainable. The major use of water in the SAB is irrigation (46% of annual abstraction), with 38% being used for stock watering and just 16% for domestic use. A groundwater simulation model suggests that it would take >50% reduction in irrigation uses in the Stampriet Town region to stabilise current groundwater levels, and that if present extraction rates are continued the resource could dry up by 2026 (JICA, 2002). Schwartz (2006) has simulated the water balance of unsaturated soils and unconsolidated sediments across Namibia using UNSAT-H, HELP3 and MACRO4.3 to estimate pore-water residence time as a tool for inferring the intrinsic vulnerability of the aquifer. The SAB USZ estimates for pore-moisture age produced here for the 12 m depth of dunes allows a comparison with calculations made by Schwartz (2006) for sand (Schwartz's Unit Type 4), and suggests that his estimates of 200 year to >500 year residence times for the USZ may be an overestimate. It is recommended that further ground-truthing work is needed to close the gap between modelling and field approaches.
Conclusion
Direct recharge through the Kalahari dune unsaturated zone (uppermost part of the unsaturated zone) is shown for the first time to be significant for the Stampriet Basin through the first application of the chloride mass balance approach.
This indicates potentially substantial recharge of between 7 mmy-1 and 46 mmy-1 for the 4 studied dune profiles (9 m to 11.5 m in depth), representing conditions over the past 13 to 33 years. The cores come from 2 regions of the basin, with 2 cores from dunes in the south-western portion (between Koes and Mata-Mata) and neighbouring cores taken from a dune just east of Stampriet in the central part of the basin. The level of variability in recharge rates between these 4 cores accords with the spatial variability observed using this technique in many other semi-arid region unsaturated zones across the world (see those reviewed in Scanlon et al., 2006). The chloride mass balance technique in the unsaturated zone has the potential to further constrain the spatial variability of (and the potential influence of different geomorphological conditions on) recharge rates and calculate a regional average recharge rate for a wider portion of this basin. This methodology will provide insights into regions of the basin, especially those parts with sand cover, for which very little is known about recharge, or is possible to determine using conventional water balance approaches. Building on these reconnaissance profiles we plan to sample at other sites to make an assessment of the regional-scale recharge pattern and potential variation in different geomorphological settings and under different levels of vegetation cover. This will also allow us to be able to compare the results obtained during different years of sampling, noting the high levels of precipitation before sampling in 2011.
Investigations into the direct recharge mechanism, such as this, are a vital part of improving our understanding of the water balance of the multi-layer Stampriet Basin, and being able to assess the sustainability of the groundwater resource. The direct recharge mechanism is particularly relevant for the uppermost layer, the Kalahari Aquifer, which is overlain by dunefield sands in ~80% of the basin. Recharge rates should also be calculated through the sand cover in the interdune areas as part of this continuing research. This research is important, not least because it is the Kalahari Aquifer that is most heavily utilised for water, with an estimated 66% of abstraction from this layer of the aquifer (JICA, 2002), and with regional variation in the proportion of water abstracted from the different levels; this results in an even greater importance of the Kalahari Aquifer in some regions. The research findings presented here complement the recent developments in the understanding of recharge to the artesian Auob Aquifer in the north-western and western portions of the basin via karst features and fault structures (Tredoux et al., 2002). A combination of these approaches allows us to continue to address the challenge of constraining recharge mechanisms in this important transboundary basin.
Acknowledgements
This research is supported by the Royal Geographical Society, Thesiger-Oman International Fellowship, and research grant from the British Society for Geomorphology. The research was carried out under research/collecting permit 1524/2010, issued by the Ministry of Environment and Tourism, Namibia, to whom the authors are grateful. AECS would like to thank Greg Christelis for his interest in this research and discussions about the Stampriet Artesian Basin. Pieter Möller and the De Waal family are thanked for their permission to take samples on their land and for their hospitality. Professor David Thomas is thanked for his academic support and assistance in the field, Dr Christine Lane for field assistance, and Dr Mona Edwards for her support in the laboratory.
References
ADAMS S, TITUS R and XU Y (2004) Groundwater Recharge Assessment of the Basement Aquifers of Central Namaqualand. WRC Report No. 1093/1/04. Water Research Commission, Pretoria, South Africa. [ Links ]
ALLISON GB (1988) A review of some of the physical, chemical and isotopic techniques available for estimating groundwater recharge. In: Simmers I (ed.) Estimation of Natural Groundwater Recharge. D Reidel Publishing Co., Dordrecht. 49-72. [ Links ]
ALLISON GB and HUGHES MW (1978) The use of environmental tritium and chloride to estimate total recharge to an unconfined aquifer. Aust. J. Soil Sci. 16 181-195. [ Links ]
ALLISON GB, STONE WJ and HUGHES MW (1985) Recharge in karst and dune elements of a semi-arid landscape as indicated by natural isotopes and chloride. J. Hydrol. 76 1-26. [ Links ]
ALLISON GB, COOKE PG, BARNETT SR, WALKER GR, JOLLY IG and HUGHES MW (1990) Land clearance and river salinisation in the western Murray Basin, Australia. J. Hydrol. 119 1-20. [ Links ]
BEEKMAN HE, GIESKE A and SELAOLO ET (1996a) GRES - groundwater recharge studies in Botswana (1987-1996). Botswana J. Earth Sci. III 1-17. [ Links ]
BEEKMAN HE, GIESKE A and SELAOLO ET (1996b) Groundwater recharge at the fringe of the Kalahari - the Letlhakeng-Botlha- patlou area. Botswana J. Earth Sci. III 19-23. [ Links ]
BLACK CA (1965) Methods of Soil Analysis: Part I Physical and Mineralogical Properties. American Society of Agronomy, Madison, Wisconsin, USA. [ Links ]
BLOTT SJ and PYE K (2000) GRADISTAT: a grain size distribution and statistics package for the analysis of unconsolidated sediments. Earth Surf. Process. Landforms 26 1237-1248. [ Links ]
BOOCOCK C and VAN STRATEN OJ (1962) Notes on the geology and hydrology of the Central Kalahari region, Bechuanaland Prot. Trans. Geol. Soc. S. Afr. 65 125-171. [ Links ]
CHRISTELIS GM and STRUCKMEIER W (2001) Groundwater in Namibia, an Explanation of the Hydrogeological Map. Windhoek, Namibia, Ministry of Agriculture, Water and Rural Development. 128 pp. [ Links ]
COOK PG, WALKER GR and JOLLY ID (1989) Spatial variability of groundwater recharge in a semiarid region. J. Hydrol. 111 195-212. [ Links ]
COOK PG, EDMUNDS WM and GAYE CB (1992) Estimating palaeorecharge and palaeoclimate from unsaturated zone profiles. Water Resour. Res. 28 2721-2731. [ Links ]
DE VRIES JJ (1984) Holocene depletion and active recharge of the Kalahari groundwaters - a review and an indicative model. J. Hydrol. 70 221-232. [ Links ]
DE VRIES JJ, SELAOLO ET and BEEKMAN HE (2000) Groundwater recharge in the Kalahari, with reference to paleo-hydrologic conditions. J. Hydrol. 238 110-123. [ Links ]
EDMUNDS WM (2001) Investigations of the unsaturated zone in semi-arid regions using isotopic and chemical methods and applications to water resource problems. In: Isotope-Based Assessment of Groundwater Renewal in Water-Scarce Regions. Tecdoc-1246. IAEA, Vienna, Austria. 7-22. [ Links ]
EDMUNDS WM and GAYE CB (1994) Estimating the variability of groundwater recharge in the Sahel using chloride. J. Hydrol. 156 47-59. [ Links ]
EDMUNDS WM, DARLING WG and KINNIBURGH DG (1988) Solute profile techniques for recharge estimation in semi-arid and arid terrain. In: Simmers I (ed.) Estimation of Natural Groundwater Recharge. Reidel Publishing Co, Higham, MA. 139-157. [ Links ]
EDMUNDS WM, GAYE CB and FONTES J-Ch (1992) A record of climatic and environmental change contained in interstitial waters from the unsaturated zone of northern Senegal. Proc. IAEA Symp. on Isotope Techniques in Water Resources Development 1991. Vienna. 533-549. [ Links ]
EDMUNDS WM, FELLMAN E and GONI IB (1999) Lakes, ground-water and palaeohydrology in the Sahel of NE Nigeria: evidence from hydrogeochemistry. J. Geol. Soc. 156 345-355. [ Links ]
FOLK RL and WARD WC (1957) Brazos River Bar: a study in the significance of grain size parameters. J. Sed. Pet. 27 (2) 3-26. [ Links ]
FOSTER SSD, BATH AH, FARR JL and LEWIS WJ (1982) The likelihood of active groundwater recharge in the Botswana Kalahari. J. Hydrol. 55 113-136. [ Links ]
GATES JB, EDMUNDS WM, MA J and SCANLON BR (2008) Estimating groundwater recharge in a cold desert environment in northern China using chloride. Hydrogeol. J. 55 113-136. [ Links ]
GAYE CB and EDMUNDS WM (1996) Groundwater recharge estimation using chloride, stable isotopes and tritium profiles in the sands of northwestern Senegal. Environ. Geol. 27 246-251. [ Links ]
GIESKE A (1992) Dynamics of Groundwater Recharge - A Case Study in Semi-Arid Eastern Botswana. Ph.D. Thesis. Vrije Universiteit Amsterdam, The Netherlands. pp 290. [ Links ]
GIESKE A, SELAOLO ET and BEEKMAN HE (1995) Tracer interpretation of moisture transport in a Kalahari sand profile. Proc. Int. IAEA and IAHS Symp. on Application of Tracers in Arid Zone Hydrology. 22-26 August 1994, Vienna. 373-382. [ Links ]
HEATH DC (1972) The geology of the Karoo System in the area Mariental - Asab, South-West Africa. Mem. S. Afr. Geol. Surv. 61 44. [ Links ]
HILL DE and PARLANGE JY (1992) Wetting front instability in layered soils. Soil Sci. Am. Proc. 36 679-702. [ Links ]
JICA STUDY TEAM (2002) The Study on the Groundwater Potential Evaluation and Management Plan in the Southeast Kalahari (Stampriet) Artesian Basin in the Republic of Namibia. Draft Final Report, to the Department of Water Affairs, Ministry of Agriculture, Water and Rural Development, Republic of Namibia, submitted by Pacific Consultants International, in association with Sanyu Consultants Inc., Tokyo. [ Links ]
KIRCHNER J (2012) Personal communication, via review of paper and email, 14 March, 2012. Prof. J Kirchner, President of Namibian Hydrogeological Association, P.O. Box 86774, Windhoek, Namibia. [ Links ]
KIRCHNER J, TREDOUX G, WIERING AA and CHRISTELIS G (2002) The IAEA Stampriet Artesian Basin Recharge Project. Geohydrology/DWA and CSIR/Windhoek: Report for IAEA. 66 pp and 6 Appendices. [ Links ]
MARTIN H (1961) Hydrology and water balance of some regions covered by Kalahari sands in south west Africa. Proc. Inter-African Conference on Hydrology. Nairobi. CCTA Publ. No. 66. 450-457. [ Links ]
MARTIN H (1962) Das artesische Becken der Südkalahari. Proc. Conference Wissenschaftliche Forschung in Südwestafrika, 21-23 April 1962 S.W.A. Scient. Soc., Windhoek, Namibia. 87-98. [ Links ]
MILLER RMcG (2000) The Geology of the Stampriet Artesian Basin. Report submitted to Pacific Consultants International, Windhoek, Namibia. [ Links ]
MILLER RMcG (2008) The Geology of Namibia. Volume 3. Geological Survey of Namibia, Windhoek. [ Links ]
PHILLIPS FM (1994) Environmental tracers for water movement in desert soils of the American southwest. Soil Sci. Soc. Am. J. 58 14-24. [ Links ]
RANGE P (1914) Das artesische Becken in der Südkalahari. Dtsch. Kolon. Blatt 8 368-370. [ Links ]
SCANLON BR (1991) Evaluation of moisture flux from chloride data in desert soils. J. Hydrol. 128 137-156. [ Links ]
SCANLON BR (2000) Uncertainties in estimating water fluxes and residence times using environmental tracers in an arid unsaturated zone. Water Resour. Res. 36 395-409. [ Links ]
SCANLON BR, KEESE KE, FLINT AL, FLINT LE, GAYE CB, EDMUNDS WM and SIMMERS I (2006) Global synthesis of groundwater recharge in semi-arid and arid regions. Hydrol. Process. 20 3335-3370. [ Links ]
SCHWARTZ MO (2006) Numerical modelling of groundwater vulnerability: the example Namibia. Environ. Geol. 50 237-249. [ Links ]
SELAOLO ET (1998) Tracer Studies and Groundwater Recharge Assessment in the Eastern Fringes of the Botwana Kalahari: The Letlhakeng-Botlhapatlou Area. Ph.D. Thesis, Vrije Universitat Amsterdam, The Netherlands. 229 pp. [ Links ]
SELAOLO ET, BEEKMAN HE and DEVRIES JJ (1995) Palaeorecharge deduced from chloride and isotope profiles at the eastern fringe of the Botswana Kalahari. Proc. Conf. Groundwater Recharge and Rural Water Supply, 26-28 Sept 1995, Midrand, South Africa. 6. [ Links ]
SELKER J LECLERQ P PARLANGE JY and STEENHUIS T (1992) Fingered flow in two dimensions: 1 measurement of matric potential. Water Resour. Res. 28 (9) 2513-2521. [ Links ]
SHARMA ML and HUGHES MW (1985) Groundwater recharge estimation using chloride, deuterium and oxygen-18 profiles in the deep coastal sands of western Australia. J. Hydrol. 81 93-109. [ Links ]
SCHALK K (1961) The water balance of the Uhlenhorst cloudburst in South West Africa. Proc. Inter-African Conference on Hydrology. Nairobi. CCTA Publ. No. 66. 443-449. [ Links ]
STONE AEC and THOMAS DSG (2008) Linear dune accumulation chronologies from the southwest Kalahari, Namibia: challenge of reconstructing Late Quaternary palaeoenvironments from Aeolian landforms. Quat. Sci. Rev. 27 1667-1681. [ Links ]
STONE WJ (1992) Paleohydrologic implications of some deep soil water chloride profiles, Murray Basin, South Australia. J. Hydrol. 132 201-223. [ Links ]
TANDIA AA (1990) Revue critique des methodes d'evaluation de la recharge des nappes. Contribution de l'approche geochimique et isotopique, Louga-Nord Senegal. Theseme cycle. University of Dakar, Dakar. 138 pp. [ Links ]
TREDOUX G, KIRCHNER J, MILLER R McG, YAMASAKI Y, CHRISTELIS GM and WIERENGA A (2002) Redefining the recharge behaviour of the Stampriet Artestian Basin, Namibia. Proc. IAH Conference on Balancing the Groundwater Budget. 12-17 May 2002, Darwin, Australia. [ Links ]
TYLER S, CHAPMAN JB, CONRAD SH, HAMMERMEISTER DP, BLOUT DO, MILLER JJ, SULLY MJ and GINANNI JM (1996) Soil water flux in the southern Great Basin, United States: Temporal and spatial variations over the last 120,000 years. Water Resour. Res. 32 (6) 1481-1499. [ Links ]
VAN WYK E, VAN TONDER GJ and VERMEULEN D (2011) Characteristics of local groundwater recharge cycles in South African semi-arid hard rock terrains - rainwater input. Water SA 37 (2) 147-154. [ Links ]
VAN WYK W (2012) Characteristics of rainwater-groundwater interactions in semi-arid hard rock terrains. Paper presented at International Conference on Groundwater: Our source of security in an uncertain future, GWD/GSSA, IAH, 19-21 September 2011, Pretoria. [ Links ]
WANG L, D'ODORICO P, RINGROSE S, COETZEE S and MACKO SA (2007) Biogeochemistry of Kalahari sands. J. Arid Environ. 71 259-279. [ Links ]
This paper was originally presented at the International Conference on Groundwater: Our Source of Security in an Uncertain Future, Pretoria, 19-21 September 2011.
* To whom all correspondence should be addressed. +44(0)1865 285070; fax: +44(0)1865 275885 E-mail: abigail.stone@ouce.ox.ac.uk and historical, recharge rates through a range of identified mechanisms.

