


Services on Demand
Article
 English (pdf)
 Article in xml format
 Article references
Indicators

Related links
-
 Cited by Google
 -
 Similars in Google
Share

 Permalink
Water SA
On-line version ISSN 1816-7950
Print version ISSN 0378-4738
Water SA vol.38 n.2 Pretoria Jan. 2012
ARTICLES
Monetary valuation of salinity impacts and microbial pollution in the Olifants Water Management Area, South Africa
WJ de LangeI, *; BK MahumaniI; M SteynI; SHH OelofseII
ICSIR, Natural Resources and the Environment, PO Box 320, Stellenbosch, 7599, South Africa
IICSIR, Natural Resources and the Environment, PO Box 395, Pretoria, 0001, South Africa
ABSTRACT
This paper estimates costs associated with water pollution in the Olifants River Water Management Area (WMA) in South Africa, and, more specifically, the area represented by the Loskop Dam Water User Association. We focus on the impacts of salinisation on commercial irrigated agriculture, and of microbial pollution on the general population of the WMA, many of whom do not have access to municipal water and sanitation services, leaving them vulnerable to microbial pollution in the water resource. Costs associated with salinity are estimates based on the impacts of increased salinity on the value of marginal product of certain irrigated crops. Costs associated with microbial pollution are estimated based on the direct and indirect costs of human health impacts as a result of microbial pollution in the study area. These monetary value estimates give an indication of the magnitude of the cost of water pollution to society in the WMA. It is concluded that the once-off cost required to provide some pollution prevention infrastructure will be lower than the current annual cost burden of pollution on society in the WMA, and that pollution prevention is therefore cost effective.
Keywords: water pollution, costs, agriculture, society, pollution prevention
Introduction
Polluted water impacts negatively on agriculture, industry, human health, living organisms, resource quality and property (DWAF, 1998), by rendering the resource less fit for beneficial use by downstream users. The effects of polluted water on a country's economy could be disastrous. This paper attempts to estimate the monetary value of the impact of water pollution in the Olifants Water Management Area of South Africa, focusing on salinity impacts and microbial pollution. The impact of increased salinity on commercial irrigated crops was assessed in terms of the decrease in the value of marginal product (VMP) of irrigation water as used by these crops. The impact of microbial pollution on human health was estimated using a cost of illness (COI) approach consisting of direct and indirect cost estimates. Some of the main reasons for monetary estimates of the impacts of water pollution include: (i) raising awareness in order to convince politicians, community leaders and health administrators that a pollution problem of significant magnitude exists, and to encourage them to engage in preventative strategies, (ii) serving as an input for priority setting in water pollution management decision-making, and (iii) analysing the cost-effectiveness of water pollution interventions.
This paper forms part of a solicited research study funded by the Water Research Commission of South Africa. The overall aim of the study was to inform policy and future research targeted at mitigating the challenge of water pollution in the water management area. The hypothesis that was tested focused on the notion that pollution prevention is better than cure; however, unnecessarily strict regulation could have negative consequences for the economy. The general aim of this research was therefore to compare the costs associated with a regime which controls pollution at source, thereby preventing its occurance with costs associated with a regime which focuses more on treatment before extraction, while allowing the occurance and consequences of water pollution. A suitable study area for the valuation of the cost impact of salinisation on commercial irrigated agriculture was identified in the Olifants River Water Management Area (WMA), more specifically, the area respre-sented by the Loskop Dam Water User Association. In addition, a significant portion of the population in this WMA does not have access to municipal water and sanitation services, leaving them vulnerable to microbial pollution in the water resource.
Pollution of water resources in the study area
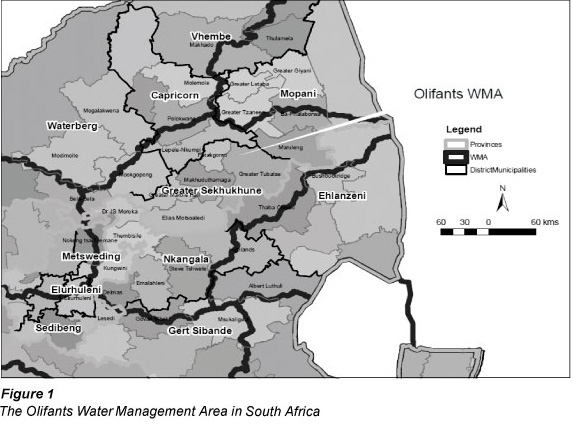
The Olifants WMA (Fig. 1) corresponds with the South African portion of the Olifants River catchment and includes portions of Gauteng, Mpumalanga and Limpopo provinces (DWAF, 2004). The WMA covers an area of 54 562 km2 and is home to approximately 3.2 million people living in urban to peri-urban areas. The economy of the area consists of mining, electricity generation, metallurgic industries, and agriculture. It generates approximately 5% of the gross domestic product (GDP) of South Africa (DWAF, 2004).
Salinisation of irrigation water is a major contributing factor to soil degradation, which affects commercial and subsistence agriculture (and hence food security) directly (Aihoon et al., 1997, Armour, 2007). Salinity is regarded as a major contributor to water pollution, not only in the study area, but throughout South Africa (DWAF, 2001). Although progress has been made towards implementing the 'polluter pays' principle among mines, industry and domestic users; the case of agriculture generally remains unresolved because of the large number of dispersed sources (non-point sources), which renders traceability difficult (Aihoon et al., 1997; Armour, 2007; Viljoen and Armour, 2002; Armour, 2002). Dilution effects add to this problem, implying that the quantification of salinity impacts and the assessment of costs associated with salinisation is time consuming and expensive.
The microbial pollution of water resources increases the risk of contracting waterborne diseases such as diarrhoea, cholera, salmonellosis and typhoid fever (DWAF, 2001). A direct functional relationship exists between dysfunctional water and sanitation systems and a high risk of waterborne disease (Hinrichsen et al., 1997; Montgomery and Elimelech, 2007). This relationship is especially evident in the study area. Diarrhoea, in particular, is considered to be the third leading cause of death in children under the age of 5 in South Africa (Bradshaw et al., 2003). Furthermore, it is estimated that in South Africa 84% of all deaths due to diarrhoea are attributable to unsafe water, sanitation and hygiene (Lewin et al., 2007). This makes microbial water pollution an environmental risk factor of national importance, which justifies our focus on this problem.
Methods and data inputs
Different approaches were employed to estimate the monetary value of the impacts of salinisation and microbial pollution in water resources in the study area. These methods are discussed separately below.
Salinisation of irrigation water
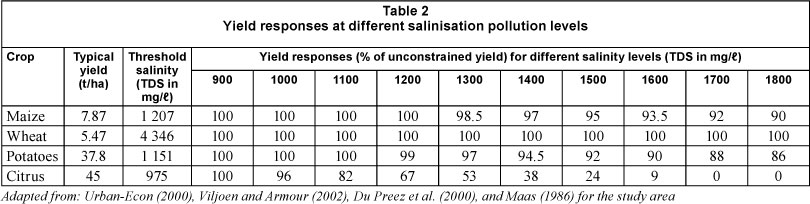
The monetary value of the impact of increased salinity was modelled in terms of expected decreases in production value of selected crops, ceteris paribus. A marginal value based analysis framework was employed for the valuation, because of the diminishing marginal utility of water use in agriculture (Hassan and Farolfi, 2005; Lange and Hassan, 2006; Young, 2004). The functional relationship between water salinity and crop yield (based on field trials) was used to create crop production functions at different levels of water salinity. These crop production functions were used to derive water productivity curves and to calculate the value of marginal product (VMP) of irrigation water for different salinity levels. The VMP of water for crops can thus be defined as the loss of income based on incremental increases in salinity levels of irrigation water used by the particular crop (Nieuwoudt et al., 2004). It should be noted that plant responses to salinity cannot be predicted on an absolute basis, but rather on a relative basis, based on general salt tolerance guidelines (Maas, 1986). Most commercial crops can maintain yield up to a certain salinity threshold, beyond which a linear or exponential decrease in yield is observed. These thresholds have been thoroughly researched for different crops and regions (Urban-Econ, 2000; Viljoen and Armour, 2002; Du Preez et al., 2000), and are presented in Table 1.
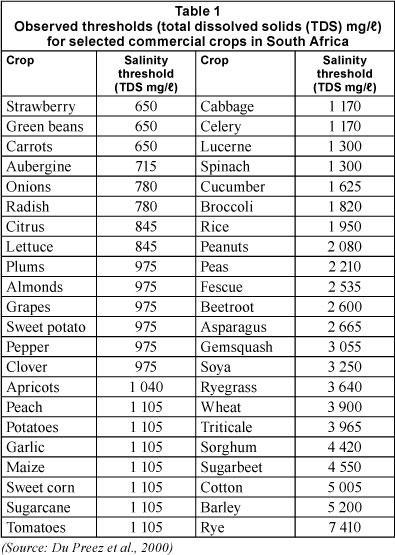
Four irrigated crops with known salinity-yield relationships (i.e. the salinity threshold and rate of decline in yield beyond the threshold has been confirmed in field trials) were selected from Table 1 and used as representative crops to estimate the impact of increased salinity on VMP of irrigation water in the study area (Aihoon et al., 1997; Maas et al., 1983; Maas, 1986; Armour, 2007; Armour and Viljoen, 2000; Viljoen and Armour, 2002). Table 2 presents a summary input table for the salinty-yield relationships as employed in the VMP estimates. Crop coverage was verified with data from Statistics South Africa (Statistics South Africa, 2002).
The average maximum allowable salinity of irrigation water for the study area is 1 700 mg/ℓ TDS, while the recommended operational salinity limit for the representative crops is considered to be a maximum of 1 000 mg/ℓ TDS (Ferreira, 2009). These specifications implied a salinity range from 900 mg/ℓ TDS (100 mg/ℓ TDS below the recommended operational salinity limit) up to 1 800 mg/ℓ TDS (100 mg/ℓ TDS above the maximum allowable water salinity); these values were used as the lower and upper thresholds for the modelling runs. Field trial data were applied to salinity levels for the study area and consequently modelled to estimate the associated loss in typical farm income per 100 mg/ℓ increment in TDS, starting from the salinity threshold for each crop. A critical assumption was that the salinity of irrigation water is directly proportional to the salinity of the saturated soil (which is not always the case). Representative crop budgets and current market prices (Western Cape Department of Agriculture, 2006; Van Zyl, 2009; Deciduous Fruit Producers Trust, 2008) were used to calculate the impact of salinity on the VMP of irrigation water for incremental increases in salinity. Table 3 summarises the crop budget input data as used in this study. Values were inflated against the producer price index (7.78%) for maize, wheat and citrus, while current prices were available for potatoes.
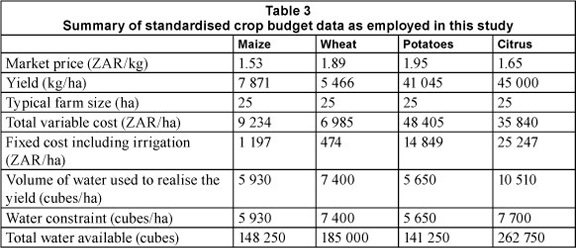
SAPWAT (South African procedure for estimating irrigation water requirements) (Crosby, 1996; Van Heerden et al., 2008) simulations were employed to confirm the water requirement per crop per hectare per year (Table 4). A water constraint of 7 700 m3-ha-1-yr-1 (Ferreira, 2009) was used.
The data were used to develop an input matrix for a linear programming (LP) model (Jabeen et al., 2006), bearing an objective function and associated constraint functions. A total of 25 simulations were run to cover all the different crop and water pollution combinations for the study area. Area cultivated was not allowed to increase or decrease due to the effect of salinity. Furthermore, no allowance for leaching was made (it is a water-stressed area) while input and produce prices were assumed to remain constant for each run. The optimised solutions for the selected crops are presented in the 'results and discussion' section.
Microbial pollution of drinking water
The occurrence of water pollution related diseases is attributable to various environmental risk factors, which implies that traceability of attributable risk factors at the level of an individual is lost (Pruss-Ustun et al., 2003). However, the ability to attribute a disease to a particular environmental exposure becomes possible when individuals are grouped together in controlled experimental trials. This can be attributed to the difference in the morbidity and/or mortality impacts between the experimental and the control group, which represents the burden of disease. According to Pruss-Ustun et al. (2003), this is one of the fundamental concepts underlying burden of disease assessments, which involve the idea of attribution and causal inference by using population groups. Although such data do not distinguish between individuals who fell ill due to exposure to the factor and those who fell ill from other causes, the data can be used to deduce the fraction of the total burden of disease in the population that could have been avoided if the exposure had not occurred. This is a meaningful component of a preventative argument against the risk factor.
Although contingent valuation (Ciriacy-Wantrup, 1947; Davis, 1963) and averting behaviour (Bartik, 1988; Courant and Porter, 1981; Goudge et al., 2009) approaches have been used to value the impacts of waterborne diseases in other studies, a cost of illness (COI) approach was used in this study to facilitate more accurate cross-country comparisons. The COI approach attempts to measure benefits of pollution prevention and/or reduction by estimating the direct and indirect opportunity costs associated with an illness (Pegram et al., 1998). It was thus necessary to determine the level of access to water supply and sanitation in the study area; two categories emerged:
- Above RDP (Reconstruction and Development Programme) water and sanitation standards - a reliable supply of water and sanitation inside the house
- Below RDP water and sanitation standards - no access to safe water and sanitation within a radius of 200 m from the dwelling
The above-mentioned distinction was necessary to reflect the potential difference in diarrhoea incidence rates from varying levels of access to water supply and sanitation. Table 5 summarises water supply categories, diarrhoea incidence and death rates for the different age groups living in the study area.
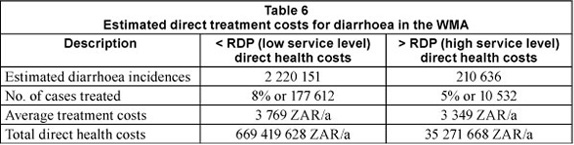
Based on the incidence-to-population ratio, it was assumed that each person within the study area would have at least 1 diarrhoea episode per year. The highest incidence rate was 2.5 episodes per child for children under the age of 5 years for the population with below-RDP standards of water supply and sanitation. This is a very conservative figure since Wright et al. (2006) found that children in rural areas of Limpopo province had up to 7.2 diarrhoea episodes per year. Furthermore, only a small percentage of the total diarrhoea cases require formal treatment, as the majority of incidences are mild and can usually be treated at home, and are thus not recorded. It is estimated that 8% of all diarrhoea cases for people living with below-RDP standards for water supply and sanitation, require treatment, whereas 5% of cases for those who live with above-RDP service standards require treatment (DWAF, 2001).
The actual direct health-care costs per treatment were taken from a Department of Water Affairs and Forestry (DWAF, 2001) study, which estimated this cost at a value of ZAR1 904 per treatment for people with access to below-RDP standard services and ZAR1 692 per treatment for cases where above-RDP standard services are available (these figures were inflated to ZAR3 769 and ZAR3 349, respectively, to allow for comparison with 2010 values, see Table 6).
Indirect cost estimates were based on the monetary value of the decrease in the productivity of human capital due to the burden of disease. This was based on a composite measure of burden of disease, known as the disability-adjusted life year (DALY) (Mathers et al., 2007; WHO, 2010), and the foregone gross income as a result of the burden of disease.
Prevention and control of diseases requires information about the causes and impacts of the disease. Generating such information is sometimes hampered by the lack of common protocol and standardised methods to assess the burden of disease. However, Murray and Lopez (1996) provide a standardised approach to epidemiological assessment which employs the DALY. The DALY is an indicator of the overall burden of disease, combining a measure of both mortality (years of life lost due to premature death) and morbidity (years of 'healthy' life lost as determined by the severity and duration of illness or disability). The following presents the basic formula used to calculate the DALY:
DALY = Years of life lost (YLL) + Years lived with disability ( YLD)
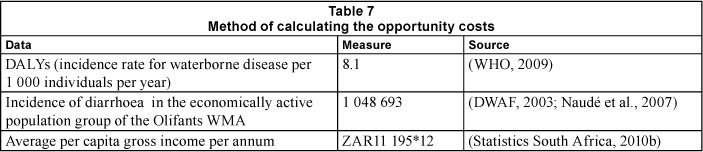
where YLL is determined by the West model life-table (Coale and Guo, 1989); and YLD is based on the incidence and duration of conditions resulting in non-fatal occurrences of disease, and is weighted according to the severity of the disability. In this way, YLD are rendered comparable to YLL (Schneider, 2001). The DALY employs an age-weight function to allocate a comparatively heavier weight to the middle age group (9-54 years) of the population as compared to age groups 0-8 and 55+ years (Schneider, 2001; Murray and Lopez, 1996). Some studies disagree with this concept (Anand and Hanson, 1997). However, in this study, it was argued that the middle age group constitutes the bulk of the employment and tax base within an economy and thus assumes responsibility for fending for the youth and elderly, implying that their income is distributed across the entire demographic structure of the population. The aim of health interventions is to minimise the number of DALYs, that is, to promote a longer and healthier life for people (Bradshaw et al., 2003). The World Health Organisation country profile of environmental burden of disease for South Africa (WHO, 2009) estimates a DALY for South Africa associated with water pollution related illnesses of 8.1 per thousand people per year. This is based on comparative risk assessment, evidence synthesis and expert evaluation for regional exposure and WHO country health statistics.
The second constituent of estimating the indirect cost of the burden of disease was an estimate of the value of human capital. Similarly to a study by Le et al. (2005), gross income was used as a proxy for the value of human capital. In congruity with moral judgement, this study assumed that the human capital capacity is unaffected by employment status. The Statistics South Africa (2010b) quarterly employment statistics present the gross income (the amount of income before taxes have been paid) for employed individuals in the formal non-agricultural sector of South Africa. On this basis an average monthly gross income of ZAR11 195 per capita per month in South Africa for formal non-agricultural sectors was used (Statistics South Africa, 2010b).
It should thus be noted that the Statistics South Africa gross earnings estimates exclude the agricultural sector. However, the national income figures referred to above were used during this study based on the following arguments:
- The study area falls within the Gauteng, Mpumalanga and Limpopo provinces of South Africa, which are axiomatically expected to have different earning levels (Gauteng by far the highest). However, the country has a long history of labour migration and significant numbers of people from Limpopo and Mpumalanga will search for employment in neighbouring Gauteng, or any other province. People are therefore not confined to one province, and therefore provincial income figures would not have been representative.
- The impacts on the informal economy are most often excluded from these kinds of studies. While the cash value of trade in the informal economy (bartering) is estimated to be at least 9.5% of the value of GDP (Saunders, 2005) or 28.4% of GNP (gross national product) (Schneider, 2002), pollution will also impact on these values. Given that there is no reliable way of estimating such impacts, it is anticipated that the choice for representative gross income (ZAR11 195 per month) would account for this limitation.
The product of the burden of disease (in terms of DALYs per annum) and the potential gross annual income per capita, for the economically active group, thus provides an estimate of the opportunity costs associated with waterborne diseases in the study area. Table 7 summarises the input data for the calculation of the indirect costs due to water pollution incurred in the study area, and the sources of data used.
Results and discussion
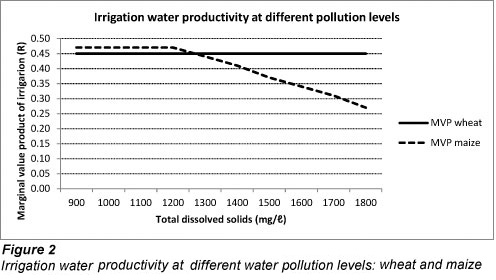
All crops (except wheat) showed a declining VMP with incremental increases in salinity. Wheat, being salinity-tolerant, has a salinity threshold of 4 346 mg/ℓ TDS, which implies that the VMP of 0.45 ZAR/m3 will stay constant throughout the chosen salinity range (Fig. 2). The VMP of maize was observed to decline from 0.47 ZAR/m3 to 0.27 ZAR/m3 of water as salinity increased from 1 200 to 1 800 mg/ℓ TDS. The gradient after the salinity threshold of maize was -0.033, which implies that for every 100 mg/ℓ increase in salinity, maize production suffers a 0.033 ZAR/m3 loss in the VMP.
The VMP of potatoes (Fig. 3) declined from 5.60 ZAR/m3 to 3.62 ZAR/m3, after experiencing a salinity threshold at 1 100 mg/ℓ TDS. The gradient of potatoes was -0.29. The VMP for citrus declined from 3.65 ZAR/m3 to zero, with a salinity increase from 900 to 1 400 mg/ℓ TDS. The gradient for citrus was -0.81 as salinity increased.
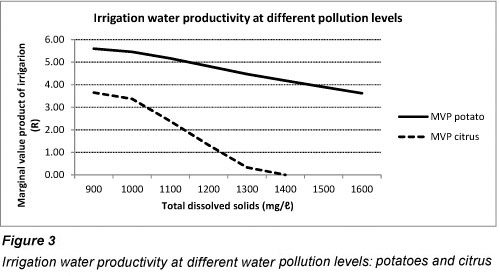
Apart from being the most sensitive to salinity, citrus production was also observed to suffer the highest total decrease in terms of the VMP (3.65 ZAR/m3). Given that wheat experienced no decline in VMP for the modelling range, one would expect an increase in the area utilised for wheat production if the salinity problem worsens in the future.
For microbial pollution, a direct cost estimate of the burden of disease for diarrhoea of ZAR704 million per year (ZAR 669 million plus ZAR 35 million) was calculated for the study area. While the direct cost due to diarrhoea seems to be significant, a much larger economic burden results from the indirect cost estimates. The indirect cost estimate of water pollution was approximately ZAR1.14*109 per year for the study area (total DALYs associated with diarrhoea in the study area of 8 494 multiplied by the annual income loss of ZAR134 340 per capita). This represents at least 0.046% of national nominal GDP, estimated at ZAR2500*109 for 2010 (Statistics South Africa, 2010a). The indirect cost estimates are, in essence, estimates of the value (the benefit) of preventing water pollution and thus represent the upper bound of potential microbial water treatment intervention costs (interventions have to be equal to or less costly than ZAR1.141*109 to avoid a net social cost in terms of indirect health costs of microbial pollution). Thus, a pollution control intervention with a higher cost than this estimate will not be financially worthwhile for society, because the costs of such an intervention could exceed the benefits derived from it (ceteris paribus). Given that the burden of disease (BoD) is equal to the sum of mortality and morbidity impacts (Mathers et al., 2007; WHO, 2010), it was possible to infer the mortality impacts of microbial pollution by taking the difference between indirect (morbidity plus mortality) cost and the direct (morbidity) cost, resulting in a mortality cost of ZAR437*106. Note that the mortality impact is thus lower than morbidity impacts which could be as a result of a higher burden of disease in the economically-inactive portion of the population (young children in particular).
Conclusion
Poor water quality is a result of physical, social and institutional factors, which necessitates a thorough understanding of the cause-effect relationship between variables contributing to this problem. This study estimated the costs associated with salinisation and microbial pollution of water resources in the Olifants WMA in South Africa.
The monetary impact of salinisation of irrigation water was quantified in terms of the income lost when crops are irrigated with polluted water. The results of these estimates provide a baseline for comparisons of salinity effects on agriculture. The difference between the VMP for the different crops and the current 'raw' water tariff of 0.14 ZAR/m3 for the area indicates that water is underpriced. It further suggests that water user charges are currently not an effective water demand management tool in South Africa, mainly because of immature water markets. Water pricing should be regarded first and foremost as a cost-recovery tool in water management, i.e., water tariffs should be set to ensure full cost recovery for infrastructure and the management of catchments, including pollution control, and should therefore be approached responsibly.
The monetary impact of microbial pollution focused on the assessment of the environmental burden of disease associated with such pollution. The DALY metric (Foege, 1994) was used in this procedure. The study area suffered direct health costs of an estimated ZAR 669 million due to diarrhoea. In addition, indirect costs of diarrhoea were estimated at ZAR 1.141 billion per year for the study area. These figures are significant when considering that 84% of all diarrheal disease in South Africa is attributable to water and sanitation (Levin et al., 2007). The estimates and assumptions used in the BoD assessment were conservative and stated explicitly. Although the results should be interpreted with caution, they do provide an order of magnitude indication of the extent of the cost of pollution to society and should be applied to usher a paradigm shift of environmental health policy approaches that proffer more effective and sensitive interventions.
Putting these figures in perspective, more than 2 million people in the study area are subjected to below-RDP standard water and sanitation services. If they are to be provided with 50 litres of potable water per person per day, a water purification works with 111 Mℓ/day treatment capacity will be required. The construction cost for such a facility would be in the order of ZAR 510 million (Oelofse et al., 2011), which is less than the current annual direct health cost burden (ZAR669 million) as estimated in this study (this excludes the indirect cost estimate). It is therefore evident that investments to improve service delivery for safe drinking water and sanitation will realise net savings in the study area from a social welfare perspective.
The information generated in this study provides monetary estimates for the management of water-pollution risk factors. The information should be used to monitor the impacts of the pollution burden over time, which is necessary for interventions to reduce environmental risk factors or to change behaviour.
Acknowledgements
This research was funded by the Water Research Commission of South Africa. The authors would therefore like to thank the members of the reference group of the project for continued guidance throughout the duration of this research project. We would also like to thank the reviewers of this article for their constructive criticism on an earlier draft.
References
AIHOON J, GROENEWALD J and SARTORIUS VON BACH H (1997) Agricultural salinization in the Olifants river at Loskop valley, Mpumalanga. Agrekon 36 (3) 268-283. [ Links ]
ANAND S and HANSON K (1997) Disability Adjusted Life Years -|A critical review. J. Health Econ. 16 685-702. [ Links ]
ARMOUR RJ (2002) The economic effects of poor and fluctuating irrigation water salinity levels in the Vaal and Riet rivers. Department of Agricultural Economics, University of the Free State. URL: http://etd.uovs.ac.za/ETD-db//theses/available/etd-12062007-084412/unrestricted/ArmourRJ.pdf (Accessed 26 October 2009). [ Links ]
ARMOUR RJ (2007) Integrated modelling for sustainable management of salinity in the Lower Vaal and Riet river irrigation areas. Department of Agricultural Economics, University of the Free State. URL: http://etd.uovs.ac.za/ETD-db//theses/available/etd-12102007-075814/unrestricted/ArmourRJ.pdf (Accessed 19 August 2009). [ Links ]
ARMOUR RJ and VILJOEN MF (2000) Towards quantifying the economic effects of poor and fluctuating water quality on irrigation agriculture. Agrekon 39 (1) 99-110. [ Links ]
BARTIK TJ (1988) Evaluating the benefits of non-marginal reductions in pollution using information on defensive expenditures. J. Environ. Econ. Manage. 15 111-127. [ Links ]
BRADSHAW D, GROENEWALD P, LAUBSCHER R, NANNAN N, NOJILANA B, NORMAN R, PIETERSE D and SCHNEIDER M (2003) Initial burden of disease estimates for South Africa - 2000. Burden of Disease Research Unit, Medical Research Council, Cape Town, South Africa. ISBN: 1-919809-64-3. [ Links ]
CIRIACY-WANTRUP SV (1947) Capital returns from soil conservation practices. J. Farm Econ. 29 1181-1196. [ Links ]
COALE A and GUO G (1989) Revised regional model life tables at very low levels of mortality. Popul. Index 55 (4) 613-643. [ Links ]
COURANT PN and PORTER RC (1981) Averting expenditures and the costs of pollution. J. Environ. Econ. Manage. 8 321-329. [ Links ]
CROSBY CT (1996) SAPWAT - A computer program for estimating irrigation requirements in Southern Africa. WRC Report No. 379/1/96, Water Research Commission, Pretoria. [ Links ]
DAVIS RK (1963) The Value of Outdoor Recreation: An Economic Study of the Maine Woods. Department of Economics, Harvard University. [ Links ]
DECIDUOUS FRUIT PRODUCERS TRUST (2008) Annual key deciduous fruit statistics, Paarl, South Africa. Compiled by the Deciduous Fruit Producers Trust (DFPT) and Optimal Agricultural Business Systems (OABS) for the South African Apple and Pear Producers' Association; Dried Fruit Technical Services; South African Stone Fruit Producers Association and the South African Table Grapes Producers' Association. [ Links ]
DU PREEZ CC, STRYDOM MG, LE ROUX PAL, PRETORIUS JP, VAN RENSBURG LD and BENNIE ATP (2000) Effect of water quality on irrigation farming along the lower Vaal River: The influence on soils and crops., WRC Report No. 740/1/00. Water Research Commission, Pretoria. [ Links ]
DWAF (DEPARTMENT OF WATER AFFAIRS AND FORESTRY, SOUTH AFRICA) (1998) National Water Act No. 36 of 1998, Statutes of the Republic of South Africa, Pretoria. [ Links ]
DWAF (DEPARTMENT OF WATER AFFAIRS AND FORESTRY, SOUTH AFRICA) (2001) Water quality management series: Managing the water quality effects of settlements. DWAF Report number: Edition 2, Policy Document U 1.3. Department of Water Affairs and Forestry, Pretoria. URL:http://www.dwaf.gov.za/Projects/Dense/docs/NS%20Ed%202%20complete%20 document.pdf (Accessed 30 August 2010). [ Links ]
DWAF (DEPARTMENT OF WATER AFFAIRS AND FORESTRY, SOUTH AFRICA) (2003) Olifants Water Management Area: Water resources situation assessment. DWAF Report number: P/04000/00/0101. Department of Water Affairs and Forestry, Pretoria. [ Links ]
DWAF (DEPARTMENT OF WATER AFFAIRS AND FORESTRY, SOUTH AFRICA) (2004) Olifants River Water Management Area Internal Strategic Perspective. DWAF Report number: P WMA 04/000/00/0304. Department of Water Affairs and Forestry, Pretoria. [ Links ]
FERREIRA D (2009) Personal communication, 9 February 2010. Mr D. Ferreira, Manager, Loskop Dam Water User Association, Groblersdal. FOEGE W (1994) Preventative medicine and public health. JAMA 271 1704-1705. [ Links ] [ Links ]
GOUDGE J, GILSON L, RUSSELL S, GUMEDE T and MILLS A (2009) The household costs of health care in rural South Africa with free public primary care and hospital exemptions for the poor. Trop. Med. Int. Health 14 458-467. [ Links ]
HASSAN RM and FAROLFI S (2005) Water value, resource rent recovery and economic welfare cost of environmental protection: A water-sector model for the Steelpoort sub-basin in South Africa. Water SA 31 (1) 9-16. [ Links ]
HINRICHSEN D, ROBEY B and UPADHYAY UD (1997) Solutions for a Water-Short World. Population Reports Series M, 14. URL: http://www.k4health.org/pr/m14/m14creds.shtml (Accessed 16 April 2010). [ Links ]
JABEEN S, ASHFAQ M and AHMAD-BAIG I (2006) Linear program modelling for determining the value of irrigation water. J. Agric. Soc. Sci. 2 101-105. [ Links ]
LANGE GM and HASSAN RM (2006) The economics of water management in Southern Africa An environmental accounting approach. Edward Elgar Press, London. 296 pp. [ Links ]
LE T, GIBSON JG and OXLEY L (2006) A forward looking measure of the stock of human capital in New Zealand, Department of Economics, University of Canterbury. URL: http://dea.uib.es/digitalAssets/123/123222_loxley.pdf (Accessed 16 April 2010). [ Links ]
LEWIN S, NORMAN R, NANNAN N, THOMAS E, BRADSHAW D and SOUTH AFRICAN COMPARATIVE RISK ASSESSMENT COLLABORATING GROUP (2007) Estimating the burden of disease attributable to unsafe water and lack of sanitation and hygiene in South Africa in 2000. S. Afr. Med. J. 97 755-762. [ Links ]
MAAS EV (1986) Salt tolerance of plants. Appl. Agric. Res. 1 12-26. MAAS EV, HOFFMAN GJ, CHABA GD, POSS JA and SHANNON MC (1983) Salt sensitivity of corn at various growth stages. Irrig. Sci. 4 45-57. [ Links ] [ Links ]
MATHERS CD, EZZATI M and LOPEZ AD (2007) Measuring the burden of neglected tropical diseases-The global burden of disease framework. PloS Neglected Trop. Dis. 1 e114-e129. [ Links ]
MONTGOMERY MA and ELIMELECH M (2007) Water and sanitation in developing countries including health in the equation. American Chemical Society. URL: http://www.yale.edu/env/elime-lech/publication-pdf/ES&T_Feature_Montgomery_Elimelech_ January_2007.pdf (Accessed 17 February 2009). [ Links ]
MURRAY CJL and LOPEZ AD (1996) The Global Burden of Disease: a comprehensive assessment of mortality and disability from diseases, injuries and risk factors in 1990 and projected to 2020. World Health Organization, Harvard School of Public Health and World Bank, Geneve. URL: http://www.who.int/mip/2003/other_documents/en/globalburdenofdisease.pdf (Accessed 17 December 2009). [ Links ]
NAUDÉ AH, BADENHORST W, ZIETSMAN HL, VAN HUYS-STEEN E and MARITZ J (2007) Technical overview of the mesoframe methodology and South African Geospatial Analysis Platform. CSIR Report number: CSIR/BE/PSS/IR/2007/0104/B. CSIR, Pretoria. [ Links ]
NIEUWOUDT WL, BACKEBERG GR and DU PLESSIS HM (2004) The value of water in the South African economy: Some implications. Agrekon 43 (2) 162-183. [ Links ]
OELOFSE SHH, ROUX S, DE LANGE WJ, MAHUMANI BK, LE ROUX W, DU PREEZ M, GREBEN HA and STEYN M (2011) A comparison of the cost associated with pollution prevention measures to that required to treat polluted water resources. Report number: CSIR/NRE/PW/ER/2011/0006/A. CSIR, Pretoria. [ Links ]
PEGRAM GC, ROLLINS N and ESPEY Q (1998) Estimating the costs of diarrhoea and epidemic dysentery in KZN and SA. Water SA 24 (1) 11-20. [ Links ]
PRUSS-USTUN A, MATHERS C, CORVALAN C and WOODWARD A (2003) Introduction and methods-Assessing the environmental burden of disease at national and local levels. Environmental Burden of Disease Series No.1. WHO, Geneve. URL: http://www.who.int/quantifying_ehimpacts/publications/9241546204/en/index.html (Accessed 1 July 2010). [ Links ]
SAUNDERS GH (2005) Estimates of the informal economy in South Africa: Some macroeconomic policy implications. Department of Economics, University of Johannesburg. URL: https://ujdigispace.uj.ac.za/handle/10210/653?show=full (Accessed 15 January 2008). [ Links ]
SCHNEIDER F (2002) Size and measurement of the informal economy in 110 countries around the world. Paper presented at Workshop of the Australian National Tax Centre, July, 2002, Canberra, Australia. URL: http://www.amnet.co.il/attachments/informal_economy110.pdf (Accessed 15 August 2007). [ Links ]
SCHNEIDER M (2001) The setting of health research priorities in South Africa. Burden of Disease Research Unit, Medical Research Council, Cape Town. ISBN: 1-919809-15-5 [ Links ]
STATISTICS SOUTH AFRICA (2002) Census of agriculture provincial statistics 2002: Eastern Cape financial and production statistics. Report number: 11-02-09, Statistics South Africa, Pretoria. [ Links ]
STATISTICS SOUTH AFRICA (2007) Community Survey, 2007 (revised version). Report number: P 0301. Statistics South Africa, Pretoria. [ Links ]
STATISTICS SOUTH AFRICA (2010a) Gross Domestic Product: Second Quarter 2010. Statistics South Africa, Pretoria. [ Links ]
STATISTICS SOUTH AFRICA (2010b) Quarterly employment statistics March 2010. Report number: P0277. Statistics South Africa, Pretoria. [ Links ]
URBAN-ECON (2000) The economic cost effects of salinity: Water quality analysis, feeder systems and natural environment. WRC Report No. 634/6/00. Water Research Commission, Pretoria. [ Links ]
VAN HEERDEN PS, CROSBY CT, GROVE B, BENADE N, THERON E, SCHULZE RE and TEWOLDE MH (2008) Integrating and upgrading of SAPWAT and PLANWAT to create a powerful and user-friendly irrigation water planning tool. WRC Report No. TT 391/08. Water Research Commission, Pretoria. [ Links ]
VAN ZYL P (2009) Personal communication, 23 June 2009. Mr P van Zyl, Agricultural Economist, Potatoes South Africa. URL: http://www.potatoes.co.za/. [ Links ]
VILJOEN MF and ARMOUR RJ (2002) The economic impact of changing water quality on irrigated agriculture in the lower Vaal and Riet rivers. WRC Report No. 947/1/02. Water Research Commission, Pretoria. [ Links ]
WESTERN CAPE DEPARTMENT OF AGRICULTURE (2006) Computerised budgeting system (COMBUD). Agricultural Economics services, Western Cape Department of Agriculture, Elsenburg. [ Links ]
WHO (WORLD HEALTH ORGANIZATION) (2009) Country profile of environmental burden of disease - South Africa. URL: http://www.who.int/entity/quantifying_ehimpacts/national/countrypro-file/southafrica.pdf (Accessed 7 July 2010) [ Links ]
WHO (WORLD HEALTH ORGANIZATION) (2010) World Health Organization Metrics - Disability Adjusted Life Year (DALY). URL: http://www.who.int/healthinfo/global_burden_disease/met-ricsdaly/en/index.html (Accessed 8 June 2010). [ Links ]
WRIGHT JA, GUNDRY SW, CONROY R, WOOD D, DU PREEZ M, FERRO-LUZZI A, GENTHE B, KIRIMI M, MOYO S, MUTISI C, NDAMBA J and POTGIETER N (2006) Defining episodes of diar-rhoea: Results from a three-country study in Sub-Saharan Africa. J. Health Popul. Nutr. 24 8-16. [ Links ]
YOUNG RA (2004) Determining the Economic Value of Water: Concepts and Methods. RFF Press, Washington. 357 pp. [ Links ]
Received 4 April 2011;
Accepted in revised form 2 April 2012.
* To whom all correspondence should be addressed. +27 21 8882462; fax: +27 21 8866518; E-mail: wdelange@csir.co.za

