


Services on Demand
Article
 English (pdf)
 Article in xml format
 Article references
Indicators

Related links
-
 Cited by Google
 -
 Similars in Google
Share

 Permalink
Water SA
On-line version ISSN 1816-7950
Print version ISSN 0378-4738
Water SA vol.38 n.2 Pretoria Jan. 2012
ARTICLES
The water balance of a seasonal stream in the semi-arid Western Cape (South Africa)
Richard DH BuganI, II, *; Nebo Z JovanovicI; Willem P De ClercqII
ICouncil for Scientific and Industrial Research (Natural Resources and the Environment), PO Box 320, Stellenbosch 7599, South Africa
IIStellenbosch University (Soil Science), Private Bag X1, Matieland 7602, South Africa
ABSTRACT
A detailed water balance and conceptual flow model was calculated and developed for the Sandspruit catchment for the period 1990 to 2010 on a winter rainfall water-year (1 April - 31 March) basis. The Sandspruit catchment (quaternary catchment G10J) is located in the Western Cape Province of South Africa and is a tributary of the Berg River. It contributes significantly to the salinisation of the mid- to lower-reaches of the Berg River and thus the hydrological drivers need to be quantified and conceptualised in order to develop salinity management strategies. Various components of the water balance, i.e. precipitation, evaporation, streamflow, recharge, etc., were monitored and quantified. In addition, stable environmental isotopes and water balance modelling were used to perform hydrograph separation as well as to quantify components of the water balance. Annual streamflow in the catchment during the period of observation was variable, ranging between 0.026 mm-a-1 and 75.401 mm-a-1. Streamflow volumes also exhibit high variability between water years. Catchment annual rainfall varied between 351 and 655 mm-a-1, averaging at 473 mm-a-1. On average, 6.5% of rainfall was converted to streamflow during the period of observation. Evapotranspiration was found to be the dominant component of the water balance, as it comprises, on average, 94% of precipitation in the catchment. Groundwater recharge was calculated to average at 29 mm-a-1. The water balance model (J2000) performed well during the simulation period with all measures of performance exhibiting acceptable values. Simulation results indicate that streamflow is driven by interflow from the soil horizon (94.68% of streamflow), followed by overland flow (4.92% of streamflow). These results, together with the physiographic conditions evident in the catchment, were used to develop a conceptual flow model. Streamflow is interpreted to be driven by quickflow, i.e. overland flow and interflow, with minimal contribution from groundwater, and is also more dependent on the rainfall distribution in time rather than on the annual volume. The correlation between average annual streamflow and average rainfall was observed to be poor, suggesting that alternative factors, e.g. the spatial distribution of winter wheat, the temporal distribution of rainfall, climatic variables (temperature), etc., exert a greater influence on streamflow. The water balance and conceptual flow model will form the basis for the application of distributed hydrological modelling in the Sandspruit catchment and the development of salinity management strategies. Results from this investigation, e.g. ET estimates, methods to quantify groundwater recharge, hydrograph separation, etc., could potentially be extrapolated to other semi-arid areas.
Keywords: Sandspruit River, Berg River, semi-arid, conceptual water balance, evapotranspiration, hydrological modelling, recharge
Introduction
The quantification of a catchment's water yield is a fundamental problem in hydrology, particularly the volume of water available at the catchment outlet over a fixed time period (Poncea and Shetty, 1995). The catchment water balance issue is even more fundamental under the impacts of significant human-induced land use change. Optimising the water yield from catchments within South Africa has become an essential component of catchment management, as increased pressure is being placed on the country's water resources, primarily due to population growth and inadequate management of the resource.
Hydrological modelling has been identified as an essential tool for effective catchment management. Both physically-based hydrological models and simple conceptual water balance models are useful tools to address a range of hydrological problems (Xu, 1999). Conceptual water balance models provide insight into the hydrological processes within catchments (Everson, 2001), and are regarded as being essential for the development and improvement of physically-based hydrological models. Conceptual models do not take into account the detailed geometry and small-scale variability of catchments, but rather consider the catchment as an ensemble of interconnected conceptual storages (Jothityangkoon et al., 2001). In addition, they allow for the identification or quantification of the principal factors (meteorological, plant, soil, etc.) which control the processes of water loss. They also allow for the generation of synthetic sequences of hydrological data for various purposes, including water resources design and management (Xu, 1999). A lack of capacity and inadequate infrastructure does, however, mean that detailed information pertaining to all the terms of the water balance equation is rarely available to catchment hydrologists (Everson, 2001).
The semi-arid Western Cape Province of South Africa has recently received much attention (De Clercq et al., 2010; Fey and De Clercq, 2004) due to areas, particularly the Swartland region, increasingly exhibiting evidence of dryland salinity. This not only poses a potential threat to the freshwater resources in the area, i.e. the Berg River, but also to the agricultural industry. The Swartland is regarded as the 'bread basket' of the country due to the extensive wheat cultivation in the area. The Sandspruit River, a tributary of the Berg River, has been particularly impacted by dryland salinisation, exhibiting deteriorating water quality. The river has been observed to exhibit water quality which is unfit for domestic supply or irrigation for much of the rainy season (De Clercq et al., 2010). It is thus essential to identify the main hydrological drivers within the catchment to develop effective dryland salinity management strategies. The need to address salinity has highlighted the importance of understanding the fundamental hydrological processes that underpin all water resource and land use issues (Hughes et al., 2007). Ward (1972) suggests that detailed investigations should be aimed initially at an improved understanding of hydrological processes within the catchment. The objective of this investigation was to calculate and develop a detailed water balance and conceptual flow model for the Sandspruit catchment for the period 1990 to 2010 on a winter rainfall water year (1 April - 31 March) basis. This would allow for the identification of the dominant hydrological drivers in the catchment as well as the dominant flow contributors to streamflow. This balance was based on physical data gathered during previous Water Research Commission (WRC) projects (De Clercq et al., 2010 and Fey and De Clercq, 2004), current WRC projects, weather stations managed by the Agricultural Research Council (ARC) as well as Department of Water Affairs (DWA) streamflow data.
Study area
Location
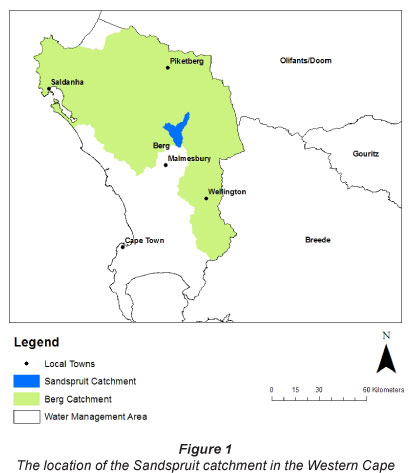
The Sandspruit catchment, which forms part of quaternary catchment G10J, is located in the Western Cape Province of South Africa, approximately 80 km northeast of Cape Town (Fig. 1). Major towns in the area are Malmesbury, Riebeek-Wes and Moorreesburg. The Sandspruit catchment is regarded as a medium-sized catchment. It is a seasonal stream, i.e. it only flows between the months of June and November, exhibiting a catchment area of approximately 152 km2.
Topography and land use
The topography of the catchment is relatively flat, exhibiting a gently undulating surface. The elevation ranges between 900 m a.m.s.l. in the higher elevated southerly parts (Kasteelberg) of the catchment to 40 m a.m.s.l. in the lower elevation areas (northwest). The average topographic gradient across the catchment is 0.013. Land use in the Sandspruit catchment is dominated by cultivated lands and pastures. Agriculture is dominated by wheat cultivation. However, the growing of lupins and canola is not uncommon. Farmers in the area generally follow a 3-year planting rotation, i.e. cultivation only occurs every third year. Lands are left fallow between planting rotations and used for grazing. Soil erosion is minimised through the use of man-made anti erosion contours, which are evident throughout the catchment.
Climate
The Berg River Catchment experiences a Mediterranean climate with warm dry summers and cool wet winters. Rainfall is of a cyclonic nature, extending normally over a few days with significant periods of clear weather in between. Little rain falls during summer, with the rainy season extending from April through to October. Precipitation is generally in the form of frontal rain approaching from the northwest. Mean annual precipitation in quaternary catchment G10J amounts to 460 mm.a-1 (DWAF, 2003).
Soils
According to Meadows (2003), relatively shallow, brownish sandy loam soils are developed on Malmesbury shales, which are prone to caking after heavy rain. Soils are generally poorly developed and usually shallow on hard or weathered rock. The topsoil varies in thickness between 0.5 and 1 m and exhibits red and yellow colouring. The soil water-holding capacity ranges between 20 and 40 mm, but can be up to 80 mm in the upper and lower reaches of the Sandspruit catchment. Soil drainage is somewhat impeded by the low hydraulic conductivity of the semi-weathered Malmesbury shale throughout the Sandspruit catchment, and is particularly poor in the lower reaches (Bugan et al., 2009).
Geology
Geology in the Sandspruit catchment shows minimal variation, being dominated by Table Mountain Group (TMG) sandstone in the high elevation areas and Malmesbury shale in the mid- to low-elevation parts (Fig. 2). An alluvium cover is also evident, which increases in thickness towards the lower elevation areas of the catchment.
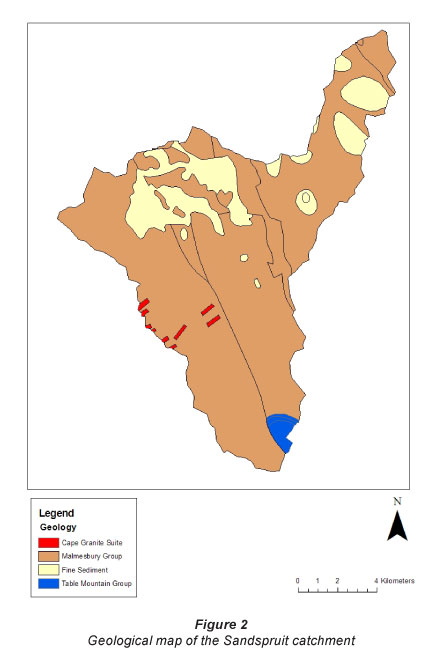
The TMG is represented by Kasteelberg (900 m a.m.s.l.). It is a light-grey quartzitic sandstone outcrop, exhibiting thin siltstone, shale and polymictic conglomerate beds. It is interpreted to be part of the Peninsula Formation. The remainder of the watershed is dominated by the Malmesbury Group shales. These are represented by low-grade metamorphic rocks such as phyllitic shale, quartz and sericrete schist, siltstone, sandstone and greywacke (Meyer, 2001). It is interpreted to be part of the Moorreesburg Formation. Field investigations have, however, revealed that there are granite hills, essentially granite plutons, intruded into the Malmesbury Group, which are surrounded by clay soils typically derived from weathered granite (Anchor Environmental and Freshwater Consulting Group, 2007). The alluvium cover is represented by fine sediment, which may be characterised as loam and sandy loam.
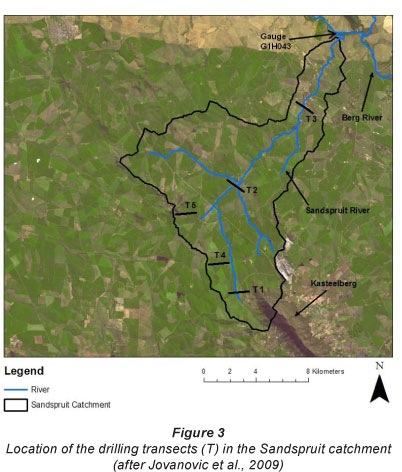
Jovanovic et al. (2009) undertook an extensive borehole drilling exercise in the Sandspruit catchment to study the geology, depth to groundwater, groundwater quality, etc. Three transects were identified as drilling sites, which are representative of the upper-, mid- and lower-reaches of the Sandspruit River, respectively (Fig. 3). The transects were also sited so as to be representative of the geological variability in the catchment (Fig. 2). Ten boreholes were drilled across Transect 1 in an area dominated by TMG sandstones (Kasteelberg) as well as Malmesbury shale. It should be noted, however, that the boreholes drilled at this site did not intersect any TMG sandstones. Transect 2, represented by 3 boreholes, is located in a Malmesbury shale dominated environment. Transect 3, represented by 5 boreholes, is also located in a Malmesbury shale dominated environment, however a deeper/thicker alluvium cover exists here. After completion of these transects, 2 additional transects were drilled, i.e. Transects 4 and 5, represented by 3 and 4 boreholes, respectively.
Results from the investigation by Jovanovic et al. (2009) indicated that the catchment geology is characterised by an alluvium cover (yellow/brown sand/silt), which increases in thickness downstream, overlaying Malmesbury shale (grey/ dark grey). The alluvium cover is composed of sandy material with differing boulder contents as well as exhibiting clay layering. During the time of drilling moist and even saturated horizons were also observed within this alluvium cover (Jovanovic et al., 2009). Water strikes generally occurred at the interface between the alluvium cover and Malmesbury shale. The typical geological succession evident in the catchment is illustrated for 1 borehole in Fig. 4.

Hydrology
The Sandspruit River is a seasonal stream with streamflow mainly occurring between the months of June and November. Streamflow at the catchment outlet is gauged with a crump weir. Methods such as velocity measurements, backwater calculations and slope-area are used to calibrate these stations for high flows (DWAF, 2008). Water abstraction from the Sandspruit River is minimal, due to its inadequate quality, and thus observed records are interpreted to be natural streamflow. According to Middleton and Bailey (2009) runoff in quaternary catchment G10J ranges between 10 and 20 mm.a-1. Anchor Environmental and Freshwater Consulting Group (2007) reports naturalised mean annual runoff for the Sandspruit catchment to be 6 m3-s-1. If it is assumed that groundwater discharges into rivers in areas where the water table is within 2.5 m of the surface (Anchor Environmental and Freshwater Consulting Group, 2007), then it is deduced that the Sandspruit River is generally influent in character, i.e. water is discharged from the river into the groundwater system.
Hydrogeology
The Malmesbury Group Aquifer (MGA) is the main aquifer system in the study area. It is classified as a Minor Aquifer System (Parsons, 1995). These are defined as fractured or potentially fractured rocks that do not have a high primary permeability, or other formations of variable permeability. Secondary aquifers attribute their water-bearing properties to weathering, fracturing and faulting processes. However, the argillaceous nature of most of the rock, and poor groundwater quality, limit the exploitation potential of these aquifers. A borehole yield analysis indicated that 32% of boreholes yield less than 0.5 ℓ.s-1 and 11% yield more than 5 ℓ.s-1 (Meyer, 2001). Although these aquifers seldom produce large quantities of water, they are important both for local supplies and in supplying baseflow to rivers. They also have a moderate vulnerability to pollution (Parsons, 1995). Recharge in semi-arid regions is generally episodic, thus only occurring during intense rainfall events or during periods of prolonged rainfall. Recharge is reported to be 71 mm.a-1 around Kasteelberg and 69 mm.a-1 in the rest of quaternary catchment G10J (Vegter, 1995).
Groundwater quality in the catchment is dominantly a function of lithology, in addition to residence time and rainfall (recharge). Groundwater generally exhibits a NaCl character and an EC ranging between 33 mS.m-1 and 2 060 mS.m-1 (Jovanovic et al., 2009). Cl- is by far the dominant anion, particularly in the mid- and lower reaches of the catchment.
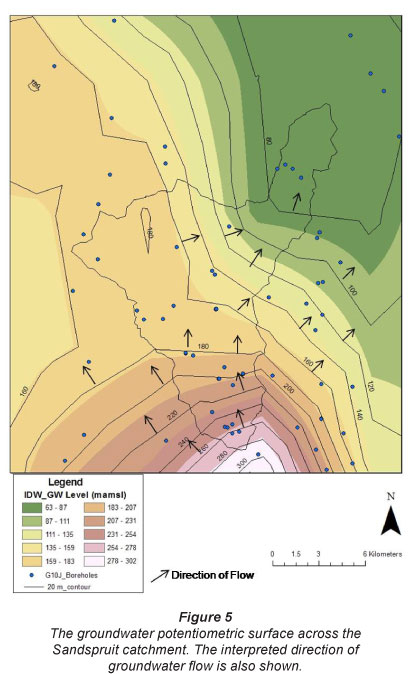
Groundwater level data gathered during this investigation and data from the National Groundwater Database (NGDB) allowed for a potentiometric surface within the catchment to be interpolated, via inverse distance weighting (IDW). The potentiometric surface ranges between 0.10 - 43.35 m b.g.l.
The interpolated potentiometric surface is presented in Fig. 5. Groundwater flow is expected to occur perpendicular to equipotential lines. The interpreted direction of groundwater flow is shown in Fig. 5. Groundwater flows in a north to north-westerly direction in the southern parts and in a north-easterly direction in the northern parts of the catchment. The contrasting direction of flow in the western and north-western parts of the catchment suggests that a groundwater divide could exist in this area.
Catchment water balance
The water balance of a catchment is a deterministic relationship between the water balance components that are random variables in time and space, with usually unknown probability distributions (Everson, 2001). Rainfall is the independent input variable, which is transformed in the hydrological cycle into the dependent output variables, i.e. evaporation/evapotranspiration, streamflow and change in soil storage. To enable mathematical prediction of the hydrological variables some simplifications are required. The most practical method is the use of the deterministic approach of applying the macroscopic version of the continuity equation. The various continuous water movement processes of the water cycle are lumped over fixed time intervals and areas and related by the water balance equation. The volumetric water balance (mm.a-1) per unit area is expressed in various formats (Everson, 2001; Eagleson, 1978; Poncea and Shetty, 1995; L'vovich, 1979; Beven and O' Connell, 1983; Ward, 1972). Its common form is:

where:
P is the precipitation,
Ea the actual evaporation, SS the soil storage and
Q the streamflow.
All variables, except P, are influenced by soil water, which is generally not measured. This problem is managed with the assumption that the system is stationary in the mean. If the period of observation is a year and expected values are sub-stituted, the change in storage may be regarded as negligible (Everson, 2001; Beven and O' Connell, 1983) and the average annual water balance equation is expressed as:

If the water balance equation can be solved, then it is plausible that measurements or estimations of the individual components of the water balance are accurate. Additionally, the catchment may then be regarded as a watertight hydrological unit. This essentially means that all precipitation falling within the topographical drainage divide leaves the catchment via the main river or as evapotranspiration and that there is no consistent net gain or loss of water by soil water or groundwater seepage. The computation of the catchment water balance may include all components of the hydrological cycle and thus exhibits varying degrees of complexity. The degree of complexity is often dependent on data availability and the aims of the investigation/study. Precipitation is a very important input to the water balance equation, and should thus be represented as accurately as possible. If a reliable, complete and representative rainfall record is available within a catchment/sub-catchment then the application of interpolation techniques is not required. However, if the catchment exhibits variable rainfall distributions, it is generally required to apply a spatial distribution procedure to estimate representative rainfall amounts.
Methodology
There are several methods currently applied in South Africa to compute the components of the catchment water balance and the components of streamflow. Some of these have been applied at the quaternary catchment scale, water management area (WMA) scale and even national scale. It was envisaged to compute, or account for, all components of the water balance as well as the components of streamflow. The following methods as well as data from previous investigations were used to calculate the water balance and conceptualise a flow model for the Sandspruit catchment.
Precipitation
The Sandspruit catchment is characterised by a semi-arid climate, where long dry summers and cool wet winters prevail. All precipitation occurs as rainfall. Annual rainfall exhibits a range between 300 and 400 mm, being dominated by long duration and low intensity frontal rainfall between the months of April and October (De Clercq et al., 2010).
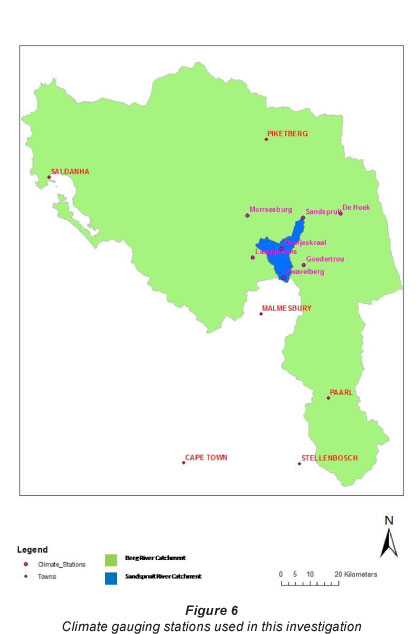
Annual catchment rainfall amounts were calculated by averaging available annual rainfall data. The rain gauge network in the vicinity of the study area consists of 7 gauges (Fig. 6). The ARC manages 4 of these gauges, all of which are located outside of the catchment within a distance of 30 km. As rainfall in semi-arid regions usually exhibits large spatial varia-tion, 3 additional gauges were installed inside the catchment during this investigation (February 2009). These gauges were located so as to be representative of different elevation ranges within the catchment, i.e. the upper-, mid- and lower-reaches.
Streamflow
Daily average streamflow (m3-s-1) has been recorded at DWA station G1H043 (Fig. 3) since the mid 1980s and these data were used in this investigation. To develop a detailed conceptual flow model of the catchment, knowledge of the dominant contributors to catchment streamflow was required. Data in this respect were gathered from previous investigations and by using the following methods:
Baseflow
Baseflow is a non-process related term for low amplitude, high frequency flow in a surface water body (Parsons and Wentzel, 2007). Herold's method of hydrograph separation is a commonly applied technique in South Africa for calculating the groundwater contribution to streamflow, i.e. baseflow.
The method suggests that the current groundwater component results from the combined effect of decay of previous ground-water discharge and previous streamflow increase (Xu et al., 2002). Vegter (1995) quantified the baseflow, using the Herold method, in quaternary catchment G10J to be 94 mm.a-1. Schulze (1997) quantified baseflow to be 0.93 mm.a-1 and Hughes et al. (2003) calculated it to be 12.11 mm.a-1.
Infiltration and overland flow
De Clercq et al. (2010) undertook extensive local-scale studies concerning infiltration rates and overland flow in the vicinity of the study area. Double-ring infiltrometers and rainfall-simulators were used to study the relationship between infiltration (rate and volume) and overland flow. The characteristics of infiltration and overland flow were interpreted to be a function of land use and cultivation practices. In summer, soils are compacted with minimal vegetative covering which significantly limits infiltration, thereby increasing overland flow. In winter, shallow cultivation and preferential flow paths created by root channels facilitate infiltration and reduce overland flow.
The fairly dense nature of winter wheat, the dominant land use in the study area, further impedes overland flow rates and volumes. Infiltrating water is interpreted to move downward or laterally if a layer of low permeability is encountered. Similar physiographic conditions in the Sandspruit catchment suggest that infiltration and overland flow could exhibit similar characteristics to those observed by De Clercq et al. (2010). However, land use is not entirely dominated by wheat during winter. Due to the crop rotation method used by farmers, some areas are left fallow and used for grazing. This is also likely to influence the apportionment of infiltration and overland flow.
Stable isotopes
Environmental isotopes are commonly used in hydrological studies, e.g. investigating timescales associated with water flow, tracing water and pollutants and identifying sources and processes. The stable isotope ratios of deuterium (2H) and oxy-gen-18 (18O) are particularly useful in determining the dominant flow contributors (overland flow, interflow or baseflow) to a water body (Rice and Hornberger, 1998). These isotopes are indicative of the processes to which the water has been subjected in the course of the water cycle (Clarke and Fritz, 1997). Oxygen-18 and deuterium analysis refers to a stable isotope ratio of 18O/16O and 2H/1H in the water molecule respectively (Weaver et al., 2007). The stable isotope concentrations are enriched (increased) in waters that have been subjected to evaporation after precipitation. Alternatively direct recharge from rainfall commonly has a depleted stable isotope concentration. For a description of this methodology, data interpretation techniques and sampling protocol the reader is referred to Bredenkamp et al. (1995) and Weaver et al. (2007).
Oxygen-18 and deuterium were analysed for in groundwa-ter and surface water (Sandspruit River) samples collected in September 2010. The sampling protocol outlined by Weaver et al. (2007) was followed.
Groundwater recharge
Groundwater recharge can vary significantly across a catch-ment, both spatially and temporally, particularly so in the more arid parts of the country (DWAF, 2006; Parsons, 1994; Simmers, 1998). The simplest method used to extrapolate point recharge estimates is through the use of empirical formulas, which equate recharge as a proportion of precipitation. These empirical formulas however assume recharge to be a constant percentage of rainfall. A benefit of rainfall-recharge approaches is that they may be applied without detailed data sets and with limited local recharge studies for verification. The approach however is generic and does not account for physical water cycle processes. DWAF (2006) reviewed the results of numerous recharge studies. These were grouped according to: the type of study (e.g. recharge values obtained from catchment baseflow studies), investigations conducted internationally where similar climatological and geohydrological conditions to South Africa exist, investigations conducted in southern Africa, and investigations by Beekman et al. (1996). These data were used to develop the 'Woodford' trend line (Eq. (3)), which was used to compute a national direct recharge map.

where:
Y is recharge (mm.a-1) and
X is mean annual precipitation (mm.a-1).
The equation developed by Beekman et al. (1996) from recharge studies conducted in Botswana:

The chloride mass balance method (Eriksson and Khumakasem, 1969) is also commonly used to estimate groundwater recharge. It is based on a simple theoretical equation:

where:
RT is groundwater recharge (mm.a-1),
Clp is the chloride concentration in rainwater (mg.ℓ -1) and
Clgw is the chloride concentration in groundwater (mg.ℓ -1).
The chloride mass balance method assumes steady state between the chloride flux at the surface and the chloride flux beneath the ET and mixing zone, and therefore does not consider atmospheric deposition or other sources of chloride. Groundwater recharge was calculated using Eqs. (3), (4) and (5).
Evapotranspiration
Evapotranspiration (ET) is regarded as an important process across a wide range of disciplines, including ecology, hydrology and meteorology (Wilson et al., 2001). Evaporation potential plays a limited role in the hydrological processes of the high rainfall areas as water availability exceeds the evaporative demand, but dominates these processes in the semi-arid areas of the southern, low latitudes (Alexander, 1985). The catchment water balance provides a single integrated assessment of annual ET for a specific area, with the ability to account for annual variability depending on rainfall and vegetation. If actual ET is calculated with the water balance equation, as a residual, it is assumed that deep losses of water, e.g. groundwater recharge, are negligible and that the soil water content is identical at the start and end of the hydrological year, i.e. 1 April and 31 March respectively. This assumption may be justified through the presence of impervious layers, minimal faulting or the absence of preferential flow paths, which minimise deep drainage (Everson, 2001), in the study area.
Alexander (1985) states that areas located between latitudes 200 S and 400 S are characterised by high incident solar radiation and consequently high evaporation losses, which greatly reduce the proportion of the rainfall contributing to river flow. In South Africa approximately 8.6% of precipitation is converted to streamflow (Alexander, 1985). The balance being lost through evapotranspiration, groundwater recharge, ground-water losses, etc. Quaternary catchment G10J is reported to exhibit a potential ET range between 1 500 and 1 700 mm.a-1 (Midgley et al., 1994).
Allen et al. (1998) developed a series of equations for calculating the grass reference ET (ET0) based on the Penman-Monteith equation. This provides a reliable estimate of the catchment reference ET based on readily available data from automatic weather stations. Reference ET can then be converted to potential ET (PET) by using a crop coefficient. PET is the amount of water that could be evaporated and transpired if there were sufficient water available. Semi-arid areas are generally regarded as being water stressed and thus PET is not representative of the actual ET. To convert PET to actual ET a stress coefficient is used.
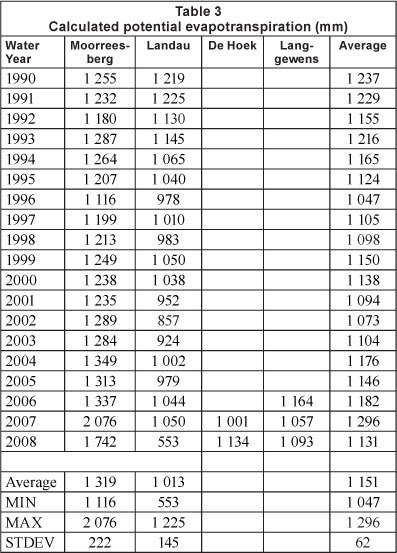
The potential ET, for the Moorreesberg and Landau stations (Fig. 6), was calculated using the method described by Allen et al. (1998) and crop factor estimated by De Clercq et al. (2010). De Clercq et al. (2010) derived the crop factor during selected window periods (summer and winter) for winter wheat and bare soil/wheat stubble, which are the dominant land uses in the catchment. A daily crop factor was calculated using linear regression analysis of the daily crop factor derived by De Clercq et al. (2010) and the day of year (R2 = 0.85). The crop factor ranged between 0.43 and 1.23, averaging at 0.83. The ARC also calculates ET0 using data collected at the De Hoek and Langgewens stations (Fig. 6), which was also converted to PET. As a stress coefficient was not available, the catchment actual ET was calculated as a residual using a modified version of the common form of the water balance equation, i.e. Ea = P - SS - Q.
Soil water storage
Bugan (2008) logged soil water at a site representative of the mid- to lower-reaches of the Sandspruit catchment. Although it is located outside the study area, this site exhibits similar soils, climate and geology. Variation in the volumetric water content (VWC) on samples collected and observed from logger data suggests that minimal variation occurs, at an annual scale (Bugan, 2008). At an annual scale, variations of less than 0.1 m.m-1 (%) were observed, which are interpreted to be negligible.
Water balance modelling
Water balance models are essential decision making tools in water resources assessments, commonly being used to quantify a catchment's water balance. These are essentially based on variations of the water balance equation. They range in complexity from lumped (does not consider variations in physiographic conditions) to fully distributed (considers pixel scale variations in physiographic conditions) models. Through calibration of known variables and components these models also allow for the quantification of more complex components of the water balance.
An additional function of certain water balance models is the ability to perform hydrograph separation, which was the aim of application in this investigation. The model chosen for application was the J2000 (Krause, 2002) model. The J2000 model is a distributed parameter hydrological model, which simulates the water balance in large catchments (Krause, 2002). It simulates the water balance in a spatially-distributed process-orientated manner, with the model core focussing on methods of runoff generation and concentration. Three process levels may be distinguished inside J2000: (i) processes concerning the spatial and temporal distribution of the climate input data, (ii) processes of runoff generation (infiltration excess and saturation excess), and (iii) processes controlling runoff concentration and flood routing. An approach which delineates the basin based on topographic features is adopted. A GIS overlay technique is used, where grid files (elevation, slope, aspect, land use, soil and geology) are overlain producing hydrologically homogenous units in the basin, i.e. the hydrolog-ical response units (HRU) approach, in which units are identified that are assumed to behave similarly hydrologically. The daily input data requirements include precipitation, minimum and maximum temperature, wind speed, relative humidity and sunshine duration. The model provides capabilities for the spatial distribution (inverse distance weighting, IDW) of point-measured input data across the watershed. These methods of spatial distribution are based on vertical and horizontal variations of parameters throughout the catchment (Krause, 2002). The model is able to simulate interception, evapotranspiration, snow accumulation and ablation, horizontally-differentiated soil water and groundwater dynamics, distributed runoff generation and flood routing in the catchment's river network. For a detailed description of the model the reader is referred to Krause (2002).
The J2000 model was set-up for the Sandspruit catchment for the 2009 winter season (March-October 2009). The main aim of model application was hydrograph separation and the identification of the dominant flow contributors to streamflow. Input data were gathered from the climate gauging stations shown in Fig. 6. The model was calibrated using data collected and observations made during this investigation and by De Cercq et al. (2010).
Results and discussion
The precipitation per water year is shown in Table 1. Catchment annual rainfall varied between 351 and 655 mm-a-1, averaging at 473 mm.a-1.
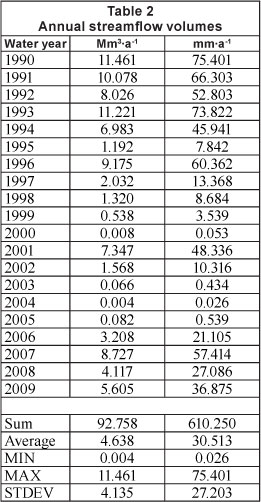
Annual streamflow volumes, per water year, measured at Station G1H043, are shown in Table 2. Annual streamflow in the catchment during the period of observation was variable, ranging between 0.004 Mm3 a-1 and 11.641 Mm3-a-1; this is also reflected in the standard deviation. Streamflow also exhibited high variability between water years. During the period of observation, on average, 6.5% of rainfall was converted to streamflow. This is lower than the average of 8.6% for South Africa suggested by Alexander (1985). The correlation of annual streamflow to annual rainfall yielded poor results, (R2 < 0.4).
The large variability of reported values is indicative of the uncertainty associated with baseflow estimates, particularly in semi-arid areas. The strongly seasonal nature of the Sandspruit River and the depth of the water table suggests that the contribution to streamflow from baseflow is minimal, leaning towards negligible in average and below-average rainfall years. Evidence gathered from literature (De Clercq et al., 2010; Jovanovic et al., 2009) and during this investigation suggests that the Sandspruit River is sustained by quickflow, i.e. overland flow, interflow in the soil profile and direct rainfall.
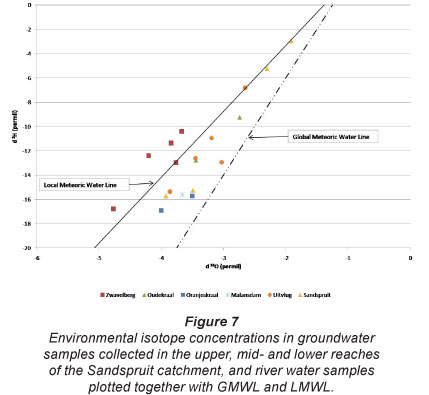
The results of the isotope study are shown in Fig. 7. The Sandspruit samples represent surface water samples whilst the rest represent groundwater samples. The GMWL, representing the world average and a LMWL derived from rainfall sampled at Tulbagh (Diamond and Harris, 1997), located approximately 30 km east of the catchment, are also shown. Generally, samples which plot in the left/bottom-left of the graph exhibit a depleted stable isotope signature as opposed to those which plot in the right/top-right which exhibit an enriched signature. The shift from depleted to enriched signatures is indicative of water being subject to evaporation. The results indicate that groundwater sampled at Zwavelberg (upper-reaches) exhibits a depleted signature, providing evidence that this is the source/ recharge area in the catchment and that recharge is immediate. This is also expected due to the favourable recharge conditions evident at Zwavelberg, i.e. exposed bedrock, minimal soil cov-ering, higher rainfall and the fractured nature of the TMG. The remainder of the groundwater samples (mid- to lower-reaches) plot below the LMWL and along an imaginary evaporation-line. The evaporation-line represents waters subjected to evaporation after precipitation occurred. This is expected as the PET is approximately 2-3 times greater than the catchment average precipitation. This also indicates that groundwater recharge in the vicinity of these boreholes is delayed and indirect. The samples which plot along the LMWL have undergone minimal or negligible enrichment by evaporation. Also, samples which exhibit high deuterium and oxygen-18 concentrations are interpreted to be representative of a mixture of evaporated and more recent rainwater. Surface water samples generally exhibit an enriched stable isotope signature, which is similar to that observed in groundwater sampled in the mid- and lower-reaches of the catchment. This indicates that the dominant flow contributor is through subsurface flow, i.e. interflow and to a lesser extent baseflow.
The computed PET values, on a water year basis, are shown in Table 3. Data for the 2009 water year is not complete.
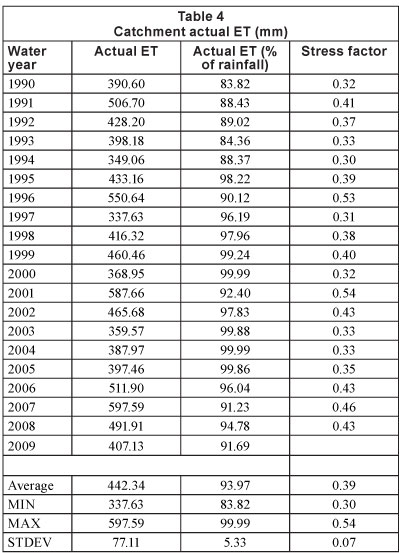
Using a modified version of Eq. (1), the catchment actual ET can be calculated. According to Ward (1972), an assumption that changes in storage are negligible would be valid for an extended time period, i.e. > 3 years. A reduction of the observation period increases the relative importance of the moisture storages within the catchment. The calculated actual ET is presented in Table 4. During the period of observation, the catchment actual ET accounts for, on average, approximately 94% of the water balance. Using the yearly average PET (Table 3) the stress factor was back-calculated and ranged between 0.30 and 0.54. This range of stress factor values may be applicable to similar semi-arid environments. The stress factor correlated well with catchment average rainfall (R2 = 0.76).
Groundwater recharge was calculated using Eqs. (3) and (4). The results are presented in Table 5 (next page). Equations 3 and 4 yielded average estimates of 23 mm.a-1 and 29 mm.a-1, respectively. Large discrepancies were observed between the results from the 2 methods when rainfall was significantly below or above the mean annual average.
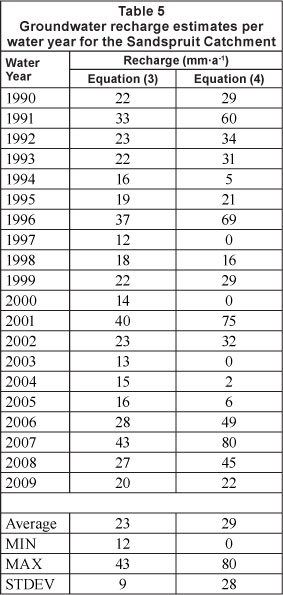
Jovanovic et al. (2009) measured the chloride concentration in groundwater at Zwavelberg (Fig. 6) to be 165 mg-ℓ -1. Total rainfall for the 2009 water year was measured to be 494 mm (Table 2) at Zwavelberg. Bugan (2008) measured the chloride concentration in rainfall in the vicinity of the Sandspruit catchment to be 19 mg ℓ-1, which is in the range of values obtained by Weaver and Talma (2005) for the West Coast. Using Eq. (5), groundwater recharge was calculated to be 57 mm-a-1 during 2009. This is much larger than the 20 mm-a-1 and 22 mrn-a-1 obtained using Eqs. (3) and (4), respectively, for the 2009 water year (Table 5). The applicability of Eq. (5) in the catchment could, however, not be investigated further due to limited data. The sensitivity to rainfall variations exhibited by Eq. (3) (R2 = 0.99) and Eq. (4) (R2 = 0.99) suggests that these may be applicable and representative of the sporadic nature of groundwater recharge in semi-arid areas (DWAF, 2006).
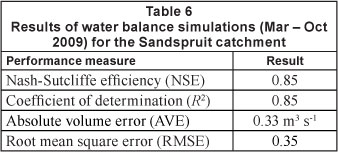
The results of the catchment water balance simulation with J2000 (March - October 2009) are shown in Table 6, Fig. 8 and Fig. 9. The model performed well during the simulation period with all measures of performance exhibiting acceptable values. The model was able to match observed streamflow volumes as well as streamflow response times (Fig. 8). The dominant component of streamflow (Fig. 9) was interflow from the soil horizon (94.68% of streamflow), followed by overland flow (4.92% of streamflow).


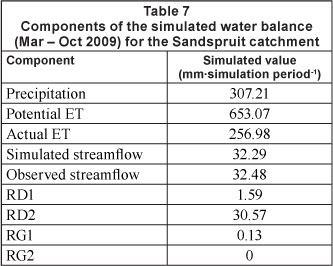
The components for the simulated water balance are shown in Table 7. Equation (1) cannot be solved for the simulation results indicating that there are losses from the catchment, i.e. 17.94 mm. This may be attributed to changes in soil moisture storage over the simulation period.
Data gathered during this investigation allowed for a conceptual flow model to be developed for the Sandspruit catchment (Fig. 10). The catchment receives 473 mm.a-1 precipitation on average (Table 2). Higher rainfall was recorded in the upper reaches of the catchment (494 mm.a-1 at the foot of Kasteelberg), where groundwater recharge mainly occurs through the sandstone fractured rock system, compared to the lower reaches (321 mm.a-1 at DWA station No. G1H043). Streamflow at DWA gauge G1H043 is measured to be approximately 30 mm.a-1 (Table 1). Evapotranspiration makes up the remainder of the water balance (443 mm.a-1), assuming there are no other losses of water, e.g. regional groundwater losses directly through discharge into the Berg River. Soil water and groundwater storage are negligible components of the water balance over extended periods of observation. Seasonal fluctuations of the groundwater potentiometric surface in the catchment measured in boreholes (Jovanovic et al., 2009) suggest that evaporation impacts the groundwater table, and that a seasonal groundwater recharge-discharge mechanism exists.
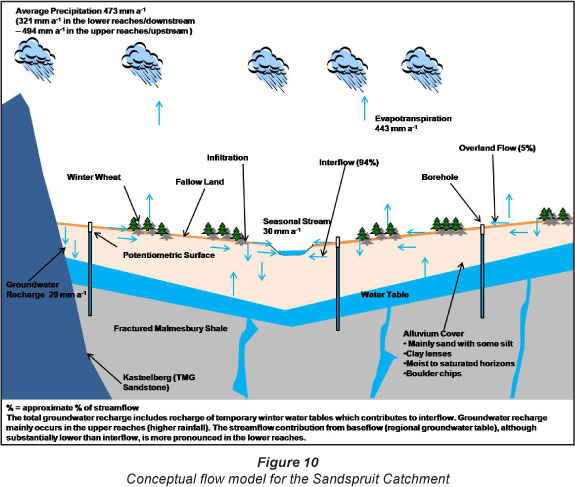
The seasonal nature of the stream and the depth of the water table suggested that the regional groundwater contribution to streamflow is minimal, leaning towards negligible. Streamflow is driven by quickflow, which comprises overland flow and especially interflow from the alluvium cover. Temporary seasonal perched water tables occur at the interface of the alluvium cover and Malmesbury shale with low permeability (Jovanovic et al., 2009). Infiltration is facilitated by preferential pathways created by root channels (winter wheat) as well as the minimisation of overland flow rates by the dense wheat cover (De Cercq et al., 2010). In addition, man-made anti-erosion contours that are common in the area represent micro-areas where overland flow of water is barraged and water infiltrates. The dominant contribution to the stream hydrograph is therefore interflow, originating from the recharge of temporary groundwater tables in winter. This contribution generally occurs until November, about 2 months after the end of the rainy season. As groundwater recharge and discharge is less than streamflow (30 mm.a-1), the historic values of groundwater recharge, of 69-71 mm.a-1 estimated by Vegter (1995) for quaternary catchment G10J, appear to be overestimated (assuming no other groundwater losses occur). The percentage contributions to the hydrograph components (Fig. 10) were estimated using the J2000 hydrological model. In this study, ground-water recharge (interflow + baseflow) was calculated to be 29 mm.a-1 on average. However, this is mainly recharge to temporary winter water tables which contribute to interflow.
Isotope analyses (Fig. 7) indicate that groundwater, in particular in the mid- and lower reaches of the catchment, was subject to evaporation before recharge took place. This is the same water that discharges and predominantly contributes to the stream. The poor correlation between average annual streamflow and average rainfall (R2 < 0.4) suggests that a variety of factors may influence streamflow, e.g. rainfall distribution, cropping systems, evapotranspiration, etc. Streamflow is therefore more dependent on the rainfall distribution in time and water use than on annual rainfall.
Conclusions
The water balance of the Sandspruit River was used to formulate a conceptual flow model for the catchment. Evapotranspiration was found to be the dominant component of the water balance, as it comprises, on average, 94% of precipitation in the catchment. This however is based on the assumption that no further groundwater losses occur and that changes in storage (ground-water and soil water) are negligible. Streamflow was interpreted to be driven by quickflow, i.e. overland flow and interflow, with minimal contribution from groundwater. The large variability of reported baseflow values is indicative of the uncertainty associated with baseflow estimates, particularly in semi-arid areas. The poor correlation between average annual streamflow and average rainfall suggests that alternative factors, e.g. the spatial distribution of winter wheat, the temporal distribution of rainfall, climatic variables (temperature), etc., exert a greater influence on streamflow. Measured streamflow also correlates poorly with calculated actual ET (Table 4, R2 = 0.13). Correlations of observed streamflow (for both above- and below-average precipitation years) with average rainfall and actual ET were also poor. Everson (2001) is of the opinion that, when rainfall is lower than ET, excess water, even in wetter years, is still not sufficient to satisfy the PET and will resultantly not influence streamflow volumes. Streamflow is more dependent on the rainfall distribution in time rather than on the annual volume. These poor correlations could also be a result of inadequate spatial monitoring of climatic variables, particularly rainfall. Unfortunately the data record from stations located inside the catchment (Fig. 6) is not sufficiently long to investigate this. Additionally, errors in measurements should also be considered as a factor.
The water balance and conceptual flow model will form the basis for the application of distributed hydrological modelling in the Sandspruit Catchment and the development of salinity management strategies. The application of distributed hydrological models could be used to further investigate and validate results of this investiga-tion, i.e. quantifying baseflow, groundwater recharge and observed streamflow volumes in particular. It is also interpreted that results, e.g. ET estimates, methods to quantify groundwater recharge, hydrograph separation, etc., from this investigation could potentially be extrapolated to other semi-arid areas.
Acknowledgements
The authors wish to thank the South African Water Research Commission (WRC) and National Research Foundation (NRF) for funding the study, the Department of Water Affairs (DWA) for funding
the drilling and establishment of the boreholes and the Agricultural Research Council for managing the climate stations and providing the data. Gratitude is also extended to the Department of Geoinformatics, Hydrology and Modelling (Fried-rich-Schiller-University Jena, Germany) for providing guidance in hydrological modelling and to the School of Bioresources, Engineering and Environmental Hydrology (University of Kwa-Zulu-Natal, South Africa) for conducting stable isotope analysis.
References
ALEXANDER WJR (1985) Hydrology of low latitude Southern Hemisphere land masses. Hydrobiologia 125 75-83. [ Links ]
ALLEN RG, PEREIRA LS and RAES D (1998) Crop evaporation: guidelines for computing crop water requirements. FAO Irrigation and Drainage Paper No 56. FAO, Rome, Italy. [ Links ]
ANCHOR ENVIRONMENTAL and FRESHWATER CONSULTING GROUP (2007) Berg River baseline monitoring programme. Final report - Volume 5: Synthesis. DWAF Report No. P WMA 19/ G10/00/2107. Department of Water Affairs and Forestry, Pretoria. [ Links ]
BEEKMAN H, GIESKE A and SELAOLO ET (1996) GRES: Groundwater recharge studies in Botswana 1987-1996. Botswana J. Earth Sci. 3 1-17. [ Links ]
BEVEN KJ and O' CONNELL PE (1983) General report on water balance computation techniques. New Approaches in Water Balance Computations, August 1983. IAHS Publ. 148 41-46. [ Links ]
BREDENKAMP DB, BOTHA LJ, VAN TONDER GJ and VAN RENSBURG HJ (1995) Manual on quantitative estimation of groundwater recharge and aquifer storativity. WRC Report No. 73/95. Water Research Commission, Pretoria. [ Links ]
BUGAN RDH (2008) Hydrosalinity fluxes in a small scale catchment of the Berg River (Western Cape). M.Sc. Thesis, University of the Western Cape, Cape Town. [ Links ]
BUGAN RDH, JOVANOVIC NZ, DE CLERCQ WP, HELMSCHROT J, FLÚGEL W and LEAVESLEY GH (2009) A comparative analysis of the PRMS and J2000 hydrological models applied to the Sandspruit Catchment (Western Cape, South Africa). In: Brebbia CA, Jovanovic NZ and Tiezzi E (eds.). Management of Natural resources, Sustainable Development and Ecological Hazards (2nd edn.). WIT Press, Southampton. 391-402. [ Links ]
CLARKE ID and FRITZ P (1997) Environmental Isotopes in Hydrogeology. Lewis Publishers, Boca Raton, New York. [ Links ]
DE CLERCQ WP, JOVANOVIC NZ and FEY MV (2010) Land use impacts on salinity in Berg River water. WRC Report No. K5/1503. Water Research Commission, Pretoria. [ Links ]
DWAF (DEPARTMENT OF WATER AFFAIRS AND FORESTRY, SOUTH AFRICA) 3 September 2008, 2008-last update, hydro-logical services (Homepage of Department of Water Affairs and Forestry). URL: http://www.dwaf.gov.za/hydrology/ (Accessed 27 May 2010). [ Links ]
DWAF (DEPARTMENT OF WATER AFFAIRS AND FORESTRY, SOUTH AFRICA) (2006) Groundwater Resource Assessment II: Final report. Task 3a: Recharge. Department of Water Affairs and Forestry, Pretoria. [ Links ]
DWAF (DEPARTMENT OF WATER AFFAIRS AND FORESTRY, SOUTH AFRICA) (2003) Berg River Baseline Monitoring Project. Description of Geohydrological Conditions. Groundwater Atlas. Department of Water Affairs and Forestry, Pretoria. [ Links ]
EAGLESON PS (1978) Climate, soil and vegetation. Water Resour. Res. 14 (5) 705-776. [ Links ]
ERIKSSON E and KHUNALASEM V (1969) Chloride concentrations in groundwater, recharge rate and rate of deposition of chloride in the Israel coastal plain. J. Hydrol. 7 178-197. [ Links ]
EVERSON CS (2001) The water balance of a first order catchment in the montane grasslands of South Africa. J. Hydrol. 241 110-123. [ Links ]
FEY MV and DE CLERCQ WP (2004) Dryland salinity impacts on Western Cape rivers. WRC Report No. 1342/1/04. Water Research Commission, Pretoria. [ Links ]
HUGHES DA, HANNART P and WATKINS D (2003) Continuous baseflow separation from time series of daily and monthly stream- flow data. Water SA 29 (1) 43-48. [ Links ]
HUGHES JD, KHAN S, CROSBIE RS, HELLIWELL S and MICHALK DL (2007) Runoff and solute mobilization processes in a semiarid headwater catchment. Water Resour. Res. 43 15. [ Links ]
JOTHITYANGKOON C, SIVAPALAN M and FARMER DL (2001)Process controls of water balance variability in a large semi-arid catchment: downward approach to hydrological model development. J. Hydrol. 254 174-198. [ Links ]
JOVANOVIC NZ, BUGAN RDH and SOLTAU LS (2009) Report detailing boreholes in the Sandspruit Catchment. Deliverable 10, WRC Project No. K5/1849. CSIR, Natural Resources and the Environment, Stellenbosch. [ Links ]
KRAUSE P (2002) Quantifying the impact of land use changes on the water balance of large catchments using the J2000 Model. Phys. Chem. Earth 27 663-673. [ Links ]
L'VOVICH MI (1979) World water resources and their future. American Geophysical Union, Washington DC. [ Links ]
MEADOWS ME (2003) Soil erosion in the Swartland, Western Cape Province, South Africa: implications of past and present policy and practice. Environ Sci Policy 6 17-28. [ Links ]
MEYER PS (2001) An explanation of the 1:500 000 general hydro-geological map Cape Town 3317. Department of Water Affairs and Forestry, Pretoria. [ Links ]
MIDDLETON BJ and BAILEY AK (2009) Water Resources of South Africa, 2005 Study (WR2005). WRC Report No. TT 380/08. Water Research Commission, Pretoria. [ Links ]
MIDGLEY DC, PITMAN WV and MIDDLETON BJ (1994) Surface Water Resources of South Africa 1990. Volumes 1-6. WRC Report No. 298/1.1/94 - 298/6.1/94. Water Research Commission, Pretoria. [ Links ]
PARSONS R (1994) A review of approaches and methodologies for determining leachate generation at waste disposal sites and groundwater recharge. WRC Report No. 564/1/94. Water Research Commission, Pretoria. [ Links ]
PARSONS R and WENTZEL J (2007) Groundwater Resource Directed Measures Manual. WRC Report No. TT 299/07. Water Research Commission, Pretoria. [ Links ]
PARSONS RP (1995) A South African aquifer system management classification. WRC Report No 77/95. Water Research Commission, Pretoria. [ Links ]
PONCEA VM and SHETTY AV (1995) A conceptual model of catchment water balance: 1. Formulation and calibration. J. Hydrol. 173 (1-4) 27-40. [ Links ]
RICE K and HORNBERGER GM (1998) Comparison of hydrochemi-cal tracers to estimate source contributions to peak flow in a small, forested headwater catchment. Water Resour. Res. 34 1755-1766. [ Links ]
SCHULZE RE (1997) South African atlas of agrohydrology and climatology. WRC Report No. TT82/96. Water Research Commission, Pretoria. [ Links ]
SIMMERS I (1998) Groundwater recharge: an overview of estimation problems and recent developments. In: Robins NS (ed.) Groundwater Pollution, Aquifer Recharge and Vulnerability. Geological Society Special Publication 130. Geological Society, London. 107-115. [ Links ]
VEGTER JR (1995) An explanation of a set of national groundwater maps. WRC Report No. TT 74/95. Water Research Commission, Pretoria. [ Links ]
VEGTER JR and PITMAN WV (2003) Recharge and Streamflow. In: Xu Y and Beekman H (eds.) Groundwater Recharge Estimation in Southern Africa. UNESCO Paris, Cape Town. 109-122. [ Links ]
WARD RC (1972) Checks on the water balance of a small catchment. Nord. Hydrol. 3 44-63. [ Links ]
WEAVER JMC and TALMA AS (2005) Cumulative rainfall collectors - A tool for assessing groundwater recharge. Water SA 31 (3) 283-290. [ Links ]
WEAVER JMC, CAVÉ L and TALMA AS (2007) Groundwater Sampling (2nd edn.). WRC Report No. TT 303/07. Water Research Commission, Pretoria. [ Links ]
WILSON KB, HANSON PJ, MULHOLLAND PJ, BALDOCCHI DD and WULLSCHLEGER SD (2001) A comparison of methods for determining forest evapotranspiration and its components: sap-flow, soil water budget, eddy covariance and catchment water balance. Agric. For. Meteorol. 106 (2) 153-168. [ Links ]
XU C (1999) Estimation of parameters of a conceptual water balance model for ungauged catchments. Water Resour. Manage. 13 353-368. [ Links ]
XU Y, TITUS R, HOLNESS SD, ZHANG J and VAN TONDER GJ (2002) A hydrogeomorphological approach to quantification of groundwater discharge to streams in South Africa. Water SA 28 (4) 375-380. [ Links ]
Received 16 February 2011;
accepted in revised form 2 April 2012.
* To whom all correspondence should be addressed. +27 21 888-2502; fax: +27 21 888-2682; e-mail: rbugan@csir.co.za

