


Servicios Personalizados
Articulo
 Inglés (pdf)
 Articulo en XML
 Referencias del artículo
Indicadores

Links relacionados
-
 Citado por Google
 -
 Similares en Google
Compartir

 Permalink
Water SA
versión On-line ISSN 1816-7950
versión impresa ISSN 0378-4738
Water SA vol.38 no.1 Pretoria ene. 2012
The extent of on-site leakage in selected suburbs of Johannesburg
MFT LugomaI,*; JE van ZylII; AA IlemobadeIII
IDepartment of Electrical and Mining Engineering, University of South Africa, Private Bag X6, Florida 1710, South Africa
IIDepartment of Civil Engineering, University of Cape Town, Private Bag X3, Rondebosch 7701, South Africa
IIISchool of Civil and Environmental Engineering, University of the Witwatersrand, Private Bag 3, WITS 2050, South Africa
ABSTRACT
This study investigated on-site leakage on 182 properties with relatively new municipal water meters in well-established suburbs of Johannesburg. A methodology was developed to estimate the on-site leakage rate from readings taken from these municipal water meters, which was then adjusted to account for metering errors. The results were analysed in 2 categories: 'Residential'; properties, which consisted of single houses on individual stands, and 'Other'; properties, which consisted of non-residential users and blocks of flats. A high incidence, 64%, of measurable on-site leakage was found. The average on-site leakage rates on 'Residential'; and 'Other'; properties were found to be 12 and 29 kℓ/month per property, respectively. In both cases, this represented 25% of measured consumption. Apparent losses due to on-site leakage were determined to be 10% of the on-site leakage, or 3% of total consumption.
Keywords: extent of on-site leakage, apparent losses, residential and non-residential, suburbs
Introduction
Losses from water distribution systems are a worldwide problem, but are of particular importance in water-stressed countries such as South Africa. The International Water Association (IWA) and other bodies have put in a great deal of effort to understand and manage leakage, although most of this work is focused on municipal water distribution systems and does not consider losses on consumers'; properties. The IWA';s standard water balance, for example, classifies on-site leakage as part of revenue water and not water losses (Farley and Trow, 2003). Municipalities are not responsible for the private systems on which on-site losses occur, and may even benefit from losses in these systems through increased water sales. Thus, there is a limited financial incentive for a municipality to address this problem, even though, from the wider perspective of managing a scarce resource, on-site leakage is just as undesirable as leakage from the municipal distribution system.
A special case exists when on-site losses are excessive and are not paid for by consumers. This can occur where individual users are not metered, users pay a fixed rate not linked to their consumption, or water is not paid for at all. Under these conditions, on-site leakage is a direct loss to the municipality, and it is often financially viable for the municipality to find and repair on-site leaks itself. In South Africa, several examples of such projects have been documented. McKenzie (2002) reported on projects in Kagiso, Tembisa and Hermanus, where on-site leakage was found to vary between 20 and 35% based on the reduction in demand due to plumbing replacement programmes. A similar project in Munsieville in Mogale City (Alliance to Save Energy, 2006) found on-site leakage to be 38% of total consumption based on the reduction in minimum night flow from 45 to 28 kℓ/h.
Comparatively little is known about on-site leakage in higher income suburbs where consumers are individually metered and levels of payment are high. Thus, the purpose of this study was to estimate the extent and levels of on-site leakage in selected higher income suburbs of Johannesburg.
Review of on-site leakage
On-site leakage is leakage that occurs on consumers'; premises. In practice, for metered consumers, this implies all leakage occurring downstream of the consumer';s water meter. On-site leakage includes leaks from elements such as pipes, fittings, taps, toilet cisterns and household appliances.
The IWA proposed a widely-used classification system for water supply systems (Farley and Trow, 2003), which splits the municipal supply into authorised consumption and water losses. On-site losses are considered to be part of authorised consumption, except in instances where this is not measured due to meter under-registration. When this occurs, on-site losses are considered a part of water losses. Meter under-registration is of particular importance for on-site losses since continuous low-intensity leaks will typically fall in the lowest accuracy zone of the water meter, and thus may be substantially under-registered.
A number of previous studies on on-site losses have been published. DeOreo et al. (1996) investigated the water demand of 16 households in Boulder, Colorado. They found that 20% of the households had on-site leakage. Mayer et al. (1999) logged the consumption of 1 188 households in 12 study sites across the USA. They found that a small number of houses were responsible for the majority of the leakage: 67% of the households logged had measurable leaks of 1.6 ℓ/h or less, whilst 5.5% of the households lost an average of 15.8 ℓ/h. They found the magnitude of on-site leakage to be only 14% of consumption on average for all logged households but 24.5% of consumption for the 5.5% of households with higher leakage rates.
Another study was conducted in Spain, on 64 households, by Arregui et al. (2006). It was found that most measurable on-site leakage rates ranged between 2 and 40 ℓ/h, with some leaks being as high as 100 ℓ/h. Similarly, Gascón et al. (2004) found an average residential leakage rate of 17.0 ℓ/h per property while studying water consumption patterns in 4 different Spanish cities. The on-site leaks represented 8.9% of the average daily consumption.
In Namibia, Fourie (2004) investigated water use and leakage patterns on residential properties in the cities of Windhoek and Swakopmund. He found that 20% and 9% of residential properties had leakages in Windhoek and Swakopmund, respectively, with average leakage rates of 20.3 ℓ/h and 9.0 ℓ/h.
Finally, Britton et al. (2009) reported the results of a study on on-site leakage using smart metering in Hervey Bay in Queensland, Australia. Smart metering gives a 'trickle alert'; when continuous flow is measured for more than 48 hours. Britton et al. (2009) found on-site leakage on only 3.5% of 23 631 m investigated. Presumably, the low incidence of on-site leakage is a consequence of home owners being informed of trickle alerts on a regular basis. The average leakage rate of leaking residential properties was however found to be 30.8 ℓ/h.
Methodology
In this study, on-site leakage was estimated using household municipal water meters. As water meters age, their accuracy tends to decrease and their starting flow tends to increase(Rizzo and Cilia, 2005), making them less suitable for measur ing small leakage flow rates. Thus, the study only investigated properties with relatively new water meters.
Study area
Johannesburg Water assisted the project by providing a list of 233 properties with water meters less than 5 years old. The water meters of these properties were mostly replaced because of meters breaking down or customer complaints. It was assumed that the selection process did not introduce any bias in the sample.
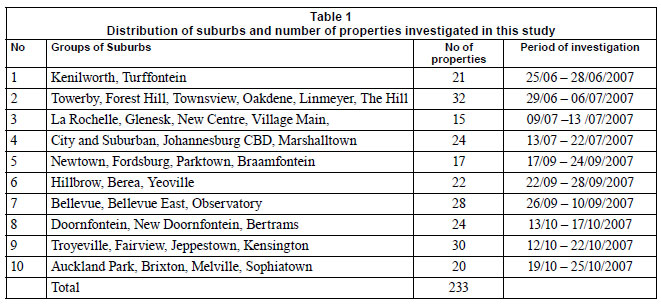
The properties were all situated in well-established suburbs in Johannesburg with a high level of services provided. No low-income areas or informal settlements were studied. Suburbs close together were grouped for the purpose of this investigation. A summary of the suburb groups, number of properties in each group and the investigation periods is given in Table 1.
The water meters in these areas consisted of rotary piston meters (80% of the total), with the remainder being a mix of single-jet, multi-jet and Woltmann inferential meters. The diameters of the meters ranged from 15 mm to 80 mm, with 80% of the meters being 15 mm, and less than 4% were 40 mm or larger.
Measurement of on-site leakage
To ensure that on-site leakage measurements did not include any legitimate water consumption, the following procedure was used when taking leakage measurements:
• The property occupants were given advance notice of the details and planned date of the investigation on their properties.
• On the day of the leakage reading, the doorbell of the property was rung and the occupant asked to turn off all water fixtures for the duration of the test. Where the occupant was not present, it was assumed that the consumption at the property was zero. All visits were made between 9:00 and 13:00.
• An initial reading was taken on the water meter, and then at least 2 subsequent readings at 5-min intervals were taken until a steady picture of the leakage rate emerged.
• If a leak flow was identified, the procedure was repeated on a different day and at a different time. The measured flows were only taken as leakage if there was consistency between the results of the 3 visits. However, if the first visit did not identify any leakage, no subsequent visit was made.
Leakage readings were only possible on 182 (79%) of the 233 meters initially identified. This was due to various reasons including meters that could not be located, or were unreadable, faulty or inaccessible.
Data processing
The processing of the results consisted of 2 phases: the first to check the data for inconsistencies and the second to adjust them for meter under-registration. The latter phase was also used to estimate the level of apparent losses caused by meter under-registration.
Various reasons exist for inconsistencies in leakage readings, including pressure variations and transients in the distribution system, reading errors and user consumption. Leaks from certain fixtures such as taps can be expected to vary depending on how well the occupants closed the fixture after the last use. In addition, it was clear that leaks were not constant, but often varied between one visit and the next. It is possible that leaks increased between visits due to a deterioration of the system or the creation of new leaks. On the other hand, the occupants of a property may discover a leak and have it fixed between visits. In many cases, this was confirmed by the occupants when a reduction in the leakage was observed.
To ensure that inconsistencies in the data were identified and dealt with consistently, an acceptable range was determined around the average leakage rate. This was done by allowing for reading accuracies of time (0.5 s) and volume (the smallest reading interval of the meter, 0.0001 kℓ), and an allowance of 10% of the average leakage rate due to pressure variations. If leakage values at a given meter fell outside of this range, the reading furthest from the average was removed, and the process repeated. This procedure resulted in the removal of 4% of the 1 079 readings taken. Finally, each property record was checked to ensure that it contained at least 4 valid leakage readings and at least 1 valid reading from each visit.
The second data processing phase considered the accuracy of the water meters used to record the leakage. Municipal household water meters are sized for typical consumption flow rates and are least accurate when measuring small flows. This means that the smallest leaks will not be measured at all, and that slightly larger leaks will be significantly under-registered. These flows that are delivered to the user but are not accurately registered on the meter, contribute to apparent losses in the system and thus result in a direct loss of income for the municipality.
The water meters were conservatively assumed to have the same accuracy as when new, and the manufacturer';s accuracy data for new meters were used as the basis for this analysis. For each meter, the starting flow rate Qs (the lowest flow rate that will produce a reading on the meter), minimum flow rate Qs (the flow rate where the relative error of the meter enters the 5% band), and transitional flow rate Qt (the flow rate where the relative error of the meter enters the 2% band) were obtained. In a few cases, the manufacturers did not specify the starting flow rate of the meter, and a value was guesstimated. Figure 1 shows a typical accuracy curve for a water meter, with an accuracy envelope that the meter has to comply with. The normal or permanent flow rate, Qn, which is defined as the design flow rate of the meter, and the maximum flow rate, Qmax, that the meter can handle for short periods without sustaining damage, are also indicated.
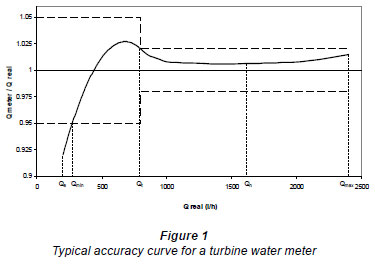
A parabolic curve was fitted, Qs and Qt, to represent the meter';s accuracy curve between the starting and transitional flow rates.
The meter accuracy curves between the starting and transitional flow rates were then plotted to allow the real flow rate to be determined from the measured flow rate. The following rules were used for this correction:
• If the measured flow rate was less than the starting flow rate of the meter, the actual flow rate was set to the starting flow rate.
• If the measured flow rate was between the starting and transitional flow rate, the actual flow rate was estimated based on the parabolic accuracy curve described above.
• If the measured flow rate was greater than the transitional flow rate, no adjustment was made to the measured rate.
An estimate of the under-registration loss can be made by comparing the leakage rates before and after corrections for meter accuracy, where on-site leakage was found. The estimate of theunder-registration was computed by subtracting the corrected leakage rates from the measured rates.
Verification
Finally, 2 checks were conducted to verify the results: a third visit was made to selected properties and the leakage readings were compared to the total measured consumption of the properties. These visits were made to selected properties about 1 year after the initial and follow-up visits. The 2 properties with the highest leakage rates were selected, as well as other properties to make up 10% of the original sample size. While certain leakage rates were different (as can be expected) from the previous two, the third visit clearly showed that the results gave an accurate measure of on-site leakage. The comparison of the on-site leakage rates to the measured consumption of the properties investigated showed that the measured values were reasonable in terms of the total water consumption on the properties.
Results and discussion
The results of the study are presented in 3 parts. In the first part, the occurrence and distribution of on-site leakage is presented. In the second part, on-site leakage as a function of the total demand is presented, while in the third part apparent losses are presented. The properties are categorised into 'Residential'; and 'Other'; properties, with 'Residential'; properties consisting of single residential houses on individual stands, and 'Other'; properties consisting of non-residential users and blocks of flats. The 'Residential'; category contained 70% of the properties investigated, and the 'Other'; category 30%.
Occurrence and distribution of on-site leakage
The results are presented in Table 2. The results show that 64% of the 182 properties investigated had measurable on-site leakage present. The leakage incidence was higher for 'Residential'; properties (67%) than 'Other'; properties (57%). These figures are surprisingly high considering that the investigation focussed on established suburbs with water meters less than 5 years old, and did not include low-income areas and informal settlements.
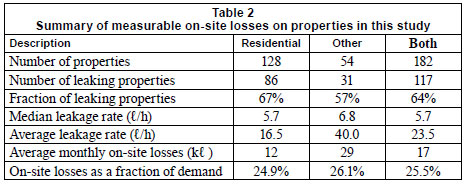
The average leakage rate for all properties was 23.5 ℓ/h, which translates into a monthly on-site leakage of 17 kℓ. While 'Other'; properties had a lower leakage incidence, they showed a higher average leakage rate, of 40.0 ℓ/h (29 kℓ/month), than 'Residential'; properties, which showed a leakage rate of 16.5 ℓ/h (12 kℓ/month).
Blocks of flats were found to be a particular problem with 81% of the 21 blocks of flats investigated showing measureable on-site leakage, and an average leakage rate of 59.0 ℓ/h. The number of flats within the blocks was not considered and hence the average leakage rate per flat was not determined.
The distribution of the measured on-site leakage rates is similar to that reported in other studies, with most properties showing little on-site leakage, and a few properties with large leakage rates.
This can be seen from the frequency distributions of the leakage rates of properties with measured on-site leakage, shown in Figs. 2 and 3 for 'Residential'; and 'Other'; properties, respectively. These results imply that the average on-site leakage can be reduced significantly by fixing the leaks on a few properties with very large leaks. For instance, fixing the on-site leaks in the top 10% of properties (i.e. 10% of the properties with the highest leakage flow rates) would reduce the average on-site leakage rate by almost two-thirds (63%) in both categories.
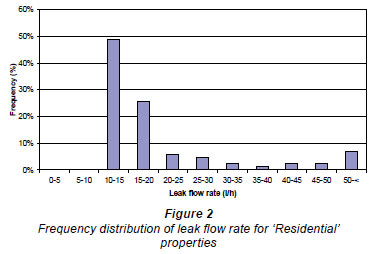
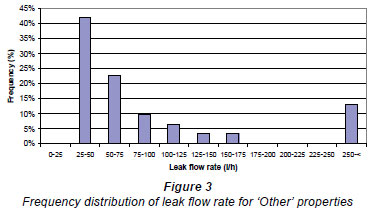
The apparent lack of on-site leaks below 10.0 ℓ/h in 'Residential'; properties, and below 25.0 ℓ/h for 'Other'; proper ties, is due to the typical starting flow rates of the water meters. Leakage rates in these ranges were too low to be registered by the meters. However, judging from the trends shown in Figs. 1 and 2, it seems likely that the majority of properties where no leaks were measured may well have on-site leakage, but at rates that were too small to be detected.
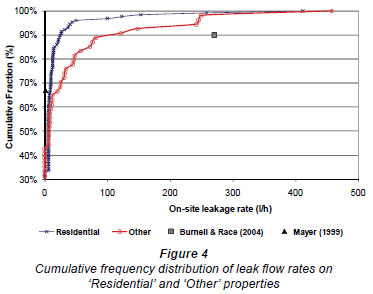
The cumulative frequency distributions of on-site leakage for 'Residential'; and 'Other'; properties are shown in Fig. 4, which clearly shows the notably higher leakage rates of 'Other'; properties. The figure also shows the substantial difference between the leakage rates of properties with high and typical on-site losses. Data points from 2 other studies (Mayer, 1999; Burnell and Race, 2004) are also shown on the graph, as the results of similar on-site leakage patterns observed in the USA and the UK.
On-site leakage component of total consumption
To put the on-site leakage rates into perspective, the average water demand of each of the properties in the study was obtained from water meter readings made by Johannesburg Water. The estimate of the average monthly demand for water in each property was calculated from the annual average daily demand (AADD) extracted from the Sewer Water Interface to Treasury (SWIFT) database. The on-site leakage for each property was then calculated as a fraction of the consumption.
The average consumptions of all of the 'Residential' and 'Other' properties were found to be 45 and 110 kℓ per month, respectively. The average leakage fraction of these demands was found to be remarkably similar, at 24.9 and 26.1%, respectively, or essentially a quarter of the measured consumption. This is significantly higher than the value of 14% found by Mayer et al. (1999) in the USA for 1 188 properties or 8.9% by Gascón et al. (2004) in Spain for 64 properties, both residential.
Apparent losses due to meter under-registration
Under-registration of water meters is classified as an apparent loss, since it represents legitimate consumption (including on-site leakage) that is not measured, and thus is effectively a loss to the municipality. Since on-site leakage typically has continu ous but low flow rates that fall in the lowest accuracy region of the flow meter, a significant fraction of on-site leakage will not be picked up by the water meter.
The adjustment of on-site leakage values for water meter accuracy was used to estimate the apparent losses due to on-site leakage for the investigated properties. The average under-registration of on-site leakage for all 'Residential'; and 'Other'; properties was 1.7 and 4.6 ℓ/h, respectively, which is equivalent to 1.2 and 3.3 kℓ/month. For both categories, the under-registration of on-site leakage represents 10% of the on-site leakage and 3% of the total measured consumption.
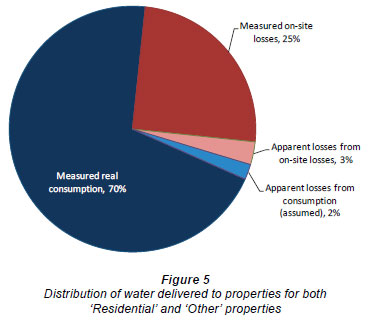
The component of apparent losses caused by under-registration of water demand was not measured, but was assumed as 2% for the purposes of this paper (McKenzie and Seago, 2007). This allows the distribution of all of the water delivered to properties in this study to be estimated and presented in Fig. 5. The distributions for 'Residential'; and 'Other'; properties were virtually identical, and thus only 1 distribution is given. The figure shows the apparent losses to be 5% of total water delivered, 70% of legitimate consumption, and 25% of measured on-site losses.
Conclusions
The study investigated on-site leakage on 182 randomly-selected properties in a number of higher- and medium-income suburbs in Johannesburg. The investigation was based on measurements taken from relatively new municipal water meters. The methodology developed ensured that readings did not include legitimate consumption but only reflected water loss where occurring.
It was found that a high percentage of properties (64%) had measurable on-site leakage. The prevalence of leakage was higher for 'Residential'; properties (single houses on individual stands), with 67% of properties having on-site leakage, compared to 'Other'; properties (non-residential and blocks of flats), with 57% of properties having on-site leakage.
The distribution of the measured on-site leakage rates is similar to those reported in other studies, with most properties showing little on-site leakage, and a few properties with large leakage rates. It was found that the average on-site leakage rate in this study could be reduced by almost two thirds by fixing the leaks in the highest 10% of properties. The average on-site leakage rates for all 'Residential'; and 'Other'; properties were found to be 12 and 29 kℓ/month, respectively, or roughly a quarter of measured demand in both categories. The apparent losses to the municipality caused by the under-registration of leakage by meters were estimated to be 10% of on-site leakage and 3% of measured consumption for both categories.
On-site leakages are not necessarily a concern of the municipality, since most of this 'lost water'; is paid for. However, these losses are critical to address from a water resources point of view. It is recommended that the reduction of on-site leakage be included as a benchmark for municipalities and bulk water suppliers in order to create an incentive for them to address these losses.
The causes of on-site leakage were not directly investigated in this study but some reported studies, such as DeOreo et al. (1996), found that toilet cisterns were the fixtures which leaked the most. In addition, Lobanga et al. (2009) showed that about 50% of plumbing components installed in South Africa were non-compliant with SABS and highlighted that water loss is a major consequence of non-compliant components.
It is recommended that municipalities take cognisance of the high prevalence of on-site leakage and the potential impact on their revenue due to significant under-registration of water meters at these flow rates. Home owners are generally unaware of on-site leakage on their properties, and thus a public awareness campaign may be a cost-effective starting point for reducing levels of on-site leakage.
Aknowledgements
The authors gratefully acknowledge the Water Research Commission (WRC) of South Africa for funding the project and also Johannesburg Water (Pty) Ltd and GLS Consulting(Pty.) Ltd. for data.
References
ALLIANCE TO SAVE ENERGY (2006) Munsieville Private Property Leak Repair Project - Close-Out Report. September 2006. [ Links ]
ARREGUI F, CABRERA E and COBACHO R (2006) Integrated Water Meter Management. IWA Publishing, London. [ Links ]
ARREGUI F, PALAU CV, GASCÓN L and PERIS O (2003) Evaluating Domestic Water Meter Accuracy. A Case Study. Balkema, Spain. [ Links ]
BRITTON T, STEWART RA and WISKAR D (2009) Smart metering as a tool for revealing the characteristics of household leakage during a typical reading cycle. Proc. IWA Efficient 2009 Conference. Australian Water Association. [ Links ]
BURNELL D and RACE J (2004) Water distributions systems analysis: Patterns in supply-pipe leakage. Proc. ASCE Conference, 27 June - 01 July 2004, Salt Lake City, UTHA, USA. [ Links ]
DEOREO WB, HEANEY JP and MAYER PW (1996) Flow trace analysis to assess water use. AWWA J. 88 (1) 79-90. [ Links ]
GASCÓN L, ARREGUI F, COBACHO R and CABRERA E (Jr.)(2004) Urban water demand in Spanish cities by measuring end-uses consumption patterns. Paper presented at the Water Sources Conference, 11 January 2004, Austin, USA. [ Links ]
FARLEY M and TROW S (2003) Losses in Water Distribution Networks: A Practitioner';s Guide to Assessment, Monitoring and Control. IWA Publishing, London. [ Links ]
FOURIE GW (2004) Leakage management on plumbing systems in households and on government properties. Draft Report prepared for SIDA, Namibia. [ Links ]
JACOBS HE and HAARHOFF J (2004) Application of a residential end-use model for estimating cold and hot water demand, wastewater flow and salinity. Water SA 30 (3) 305-316. [ Links ]
LOBANGA KP, VAN ZYL JE and ILEMOBADE AA (2009) The extent of non-compliant plumbing components used in South Africa. Water SA 35 (2) 175-182. [ Links ]
MAYER PW, DEOREO WB, OPITZ EM, KIEFER JC, DAVIS WY, DZIEGIELEWSKI B and NELSON JO (1999) Residential End Uses of Water Study. AWWA Research Foundation and American Water Works Association, Denver. [ Links ]
McKENZIE RS and SEAGO CJ (2007) Assessment of Non-Revenue Water in South Africa. WRC Report No. 300/07. Water Research Commission, Pretoria. [ Links ]
McKENZIE RS, WEGELIN WA and MEYER N (2002) Leakage reduction projects undertaken by Rand Water. Rand Water in association with UN-Habitat, South Africa. [ Links ]
RIZZO A and CILIA J (2005) Quantifying meter under-registration caused by the ball valves of roof tanks (for indirect plumbing systems). Leakage 2005 - Conference Proceedings, Water Loss 2005, Volume III. IWA Publishing, Halifax Nova Scotia. [ Links ]
UK WATER INDUSTRY (1994) Managing Leakage, Report E - Interpreting Measured Night Flows. UK Water Industry, London. [ Links ]
VAN ZYL JE and HAARHOFF J (2007) Reliability of municipal storage reservoirs using stochastic analysis. J. S. Afr. Inst. Civ. Eng. 49 (3) 27-32, Paper 639. [ Links ]
VAN ZYL JE, LOBANGA KP, LUGOMA FT and ILEMOBADE AA (2008) The State of Plumbing in South Africa. Draft Report for WRC Project No. K5/1702. Water Research Commission, Pretoria, South Africa. [ Links ]
WALKER N, ERSKINE S, STILL D and HAZELTON D (2007) The Status of Potable Water Efficient Devices in Domestic and Commercial Environments in South Africa. WRC Report No. K5/1606. Water Research Commission, Pretoria. [ Links ]
Received 22 September 2010; accepted in revised form 14 December 2011.
* To whom all correspondence should be addressed. +27 11 471 3481; fax: +27 86 541 4519; e-mail: lugommf@unisa.ac.za

