


Services on Demand
Article
 English (pdf)
 Article in xml format
 Article references
Indicators

Related links
-
 Cited by Google
 -
 Similars in Google
Share

 Permalink
Water SA
On-line version ISSN 1816-7950
Print version ISSN 0378-4738
Water SA vol.38 n.1 Pretoria Jan. 2012
Identification of metal-tolerant organisms isolated from the Plankenburg River, Western Cape, South Africa
VA JacksonI,III; AN PaulseI,II; JP OdendaalII; S KhanI; W KhanIII,*
IDepartment of Biomedical Sciences, Faculty of Health and Wellness Sciences, Cape Peninsula University of Technology, Bellville 7535, South Africa
IIDepartment of Environmental and Occupational Studies, Faculty of Applied Sciences, Cape Peninsula University of Technology, Cape Town 8000, South Africa
IIIDepartment of Agricultural and Food Sciences, Faculty of Applied Science, Cape Peninsula University of Technology, Cape Town 8000, South Africa
ABSTRACT
The ability of biofilms to resist pollutants makes them advantageous for use in bioremediation. The objective of this investigation was to isolate metal-tolerant micro-organisms from a site along the Plankenburg River. Microbial biofilms cultivated in multi-channelled flow cells were exposed to varying concentrations of aluminium (Al), iron (Fe), copper (Cu), manganese (Mn), nickel (Ni) and zinc (Zn), stained with the BacLightTM viability probe, visualised using epifluorescence microscopy and analysed using ScionImage. Exposure to the highest Al, Fe, Cu and Mn concentrations increased the percentages of dead cells. A difference in live and dead cells after exposure to varying Zn and Ni concentrations was not evident. When exposed to the lowest concentrations, no notable difference could be detected in comparison with the untreated control. Possible metal-tolerant micro-organisms were identified from the exposed flow cells using polymerase chain reaction (PCR) and deoxyribonucleic acid (DNA) sequencing, followed by ClustalX alignment and phylogenetic analysis. Phylogenetic analysis identified a variety of organisms, including Bacillus sp., Pseudomonas sp., Delftia tsuruhatensis strain A90, Kocuria kristinae strain 6J-5b, Comamonas testosteroni WDL7, Stenotrophomonas maltophilia strain 776, Staphylococcus sp. MOLA:313, Micrococcus sp. TPR14, Sphingomonas sp. 8b-1 and Microbacterium sp. PAO-12. Two major clusters could be distinguished based on their Gram-reactions.
Keywords: BacLightTM viability probe, biofilms, phylogenetic analysis, river water, ScionImage
Introduction
Population growth and urbanisation results in increased water resource utilisation. Continued deposition of point- and non-point source pollutants, including those originating from industrial effluents , agricultural runoff , leaking sewers, on-site sanitation at informal housing and waste irrigation (DEAT, 1996), amongst others, adversely affects the surrounding environment. Metal contamination in the environment can also be attributed to the natural occurrence of metals in soil, atmospheric deposits and the corrosion of building materials (Maanan et al., 2004). The metals most commonly associated with most river water systems are lead (Pb), copper (Cu), iron (Fe), cadmium (Cd), aluminium (Al), mercury (Hg), arsenic (As) and manganese (Mn) (Wright and Welbourne, 2002). Zinc (Zn), nickel (Ni), As, Hg, cobalt (Co) and Mn concentrations were studied in water and fish samples isolated from the Aba River, Nigeria, into which waste from various industries is discharged. Atomic absorption spectrometry (AAS) analysis revealed elevated concentrations of Zn, Mn and As in fresh fish and elevated Ni and Hg concentrations in frozen fish found in a nearby market (Allinnor, 2005).
In water and the environment, micro-organisms exist mostly as biofilm communities attached to surfaces; microbial biofilms exhibit high affinities for contaminants due to the ability of the exopolymers to bind and sequester antimicrobial agents from the surrounding environment (Teitzel and Parsek, 2003). Biofilms have been shown by Roane and Pepper (2000) to be one of the most effective treatments for the removal of metals from metal-contaminated water.
Flow cell systems have been used to cultivate microbial biofilms in vivo (Caldwell et al., 2002). They are multi-channelled to allow for experimental replication and simplified handling. Teitzel and Parsek (2003) used a flow cell system to visualise the behaviour of biofilm-bound micro-organisms in response to Cu and Zn. Confocal laser scanning microscopy (CLSM) analysis revealed that the majority of cells in the outer layers were dead, in comparison to the untreated control, where the majority of cells were alive.
Microbial composition can be determined genetically, through the amplification of the 16S or 23S rRNA region of the genomic DNA, using specific primers (Amann, 1995). The diversity of tolerant micro-organisms depends on nucleotide sequence variations (Martin, 2002), ranging from 20% to 80% G+C (Ochman et al., 2005) among individual species sharing common ancestry. This genetic variation can then be visualised with phylogenetic trees (Martin, 2002).
Chien et al. (2007) studied the microbial diversity in soil contaminated with effluent from a chemical industrial factory, using 16S rDNA. The organisms isolated were Polyangium spp., Sphingomonas spp., Variovorax spp., Hafina spp., Clostridia, Acidobacteria, the enterics and some uncultured strains. Acinetobacter, Enterobacter and Stenotrophomonas spp. also exhibited the ability to tolerate high concentrations of Cd.
The objective of this investigation was to isolate metal- tolerant micro-organisms from a metal-contaminated site along the Plankenburg River. The micro-organisms were cultured and isolated in flow cell systems after exposure to varying metal concentrations, identified using the polymerase chain reaction (PCR) technique and analysed phylogenetically.
Materials and methods
Site description
A previous study identified 4 sampling sites along the Plankenburg River (Fig. 1) (Jackson et al., 2009). These sites included Site A (Agricultural farming and residential areas) and Site B (Industrial area at Adam Tas Bridge). Results from this study showed that the highest concentrations of metals were recorded at Site C (Substation in the industrial area), which is why this particular site was selected to investigate the efficiency of the bioreactor systems to reduce metal concentrations in the river water. Ten litres of river water was collected from Site C (Fig. 1) in a 10 ℓ plastic container and transported at 4ºC.

Metal concentrations in river water
To determine the concentrations of Al, Cu, Fe, Mn, Ni and Zn in water, 5 mℓ samples were digested with 10 mℓ 55% nitric acid at 40ºC for 60 min and then at 120ºC for 180 min, using a Grant dry-block heater. A blank (control) of 10 mℓ 55% nitric acid was analysed along with the collected samples to check for possible contamination. The samples were cooled to room temperature, filtered with Whatman No. 6 filter paper into 20 mℓ volumetric flasks, made up to a volume of 20 mℓ with distilled water and subsequently filtered for a second time using 0.45 mm cellulose nitrate ultrafiltration membrane filters (Whatman) (Odendaal and Reinecke, 1999). Metal concentrations were determined using inductively coupled plasma atomic emission spectrometry (ICP-AES) analysis according to the procedure outlined in Saleh et al. (2000).
Flow cell experiment
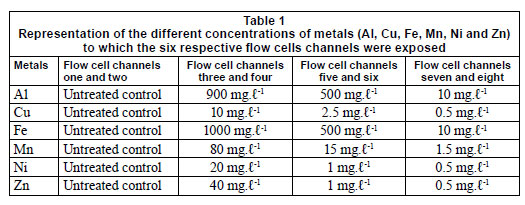
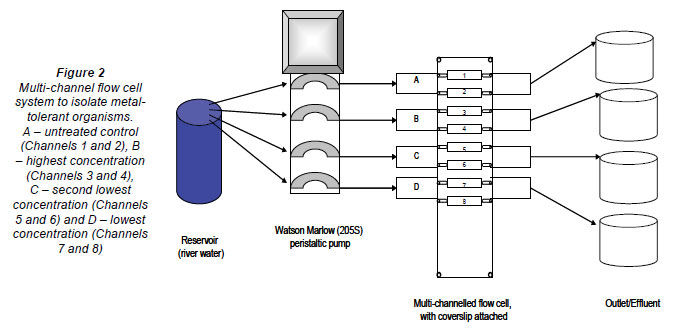
Six multi-channelled (8 channels) flow cells were constructed from Perspex, a glass coverslip and silicone tubing. The flow channels were 5 mm wide, 30 mm long, 3 mm deep and a distance of 4 mm from the next channel. The glass coverslip (50 mm x 75 mm) was secured to the top of the flow cell with marine silicone glue and provided an attachment surface for the microbial growth. Silicone tubing (1.6 mm) was used for the flow through the respective channels from the reservoirs (influent - collected river water) to the outlet (effluent). After construction, the flow cells were sterilised with a solution of sodium hypochlorite and flushed with distilled water (Fig. 2). The collected river water was pumped through the flow cell systems, using a Watson Marlow peristaltic pump (205S) (Watson Marlow Limited, Cornwall, England), to ensure a constant flow rate at 2 r·min-1. After a 3-week period, which allowed for maximum biofilm growth, the channels were exposed to varying metal concentrations. Each flow cell was exposed to different concentrations of Al, Fe, Cu, Mn, Ni and Zn (Table 1), based on concentrations recorded during a previous study (Jackson et al., 2009). The first 2 channels of each flow cell were not exposed to any metals and served as the controls. Each flow cell channel was exposed to the respective metal concentra tions for 6 h, while the peristaltic pump was switched off and the tubing was clamped.
Exposure to the BaclightTM viability probe
After the 6-h metal exposure period, one of each channel spiked with the respective metal concentrations, as well as one of the unexposed control channels, was stained with the multifluor LIVE/DEAD BaclightTM fluorescent viability probe (invitrogen - Molecular ProbesTM, Oregon, USA). The stain was prepared by mixing 4 µg·ℓ-1 of the green fluorescing probe (SYTO 9) with 4 µg·ℓ-1 of the red fluorescing probe (propidium iodide) and 1 mℓ of distilled water. The probe was allowed to attach to the cell surfaces of the biofilm organisms for a period of 20 min. After the attachment period, the pump was switched on to remove any excess dye. The channels not exposed to the probe were flushed by turning the pump up to its maximum flow rate of 90 r·min-1 in order to dislodge the attached biofilm growth. This microbial suspension was collected into indi vidual 50 mℓ Schott bottles.
Microscopy and image analysis
Epifluorescence microscopy was used in conjunction with the LIVE/DEAD BacLightTM probe (invitrogen - Molecular ProbesTM, Oregon, USA) in order to provide total cell counts, using images based on the relative abundance of micro organisms (Boulos et al., 1999). The images were visualised and captured using the Zeiss Axiovert 200 motorised fluorescence microscope, which contains the Dapi, Alexa, Cy3, GFP and Cy5 laser lines. It is also equipped with a monochrome Zeiss Axiocam HR digital camera. The 100X, 1.4 NA oil immersion objective was used to visualise the biofilm, along with an argon laser exciting the fluorophores. Ten randomly- captured images along the surfaces of the attached coverslip were obtained from each of the exposed channels using the Axiovision 4.6 Software Programme (Zeiss imaging systems), which was further used for viewing and simple image processing. Ten images were randomly captured along the surfaces of the coverslips and the percentage area covered by living and non-living biomass was determined using ScionImage Analysis (Scioncorp.com). These techniques were performed in duplicate and the results obtained were the averages of the replicates.
DNA extraction and agarose gel electrophoresis
The flushed material, obtained from the unstained flow cell channels for each respective metal, was spread-plated onto nutrient agar plates and incubated at 37ºC for 2 days. Single colonies were then selected in order to isolate pure cultures and DNA was extracted using the High Pure PCR Template Preparation Kit, as per the manufacturer';s instructions (Roche Diagnostics GmbH, Mannheim, Germany). Ten microlitres of the extracted DNA samples were electrophoretically analysed on a 0.8% molecular grade agarose gel containing 12 µℓ of 0.5 µg/mℓ ethidiumbromide (EtBr), using 1 x Tris-acetate- ethylenediamine tetraacetic acid (TAE) electrophoresis buffer at 90 V for 1 h.
Polymerase chain reaction (PCR)
Amplification of target DNA by PCR was performed in a total reaction volume of 50 µℓ containing 10 mM dNTP Mix (1 µℓ), 25 mM MgCl2 (3 µℓ), 10X Taq Buffer with (NH4)2SO4 (5 µℓ), 10 µM forward (fDD2 - CCGGATCCGTCGACAGAGTTTGATCITGGCTCAG) (5 µℓ), 10 µM reverse (rPP2 - CCAAGCTTCTAGACGGITACCTTGTTACGACTT) (5 µℓ) (Rawlings, 1995), Taq DNA polymerase (1 µℓ) (5 µg·5 µℓ-1) (Fermentas Life Sciences, EU), 1 µℓ of a concentrated DNA sample and 29 µℓ sterile distilled water. The amplification process included an initial denaturation step of 94ºC for 2 min, followed by 30 cycles of amplification (1 min at 94ºC, 1 min at 57ºC and 2 min at 72ºC). This was followed by a final extension step of 72ºC for 10 min. Ten microlitres of the subsequent PCR amplicons were then electrophoretically analysed on a 0.8% molecular grade agarose gel containing 12 µℓ of 0.5 µg·mℓ-1 EtBr, using 1 x TAE electrophoresis buffer at 100 V for 1 h, to determine whether amplification was successful.
Sequencing of 16S rRNA
The amplified PCR products (1 200 bp) were purified using a High Pure PCR product purification kit, as per manufacturer';s instructions (Roche Diagnostics GmbH, Mannheim, Germany). The concentrations of the DNA samples were determined using spectrophotometry and 15 µℓ of concentrated DNA (50 to 100 ng·µℓ-1 depending on the length) samples were loaded onto 96-well microtitre plates, dried in a speed vac, with medium heat, for 30 to 60 min (depending on the volumes), and sent for sequencing. The sequencing lab used the Applied Biosystems Big Dye Terminator v3.1.
Phylogenetic analysis
The resultant sequences were identified with a similarity search using Blastn from the National Centre for Biotechnology Information (NCBI) (Altschul et al., 1997). Contiguous sequences were formed for the forward and reverse sequences of a particular organism, using the CAP3 Sequence Assembly Programme (Huang and Madan, 1999). The contiguous sequences were aligned with ClustalX (1.81) (Higgins and Sharpe, 1988) using default parameters and the BLOSUM matrix, which corrects for multiple base changes. There were 37 organisms isolated overall, but many of the isolates were identical, therefore the 13 representative organisms on the tree were used for phylogenetic analyses. An unrooted tree was constructed using the neighbour-joining program of Saitou and Nei (1987). Phylogenetic analysis was conducted using Molecular Evolutionary Genetics Analysis, Version 3.1 (MEGA version 3.1) (Kumar and Nei, 2004). To estimate the node reliability, bootstrap values were obtained from 1 000 randomly- generated trees. Trees were visualised using MEGA version 3.1 (Kumar and Nei, 2004).
Results and discussion
Metal concentrations in river water
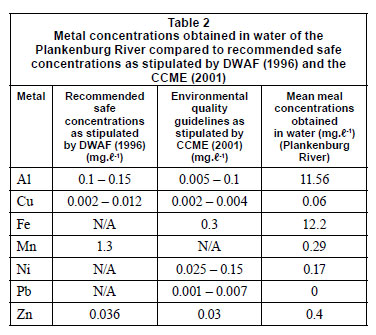
Inductively coupled plasma atomic emission spectrometry (ICP-AES) was used to determine the initial concentrations of metals in the collected river water prior to the flow cell set-up. These concentrations were compared to the Department of Water Affairs and Forestry (DWAF) (1996) and the Canadian Council of the Ministers of the Environment (CCME) (2001) recommended guidelines (Table 2). The Al, Cu, Fe, Ni and Zn concentrations were 11.6 mg·ℓ-1, 0.06 mg·ℓ-1, 12.2 mg·ℓ-1, 0.17 mg·ℓ-1 and 0.4 mg·ℓ-1, respectively (Table 2). These concentra tions were above the recommended concentrations as stipulated by DWAF (1996) and the CCME (2001). The Mn concentration of 0.29 mg·ℓ-1, was below the recommended concentration of 1.3 mg·ℓ-1 (1996).
Flow cell experiment and image analysis
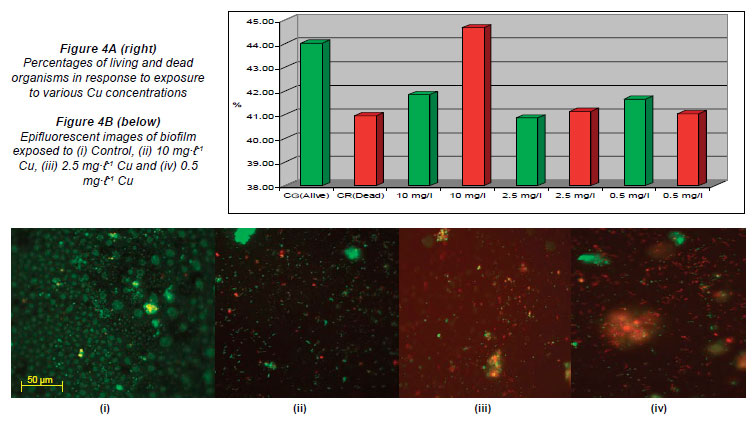
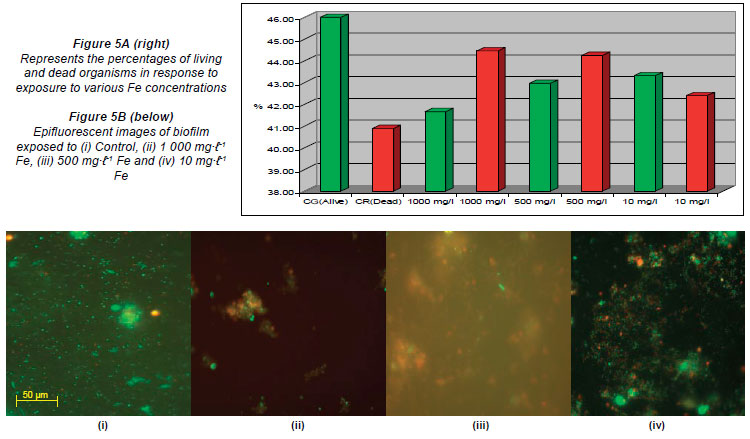
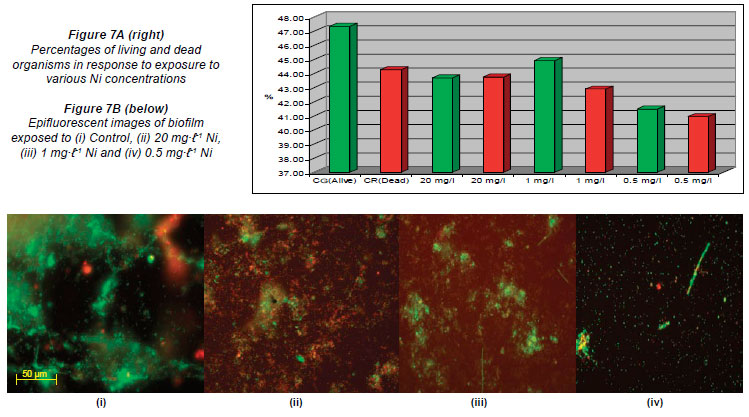
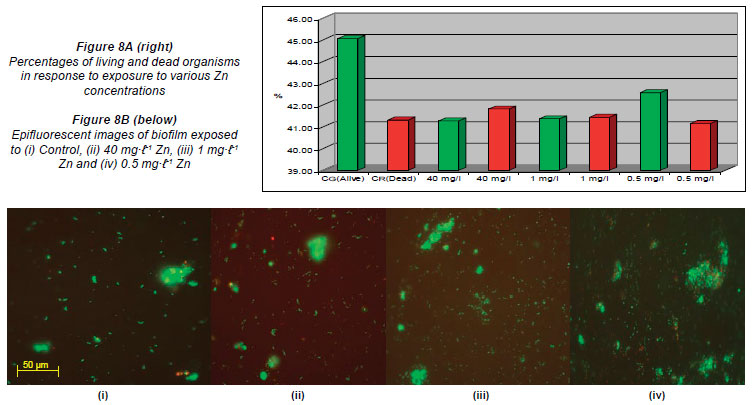
Figures 3A, 4A, 5A, 6A, 7A and 8A represent the percentages of live and dead organisms (epifluorescence microscopy in conjunction with the ScionImage statistical programme) within the biofilm cultivated in the flow cells. In the graphs, the letter 'G'; (green) indicates the live cells and the letter 'R'; (red) the dead cells. Figures 3B, 4B, 5B, 6B, 7B and 8B are images captured (untreated control and images captured after exposure to the respective metal concentrations) using epifluorescence microscopy. The results recorded in the control channels (which were left unexposed) showed that the initial percentages of live cells, for all of the metals analysed, were higher than that of the dead cells.
The following percentages were recorded for the channels exposed to Al concentrations: 48.12% alive (G) and 43.21% dead (R) for the control channels; 40.63% (G) and 47.68% (R) for the highest concentration of 900 mg·ℓ-1; 42.31% (G) and 44.52% (R) for 500 mg·ℓ-1, and 43.38% (G) and 42.59% (R) when exposed to 10 mg·ℓ-1 (Figs. 3A and 3B).
The percentages recorded for live and dead cells exposed to varying concentrations of Cu were: 44.02% (G) and 40.96% (R) in the control channel; 41.85% (G) and 44.67% (R) for the highest concentration of 10 mg·ℓ-1; 40.86% (G) and 41.14% (R) for 1 mg·ℓ-1 and 41.66% (G) and 41.04% (R) when exposed to the lowest concentration of 0.5 mg·ℓ-1 (Figs. 4A and 4B).
For Fe, the ratio of live and dead cells in the untreated control was 46% live (G) and 40.88% dead (R). The percentages obtained when the channels were exposed to the highest Fe concentration of 1 000 mg·ℓ-1 was 41.66% (G) and 44.47% (R); when exposed to 500 mg·ℓ-1 the percentages were 42.96% (G) and 44.25% (R); and when exposed to the lowest concentration of 10 mg·ℓ-1 the percentages recorded were 43.32% (G) and 42.40% (R) (Figs. 5A and 5B).
The percentages of live and dead cells recorded after exposure to Mn in the untreated control were 43% (G) and 41.07% (R), respectively. Upon exposure to the highest concentration (80 mg·ℓ-1), the number of live cells was 44.04% (G) and the number of dead cells was 50.23% (R). When exposed to the 2 lower concentrations of 15 mg·ℓ-1 and 1.5 mg·ℓ-1, the percentages of live and dead cells were 42.94% (G) and 43.39% (R) and 41.99% (G) and 41.18% (R), respectively (Figs. 6A and 6B).
The percentages of live and dead cells in the untreated flow cell control channels used to evaluate the various Ni concentrations were 47.34% (G) and 44.27% (R), respectively. The percentages recorded in the channels exposed to the highest Ni concentration of 20 mg·ℓ-1 were 43.68% (G) and 43.75% (R), while the percentages recorded when exposed to 1 mg·ℓ-1 were 44.91% (G) and 42.89% (R); when exposed to 0.5 mg·ℓ-1, 41.49% of the cells were alive (G) and 40.95% of the cells were dead (R) (Figs. 7A and 7B).
The channels exposed to the varying Zn concentrations yielded the following results in the untreated control channel: 45.06% live cells (G) and 41.32% dead cells (R). The percentages recorded in the flow cell channels exposed to the highest Zn concentrations (40 mg·ℓ-1) were 41.27% (G) and 41.82% (R), while the percentages recorded when exposed to 1 mg·ℓ-1 were 41.37% (G) and 41.44% (R). The percentages recorded when exposed to 0.5 mg·ℓ-1 wrtr 42.58% (G) and 41.15% (R), respectively (Figs. 8A and 8B).
When compared to the untreated controls, the percentages obtained in the channels of the flow cells exposed to the highest concentrations of Al (900 mg·ℓ-1), Cu (10 mg·ℓ-1), Fe (1 000 mg·ℓ-1) and Mn (80 mg·ℓ-1) (Figs. 3A, 4A, 5A, 6A) showed an increase in the number of dead cells of 4.47%, 3.71%, 3.59% and 9.16%, respectively. When the channels were exposed to the lowest concentrations of 10 mg·ℓ-1 (Al), 0.5 mg·ℓ-1 (Cu), 1.5 mg·ℓ-1 (Mn) and 0.5 mg·ℓ-1 (Zn), the ratio of live to dead cells was similar to that of the untreated control. When exposed to the highest concentrations of Zn (40 mg·ℓ-1) and Ni (20 mg·ℓ-1) no significant differences between the live and dead cell percentages were observed, as the percentages of dead cells only decreased by 0.52% and 0.5%, respectively (Figs. 7A and 8A). In a previous study, conducted by Bhadra et al. (2007), high concentrations of metals (Zn and Ni) in the river water affected the numbers of Zn- and Ni-resistant bacteria; the higher metal concentrations resulted in an increase in resistance mechanisms of the isolates. Table 2 presents the metal concentrations recorded in the water samples. The initial Zn concentration in the river water prior to treatment was 0.4 mg·ℓ-1, which was significantly higher (p < 0.05) than the recommended guidelines of 0.036 mg·ℓ-1 (DWAF, 1996) and 0.03 mg·ℓ-1 (CCME, 2001). The initial Ni concentration in the river water prior to treatment was 0.17 mg·ℓ-1, which was significantly higher (p < 0.05) than the recommended guideline of 0.025 mg·ℓ-1 to 0.15 mg·ℓ-1 (CCME, 2001).
In the case of exposure of the respective flow cell channels to the highest Al and Fe concentrations, Figs. 3B and 5B show that the organisms tended to clump together in response to the metal exposure. The ability of extracellular polymeric substances to bind metals and pollutants also contributes to the clumping of cells (McMlean et al., 1990). Previous research performed by Teitzel and Parsek (2003) showed that cells at the biofilm-bulk liquid interface were exposed to the high concentrations of various metals. According to Harrison et al. (2007), metabolic gradients in solid-surface-attached biofilms can result in the non-uniform distribution of extracellular pH, which in turn restricts the microbial growth rates in certain portions of the biofilm. The differences created by metabolic gradients and extracellular pHs contribute to the varying physiological states of the organisms within the biofilm; because the zones closest to the substratum are anoxic, the growth rates of organisms in these zones are slow and they are therefore more resistant to metals. The 2 fluorophores used (SYTO 9 and Propidium Iodide) stain the living cells green and the dead cells red, respectively. When the cells fluoresce yellow, it means that the 2 images are superimposed and it is impossible to distin guish live cells from dead cells (Figs. 3B to 8B). Teitzel and Parsek (2003) also reported that, in minimal media with short exposure times, biofilms have a demonstrable resistance to the heavy metals Cu2+, Zn2+ and Pb2+.
Polymerase chain reaction (PCR) and sequencing of 16SrRNA
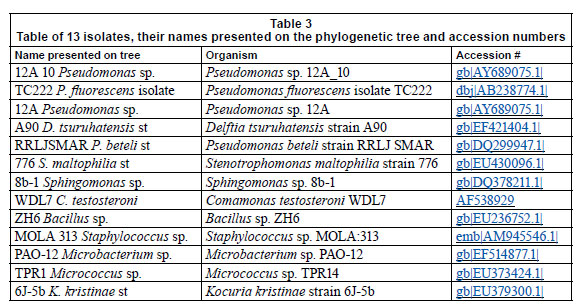
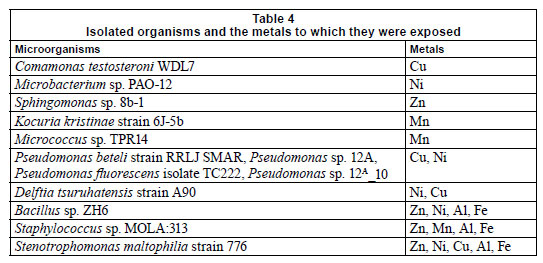
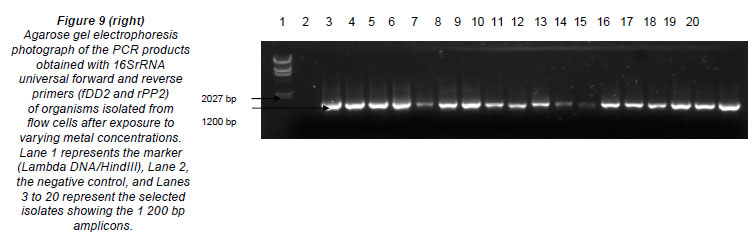
Table 3 represents the names of organisms isolated from the flow cells after exposure to varying metal concentrations. An agarose gel electrophoresis photograph showing selective results of the PCR fragments (1 200 bp) is presented in Fig. 9. Figure 9 clearly shows that the 1 200 bp PCR amplicon was routinely amplified. Overall, 37 organisms were isolated, but many of the isolates were identical; therefore, only 13 organisms were used in the construction of the phylogenetic tree.
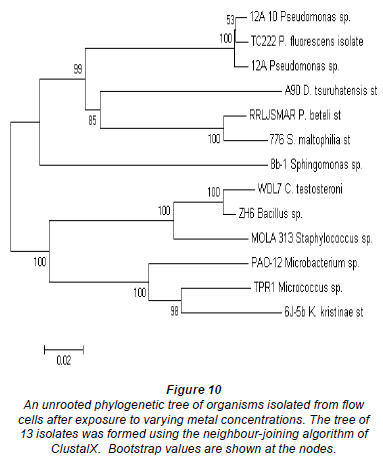
The phylogeny of the 13 representative organisms in GenBank (www.ncbi.nlm.nih/gov/Genban/submit.html) were analysed using the neighbour-joining algorithm in ClustalX (Fig. 10). The tree was aligned to determine evolutionary relatedness between the various isolates.
Phylogenetic analysis
Most of the isolates from all of the channels were identi fied as Staphylococcus sp. MOLA:313, Delftia tsuruhatensis strain A90, Pseudomonas fluorescens isolate TC222, Pseudomonas beteli strain RRLJ SMAR, Bacillus sp. ZH6 and Stenotrophomonas maltophilia strain 776. Two major clusters could be distinguished from the tree (Fig. 10) based on their Gram-reaction. From the phylogenetic tree it could be seen that the Gram-negative organisms, Proteobacteria (Pseudomonas sp., and Stenotrophomonas sp.) clustered together, whereas the Gram-positive organisms, low and high G + C Gram-positives (Bacillus sp., Micrococcus sp. and Microbacterium sp.), clustered together. In the first cluster, 2 clades could clearly be distinguished; the first clade consisted of Pseudomonas sp. and the second clade of a Pseudomonas sp. and a Stenotrophomonas sp. The isolates, Delftia tsuruhatensis st. A90 and Sphingomonas sp. 8b-1, were rooted to Clades 1 and 2, but, judging by the length of the nodes, did not seem to belong to any of the groups. In the second clus ter, 2 distinct clades could be distinguished. The first clade consisted of WDL7 Comamonas testosterone, ZH6 Bacillus sp. and MOLA 313 Staphylococcus sp. The second clade consisted of TPR1 Micrococcus sp., 6J-5b Kocuria kristinae st and PAO-12 Microbacterium sp.
In previous research it was shown that several Gram-positive (Arthrobacter sp. and Corynebacterium sp.) and Gram-negative (Alcaligenes sp.) organisms were shown to be resistant to Pb, Hg, Cd, Cu, Co and Zn (Trajanovska et al., 1997), which could be correlated with the results obtained in the present study. The major difference between the 2 clusters was that the Gram-positive organisms, Staphylococcus MOLA:313, Micrococcus sp. TPR1 and Kocuria kristinae st. 6J-5b, were resistant to Mn (Fig. 10 and Table 4), and that the clade consisting of the Pseudomonas sp. all exhibited tolerance to Ni exposure. Table 4 represents the organisms isolated from the different flow cells after exposure to the varying metal concentrations. The organisms in the table below were present after exposure to Al, Cu, Fe, Mn, Ni and Zn concentrations and were presumed to be metal-tolerant organisms. Organisms such as Comamonas testosteroni WDL7, Microbacterium sp. PAO-12, Sphingomonas sp. 8b-1, Kocuria kristinae strain 6J-5b and Micrococcus sp. TPR14 exhibited tolerance to specific metals, which included Cu, Ni, Zn and Mn, respectively (Table 4). The other isolates showed resistance to a range of different metals.
In a previous study by Bhadra et al. (2007), Pseudomonas, Bacillus, Moraxella, Enterobacter, Serratia, Morganella and Acinetobacter species were used to study Ni and Zn resistance, as these organisms possess inducible Ni- or Zn-resistance genetic systems. Their results indicated that the Ni and Zn resistance was induced at concentrations as low as 0.3 mg·ℓ-1 Zn2+ for Ni resistance in Pseudomonas sp. and Zn resistance was inducible by a concentration as low as 0.25 mg·ℓ-1 Zn2+.
The clusters also contained more Gram-negative than Gram-positive organisms (Fig. 10). Yilmaz (2004) and others have suggested that Gram-negative organisms predominate in metal-polluted environments, and also showed that it was reasonable to expect a certain degree of overlap between Gram-positive and Gram-negative bacteria, as some of these species are resistant to the same metals.
After the metals bind to the organism, they must either cross the cell wall of the Gram-positive organism or the outer membrane of the Gram-negative organism. Studies on Cu-, Cd-, Zn-, Cr-, Ni- and As-resistant bacteria have identified metal resistance genes located on the plasmid which can be induced in the presence of the particular metal (Trajanovska et al., 1997).
Bacillus, Pseudomonas, Xanthomonas, Stenotrophomonas, Sphingomonas sp. and Janthinobacterium lividum, were shown to display resistance to Zn, Bacillus sp. was shown to be resistant to Cu, while Variovorax sp. was shown to be resistant to silver (Ag), Zn and Cu (Piotrowska-Seget et al., 2005). In the present study, isolates such as Comamonas testosteroni WDL7 showed resistance to Cu, Kocuria kristinae strain 6J-5b showed resistance to Mn, and Bacillus sp. ZH6, Stenotrophomonas maltophilia strain 776 and Staphylococcus sp. MOLA:313 all showed resistance to Al, Fe and Zn (Table 4).
Piotrowska-Seget et al. (2005) studied metal-tolerant bacteria occurring in heavily-polluted soil and mine spoil in Katowice, Poland. The authors performed minimum inhibitory concentration studies to determine the resistance mechanisms of the different bacterial isolates. They found that Pseudomonas gladioli was resistant to Zn and Cu concentrations of 10 mM and 5 mM, respectively. In the present study the isolate Pseudomonas beteli str. RRLJSMAR showed resistance to Cu concentrations. Another study, conducted by Chien et al. (2007), evaluated the bacterial diversity in soil in order to determine bacterial response to media amended with Cd, Cr, Ni, Zn, Pb, and Cu. Stenotrophomonas sp., isolated from a site contaminated with high concentrations of Cd (3 mg.kg-1) and Cr (115 mg.kg-1), was able to grow on media containing Cd concentrations of up to 4 mM, and was also able to remove up to 80% dissolved ions upon completion of the stationary growth phase. In addition it was also able to resist other metals, such as, Cu, Cr, Ni, Pb and Zn, at levels of more than 2 mM Chien et al. (2007).
Three Bacillus isolates (B. cereus, B. megaterium and B.sphaericus), recovered from a uranium waste pile in Germany, were evaluated for their ability to accumulate metals, including Al, Cd, Cu, Fe, Mn, Ni, Pb, and Zn, amongst others.
Results revealed that the Bacillus sp. were able to accumulate large amounts of Pb, Cd, Cu, Al, Mn, Ni and Zn (Selenska-Pobell et al., 2006).
Yilmaz (2004) showed that Bacillus circulans could tolerate high concentrations of Cu, Mn, Ni, Zn, Co and Cd, and that the increased metal resistance resulted in a decrease in bacterial growth. The present study showed that different microorganisms with the ability to resist varying concentrations of metals were isolated from the treated flow cells following metal exposure. Isolates, such as Pseudomonas sp., Bacillus sp. and Staphylococcus sp., were shown to be tolerant to a wider range of metals (Cu, Mn, Ni, Zn, Al and Fe), while others, such as Comamonas testosteroni WDL7 and Kocuria kristinae strain 6J-5b, showed resistance to only Cu and Mn, respectively. These organisms can thus potentially be employed for future use in remediation processes.
Conclusions
• With the exception of Mn, the initial metal concentrations recorded in the water samples were above the recom mended concentrations as stipulated by DWAF (1996) and the CCME (2001).
• Based on ScionImage analysis, no significant differences between the percentages of live and dead cells could be observed when the flow cell channels were exposed to the lowest concentrations of 10 mg.ℓ-1 (Al), 0.5 mg.ℓ-1 (Cu), 1.5 mg.ℓ-1 (Mn) and 0.5 mg.ℓ-1 (Zn).
• In addition, the ratio of live to dead cells in the flow cell channels exposed to the lowest metal concentration was similar to that recorded in the untreated control.
• The highest percentage of dead cells was recorded in the flow cell channels exposed to the highest metal concentrations (Al (900 mg.ℓ-1), Fe (1000 mg.ℓ-1), Cu (10 mg.ℓ-1) and Mn (80 mg.ℓ-1)).
• The percentages of dead cells recorded did not differ significantly from the percentages of live cells after exposure to the highest concentrations of Zn (40 mg.ℓ-1) and Ni (20 mg.ℓ-1).
• The phylogenetic tree showed that the organisms isolated from the flow cell experiment after exposure to various metal concentrations were diverse.
• Some of the isolates were isolated from channels exposed to various metals and exhibited multiple metal resistance, while others were only isolated from specific metal channels and therefore showed resistance to specific metals.
•Stenotrophomonas maltophilia strain 776 exhibited tolerance to Zn, Ni, Cu, Al and Fe, while Bacillus sp. ZH6 showed tolerance to Zn, Ni, Al and Fe and Staphylococcus sp. MOLA:313 exhibited tolerance to Zn, Mn, Al and Fe exposure.
• Comamonas testosteroni WDL7, Microbacterium sp. PAO12, Sphingomonas sp. 8b-1, showed tolerance for Cu, Ni and Zn, respectively, while Kocuria kristinae strain 6J-5b and Micrococcus sp. TPR14 exhibited tolerance to Mn.
• The major metal-resistant organisms, Bacillus sp. and Pseudomonas sp., both displayed resistance to Ni. Bacillus sp., however, also showed resistance to Zn, Al and Fe, while Pseudomonas sp. showed resistance to Cu.
Acknowledgements
The National Research Foundation (NRF) and Cape Peninsula University of Technology (CPUT) are thanked for financial support.
References
ALLINOR IJ (2005) Assessment of elemental contaminants in water and fish samples from Aba River. Environ Monit Assess. 2 (1-3) 15-25. [ Links ]
ALTSCHUL SF, MADDEN TL, SCHÄFFER AA, ZHANG J, ZHANG Z, MILLER W and LIPMAN DJ (1997) Gapped BLAST and PSI-BLAST: a new generation of protein database search programs. Nucleic Acids Res. 25 3389-3402. [ Links ]
AMANN RI, LUDWIG W and SCHLEIFER KH (1995) Phylogenetic identification and in situ detection of individual microbial cells without cultivation. Microbiol. Res. 59 143-169. [ Links ]
BHADRA B, NANDA AK and CHAKRABORTY R (2007) Fluctuation in recoverable nickel and zinc resistant copiotrophic bacteria explained by the varying zinc ion content of Torsa River in different months. Arch. Microbiol. 188 215-224. [ Links ]
BOULOS L, PRÉVOST M, BARBEAU B, COALLIER J and DESJARDINS R (1999) LIVE/DEAD® BacLight™: application of a new rapid staining method for direct enumeration of viable and total bacteria in drinking water. J. Microbiol. Meth. 37 77-86. [ Links ]
CALDWELL DE, WOLFAARDT GM, KORBER DR, KAARTHIKEYAN S and LAWRENCE JR (2002) Cultivation of microbial communities. In: Hurst CJ, Crawford RL, Knudsen GR, McInerney MJ, Stetzenbach LD (eds.) Manual for Environmental Microbiology. ASM Press, San Diego, USA. 92-100. [ Links ]
CCME (CANADIAN COUNCIL OF THE MINISTERS OF THE ENVIRONMENT) (2001) Canadian sediment quality guidelines for the protection of aquatic life: Summary tables. Updated in: Canadian Environmental quality guidelines. Canadian Council of Ministers of the Environment, Winnipeg, Canada. [ Links ]
CHIEN CC, HUNG CW and HAN CT (2007) Removal of cadmium ions during stationary growth phase by an extremely cadmium resistant strain of Stenotrophomonas sp. Environ. Toxicol. Chem. 26 664-668. [ Links ]
DEAT (DEPARTMENT OF ENVIRONMENTAL AFFAIRS AND TOURISM, SOUTH AFRICA) (1996) National Waste Management Strategy Implementation Project. URL: http://www.environment.gov.za/nwmsi/background/planning_legreview-starterdoc.pdf. (Accessed 12 March 2007). [ Links ]
DEPARTMENT OF WATER AFFAIRS AND FORESTRY (DWAF) (1996) South African Water Quality Guidelines for Fresh Water 2nd Edition, Domestic Water Use. Environmental Services, CSIR, Pretoria. 77-87 [ Links ]
HARRISON JJ, CERI H and TURNER RJ (2007) Multimetal resistance and tolerance in microbial biofilms. Nat. Rev. Microbiol. 5 (12) 928-933. [ Links ]
HIGGINS DG and SHARPE PM (1988) CLUSTAL: a package for performing multiple sequence alignment on a microcomputer. Gene 73 237-244. [ Links ]
HUANG X and MADAN A (1999) CAP3: A DNA sequence assembly program. genome Res. 9 868-877. [ Links ]
JACKSON VA, PAULSE AN, ODENDAAL JP and KHAN W (2009) Investigation into the metal contamination of the Plankenburg- and Diep Rivers, Western Cape, South Africa. Water SA 35 (3) 1-11. [ Links ]
KUMAR S, TAMURA K and NEI M (2004) MEGA3: Integrated software for molecular evolutionary genetics analysis and sequence alignment. Brief Bioinform. 5 150-163. [ Links ]
MAANAN M, ZOURARAH B, CARRUESCO C, AAJJANE A and NAUD J (2004) The distribution of heavy metals in the Sidi Moussa lagoon sediments (Atlantic Moroccan Coast). J. Afr. Earth Sci. 39 473-483. [ Links ]
MARTIN AP (2002) Phylogenetic approaches for describing and comparing the diversity of microbial communities. Appl. Environ. Microbiol. 68 (8) 3673-3682. [ Links ]
McMLEAN RJ, BEAUCHEMIN D, CLAPHAM L and BEVERIDGE TJ (1990) Metal-binding characteristics of the gamma-glutamyl capsular polymer of Bacillus licheniformis ATCC 9945. Appl. Environ. Microbiol. 56 3671-3677. [ Links ]
OCHMAN H, LERAT E and DAUBIN V (2005) Examining bacterial species under the spectre of gene transfer and exchange. Proc. Nat. Acad. Sci. USA. 102 (1) 6595-6599. [ Links ]
ODENDAAL JP and REINECKE AJ (1999) The sublethal effects and accumulation of cadmium in the terrestrial isopod, Porcellio laevis Latr. (Crustacea, Isopoda). Arch. Environ. Contam. Toxicol. 36 64-69. [ Links ]
PIOTROWSKA-SEGET Z, CYCON M and KOZDROJ J (2005) Metal- tolerant bacteria occurring in heavily polluted soil and mine spoil. Appl. Soil Ecol. 28 237-246. [ Links ]
RAWLINGS DE (1995) Restriction enzyme analysis of 16SrRNA genes for the rapid identification of Thiobacillus ferooxidans, Thiobacillus thiooxidans, Leptospirillum ferooxidans strains in leaching environments. In: Jerez CA, Vargas T, Toledo H and Wiertz JV (eds.) Biohydrometallurgical Processing, University of Chile Press, Santiago. 9-17. [ Links ]
ROANE TM and PEPPER IL (2000) Microorganisms and metal pollutants. In: Maier RM, Pepper IL and Gerba CP (eds.) Environmental Microbiology. Academic Press, San Diego. 403-423. [ Links ]
SAITOU N and NEI M (1987) The neighbour-joining method: a new method for reconstructing phylogenetic trees. Mol. Biol. Evol. 4 406-425. [ Links ]
SALEH MA, EWANE E, JONES J and WILSON BL (2000) Monitoring Wadi El Rayan lakes of the Egyptian desert for inor ganic pollutants by ion-selective electrodes, ion chromatography, and inductively coupled plasma spectroscopy. Ecotoxicol. Environ. Saf. 45 310-316. [ Links ]
SELENSKA-POBELL S, PANAK P, MITEVA V, BOUDAKOV I, BERNHARD G and NITSCHE H (2006) Selective accumulation of heavy metals by three indigenous Bacillus strains, B. cereus, B.megaterium and B. sphaericus, from drain waters of a uranium waste pile. FEMS Microbiol. Ecol. 1 59-67. [ Links ]
TEITZEL GM and PARSEK MR (2003) Heavy metal resistance of biofilm and planktonic Pseudomonas aeruginosa. Appl. Environ. Microbiol. 69 2313-2320. [ Links ]
TRAJANOVSKA S, BRITZ ML and BHAVE M (1997) Detection of heavy metal ion resistance genes in Gram-positive and Gram-negative bacteria isolated from a lead-contaminated site. Biodegradation 8 113-124. [ Links ]
WRIGHT D and WELBOURNE P (2002) Environmental Toxicology. Factors affecting Toxicology. Cambridge Environmental Chemistry Series 11. Cambridge University Press, Cambridge. [ Links ]
YILMAZ EI (2004) Metal tolerance and biosorption capacity of Bacillus circulans strain EB1. Res Microbiol. 154 409-415. [ Links ]
Received 28 January 2011; accepted in revised form 14 December 2011.
* To whom all correspondence should be addressed. +27 21 460-9095; fax: +27 21 460-3193; e-mail: wesaalkhan5@gmail.com

