


Serviços Personalizados
Artigo
 Inglês (pdf)
 Artigo em XML
 Referências do artigo
Indicadores

Links relacionados
-
 Citado por Google
 -
 Similares em Google
Compartilhar

 Permalink
Water SA
versão On-line ISSN 1816-7950
versão impressa ISSN 0378-4738
Water SA vol.37 no.5 Pretoria Jan. 2011
A review of the modelling of water values in different use sectors in South Africa
WL NieuwoudtI,*; GR BackebergII
IUniversity of KwaZulu-Natal, Private Bag X01,Scottsville 3209, Pietermaritzburg, South Africa
IIWater Research Commission Private Bag X03, Gezina 0031, Pretoria, South Africa
ABSTRACT
In this article several economic studies undertaken to assist with the implementation of the National Water Act (NWA) No. 36 of 1998 are reviewed. In these studies the following procedures were applied to model water use: operational research, econometric analysis, input/output analysis, willingness to pay and the conceptual framework of water markets. Main use sectors are agriculture, forestry, municipalities (domestic consumption) and the environment. Water values estimated in the studies differ significantly between sectors, as well as between and within catchment areas. Most of the studies focused on irrigated agriculture as an important use sector in terms of water volumes, food production and capital investment. Input/ output analysis indicates that South African agriculture is a less productive user of water in terms of gross income generated per unit of water. Evidence suggests that industrial and domestic use place a high value on assurance of supply of current water consumption levels. In contrast, agriculture requires large volumes of water for food production in response to market demand. The average value product of water is much higher for industry than agriculture, but the marginal value products appear similar in both sectors. From this it is concluded that water-use rights will in future be transferred from agriculture to industry but there is no urgency at present. As water is transferred in future from agriculture to domestic use and industrial use, the value (rents) now attached to land will transfer to water and real water prices will accordingly increase. The transfer of rents from land to water should not affect the value of farms. The expected significant increase in real water prices in a water market will provide further incentives for its conservation. The purpose in this review paper that covers a wide range of topics is to provide information to policy decision-makers on the economics of water management in South Africa.
Keywords: use sectors, modelling research, water values, market transactions, water prices
Introduction
Several studies have been undertaken to assist with the implementation of the National Water Act (NWA), Act No. 36 of 1998 (RSA, 1998), and the National Water Resource Strategy (NWRS) of 2004 (RSA, 2004), by the now Department of Water Affairs (DWA). In this paper some of the economic studies are reviewed with the purpose of documenting the lessons learnt. These research projects were initiated mainly since 1997 and focused on 2 aspects: Modelling of the value of water for irrigation, forestry, domestic use sectors and the environment in different catchment areas; and empirical assessment of the prices of water-use rights for irrigation in river basins and periods with active market trades (WRC, 1998: 79,103; 2000: 101,119). Water resources should be allocated in a way that will ensure its 'best possible use'. The 'best possible use' entails more than the productive use of water since in addition social, economic and environmental factors must be included to achieve the objectives of equity, efficiency and sustainability of water use. In this article, findings in several economic studies are reviewed with the focus on economic efficiency using a modelling approach. Sustainability is also given attention in this article in several studies on the environmental use of water and pollution. Equity cannot be studied using economic models but the interested reader is referred to Nieuwoudt et al. (2008) who investigated restitution and redistribution issues in 3 catchments. The improvement in equity leads to more stability and does not influence the results of the other studies in a negative way. The following procedures were applied to model water use in different sectors: operational research, econometric analysis, input/output analysis, willingness to pay and the conceptual framework of water right markets. This contribution builds on earlier research by Backeberg (1997) and Nieuwoudt et al. (2004) and several other studies that appeared subsequently. An aim of the paper is to analyse information provided by models which included the interpretation of wateruse values estimated with models and analysis of actual prices with trade of water-use rights. The structure is as follows: The paper differs from the standard research paper that starts with a methodology section. It is a review paper of several economic studies that all focus on water use that covers a wide range of topics that are all important in water management. This includes estimation of water values in different sectors, risk and risk aversion, environmental use and pollution. The overall purpose of the paper is to provide information which may be useful to policy-making in water management based on an economic analysis of several studies.
Economic principles
Under conditions of scarcity, value is attached to water resources and the right to gain access to water resources. When the rights are traded, a price is negotiated in the market transaction. Water has 2 main uses; it is consumed directly as consumption good or it is a factor of production in agriculture, forestry, mining and industry. The economic theoretical foundation of both demands differs and will be discussed separately.
Water as a consumption good estimated by econometric models
Residential demand is the only category where water is consumed directly. Residential water competes directly with other items in the household budget. Consumer choice can be modelled as utility maximisation given a budget constraint from which a downward sloping demand for water can be derived. A condition for economic efficiency in consumption is that marginal utility must be equated for all consumers, which is achieved as all consumers in a given area face the same price for water. Some characteristics of water resemble that of other economic goods, implying that price is important. The Espey et al. (1997) survey of 124 estimates of price elasticity of demand for residential water supports this view. They report a median short-run price elasticity of -0.38. This shows that residential water is not price-responsive in the short run, confirming its essentiality.
Water as an input of production estimated by various models
Theoretically the demand for irrigation water is a derived input demand as irrigation water is a factor of production. An input demand is derived from the demand of the product (profitability of crops, etc.), the production function (water plant efficiency), and the supply conditions of other factors of production (water-saving technologies).
Whether the total contribution or the marginal contribution is estimated in a study depends on the model and technique used. Linear programming provides information on the value of the marginal product (VMP) of water given by the shadow price of the water constrained. Production functions provide information on the VMP of water. The willingness to pay (WTP) approach estimates average consumer surplus which is an approximation of market values and thus estimates marginal value. In input/output analysis the average contribution of water is captured.
The contribution of water use in different sectors: an input/output analysis
In order to decide which sectors should be given preference in water allocation during scarcity, information is needed on the contribution of water in these sectors. Input/output analysis estimates that 1 cubic meter of water increases the value of output by R1.50 in agriculture, R157.40 in industry, R39.50 in mining and R44.40 in eco-tourism (Conningarth Economists, 2001). The issue is not whether these numbers are correct but that they be misused and that policy of water allocation should not be influenced by input/output data even if they are reliable.
These are average relationships derived from input/output tables and some comments of caution are raised in interpreting these data. In a rationing situation (scarcity) water use should be allocated between sectors based on marginal benefits and not average benefits. That is, using input/output models water efficiency for the industry sector is shown to be high because output per unit water use is high and water use low. It is, however, expected that supply assurance for water is high in the mining and industry sectors compared to agriculture. The input elasticity of demand for water is expected to be low in sectors where the cost of water is a relatively small share of the value of the final product and where water cannot be replaced by other factors of production (Friedman, 1962: 153). A low price elasticity of demand implies that a high premium is placed on sufficient water and a high level of assurance.
As in the case of all resources, water must be allocated on marginal principles in order to maximise social welfare. The marginal contribution of water in industry is expected to be much lower than the R157.40/m3 mentioned earlier. That is, profit-maximising firms in the industry sector will purchase water from municipalities until the contribution made by the last unit of water to the firm (VMP) is equal to the price of water (about R1.26/m3 in the case of the Nelson Mandela Metropolis in 2002 according to Conradie (2002)).
Modelling the value of water use in nonagricultural sectors
Studies of water use in non-agricultural sectors are: municipal use (Conradie, 2002; Williams et al., 2008), estuary use (Hosking, 2010; Hosking et al., 2002), commercial forestry (Tewari, 2003, Williams et al., 2008), environmental use (Williams et al., 2008) and alien vegetation use (Hosking et al., 2002).
Municipal value of water estimated by econometric techniques
Conradie (2002) used regression to estimate demand functions for water for household, commercial and industrial consumption in the Nelson Mandela Metropolitan Municipality. The marginal benefit of water to consumers is estimated at R2.40/ m3. The city purchases water from the Department of Water Affairs (DWA) at an annual rate of R0.256/m3. There is no doubt that, like irrigation, municipalities capture the residual value of the resource in the sense that they earn rents from the scarcity value of the resource.
In order to increase income variability of households in the data set, observations from the more affluent residential areas and townships (low-income consumers) were pooled. This pooling also improved price variability but a lack of price variability is a major problem in the estimation of price elasticity of water using regression. The water price elasticity was estimated at -0.47 (t = -3.10) which is low and indicates that this use is not sensitive to price increases (Conradie, 2002). A similar estimate (-0.40) was reported for Australia (Australian Academy of Technological Sciences and Engineering, 1999). Using willingness to pay (WTP) surveys Williams et al. (2008) estimated even lower price elasticities for water in the Greater Letaba River catchment. These elasticities varied between a high (-0.40) and a low (-0.25) (Williams et al., 2008: 108-109). Generally an estimate based on observed data (for instance regression) is considered superior to an estimate based on unobserved data, for instance a WTP study, as the latter is seen as subjective. In situations where no observations are available, WTP has to be accepted.
Environmental use: Valuation of estuary services using Contingent Valuation
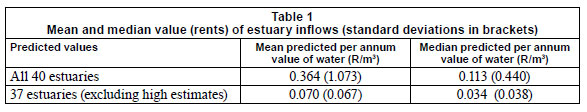
Hosking (2010) edited and compiled a report of a study on the valuation of estuary services comprising 40 estuaries and data collected from 7 768 people. The findings are summarised in Table 1. The average value per cubic metre of river inflow of the 40 estuaries is R0.36 with a standard deviation of R1.07.
The high standard deviation implies high outliers and when 3 estuaries are excluded the mean water value drops to R0.07 with a lower standard deviation of R0.067. There are many people with an interest in using estuaries, but the primary demand is for the recreation services they yield. Being an environmental activity, estuaries have a public-good component which means that government intervention may be required by restricting specific type of uses that cause a problem. Inflows had a higher value per cubic meter in estuaries where a relatively small reduction of inflow causes a big reduction in estuarine service.
In an earlier report Hosking et al. (2002) studied the value of freshwater inflows into the Keurboom Estuary using the contingent valuation method (CVM). Inflows from the Tsitsikamma catchment into the estuary have been reduced by infestation of water-consuming alien vegetation leading to estuary mouth closure. The removal of this vegetation was initiated under the Working for Water (WfW) Programme. The total recreation value of water to the estuary estimated at R0.046/m3 was substantially less than the willingness to pay for water for farming at the time, namely R0.125/m3 (Hosking et al., 2002). According to the researchers the benefits derived by those upstream of the estuary were not included.
Commercial forestry use of water estimated by the residual value method
Water is the most important limiting factor of production in commercial forestry in South Africa. Commercial forestry uses water in 2 forms: evapotranspiration (ET) and streamflow reduction (SFR). In terms of streamflow reduction, water use is estimated to be in the region of 1.4 x 10⁹ m3/a, or roughly 8% of the total utilisable water in South Africa.
The value of the 2 uses of water (ET and SFR) in forestry was estimated using the residual value (RV) method (Tewari, 2003). The residual value method is based on the premise that the residual value obtained as total revenue minus total cost, including the compensation for capital and management, is attributed to water.
ET values estimated by the RV method for eucalyptus vary from R0.04/m3 to R0.13/m3 of water, and the average value comes to R0.08/m3. The ET value for pines, estimated by the RV method, is on average R0.017/m3. Water value estimates for pine species are much lower than that estimated for eucalyptus. The difference can be explained in terms of the growth pattern of the 2 tree species; eucalyptus grows faster and uses water more efficiently.
Modelling the value of water use in agriculture
It was estimated that about 30% of the value of SA agriculture is produced under irrigation based on the value of crops produced (Backeberg and Odendaal, 1998). This figure appears similar to the contribution of water to rural value added in Australia which was also 30% (Australian Academy of Technological Sciences and Engineering, 1999). Irrigation water is essential to South Africa's fruit industry as fruit ranks amongst the most important export commodities. The former Department of Water Affairs and Forestry estimate that the surface water allocation to agriculture is above 60%. Statistics South Africa estimate the allocation to agriculture at 36% (including livestock and game) while the environmental allocation is higher at 42% (but this allocation is uneven) (Hosking, 2010).
Since irrigated agriculture is an important consumer of water, studies to determine the value of water were undertaken in the following regions: Great Fish-Sundays Scheme in the Eastern Cape (Conradie, 2002); Berg River (Louw, 2002); Crocodile River (East) catchment (Bate et al., 1999; Gillitt, 2004); Lower Orange River (Armitage, 1999; Gillitt, 2004); and Eastern and Southern Cape (Hosking et al., 2002). A follow-up water marketing study was also undertaken in 3 catchments (Nieuwoudt et al., 2008).
Modelling water use in the Great Fish-Sundays River catchment using linear programming allowing for risk
The Great Fish-Sundays River is supplied by an interbasin water transfer of 560 x 106 m3/a, from the Gariep Dam on the Orange River. Conradie (2002) constructed linear programming models for 16 model types of farm situations in this area, also allowing for risk using MOTAD. The first task in constructing a regional model is to test whether the model can duplicate the existing cropping pattern. This can be achieved by including additional constraints but then the model loses its ability to simulate. Conradie (2002) fine-tuned her model by testing for risk-averse coefficients avoiding using these additional constraints.
In models where risk was ignored, the model simulated more specialisation in crops than what is actually occurring. Inclusion of risk has led to more diversification and a more realistic model. Estimates of the value of water were sensitive to assumed risk-aversion values indicating that the degree of confidence that can be placed on estimates of risk aversion is not very high.
Estimates of the value of water also differ significantly amongst the different representative farms. This is to be expected if the transaction cost of water transfers is high. Three farm types attach a zero marginal value to water. For the remainder, marginal willingness to pay for water ranges between R0.0003/m3 and R0.2115/m3. The current allocation of water does not appear efficient due to wide differences between areas. As some resource areas have zero opportunity cost of water it is estimated that 77 x 106 m3/a, or 13% of the resource, can be redistributed away from irrigation at zero opportunity cost. Two thirds of the current allocation can be bid away at a price of R0.035/m3. Conradie (2002) concludes that the Fish-Sundays may be a possible source of cheap water that should be further investigated.
Modelling water use in the Berg River catchment using positive mathematical programming
Louw (2002) developed a positive mathematical programming model to study the impact of water markets in the Berg River basin. The novelty of the technique is that it is calibrated to simulate the base period which avoids the introduction of inflexible bounds. Whereas Conradie (2002) used various risk-averse coefficients to simulate the base production pattern, Louw (2002) used positive mathematical programming for the same purpose.
Louw (2002) showed that the capitalised marginal value of water differs from as low as R0.00/m3 to as high as R20.00/ m3 within subsectors of the river basin. The median capitalised market value of water is estimated at R1.60/m3 (rental rate of R0.21/m3) if no trade is assumed and R0.30/m3 if trade is assumed. The significant differences in the value of water between areas within the basin indicate that significant gains are possible from trade between these areas.
In a more recent study, the water market in the Berg River was studied (Nieuwoudt et al., 2008). Water transfers have taken place regularly and largely within the basin. Based on the information that transfers have stopped and that un-exercised rights will not be supported for transfer, it appears that most of the proposed transactions involved un-exercised user entitlements.
In general, irrigation practices in the Berg River Water Management Area (WMA) are highly sophisticated and water use by the irrigation sector is relatively efficient. Farmers use drip irrigation for wine grapes and table grapes and micro-irrigation for citrus. The irrigation demand for water is thus fairly inelastic and it is unlikely that high water prices will reduce the level of water use for production.
The average price (2007) for summer-use entitlements varies between R15 000/ha and R20 000/ha in the Upper Berg River (average application of 5 000 m3/ha·a - range between 4 000 m3/ha·a, 5 000 m3/ha·a and 6 000 m3/ha·a). Land under wine-grape vineyards sells for about R110 000/ ha to R130 000/ha (2007). Some of the costs to establish a vineyard are fixed (sunk) in the long run such as development and drainage. The costs now attributed to the fixed (sunk) component may move to water, and water prices may increase accordingly in future. It is estimated that water prices may increase in real terms to about R45 000/ha or more than double the present (2007) price. In a water market, prices will increase (in real terms) which will provide incentives for conservation. Winter water entitlements are more common in the Lower Berg River. The price of winter use entitlements is lower (about R10 000/ha) as farmers need to build dams to capture this water for use in summer.
Studying water right markets in the Crocodile River catchment
The water rights market in this area has been studied by Bate et al. (1999), Armitage (1999), Gillitt (2004) and Nieuwoudt et al. (2008). It is shown here that, using the economic conceptual framework of a water rights market, much information is available from the market. The net profit earned by a natural resource such as land and water, called rent, is capitalised in land in the absence of a separate water rights market. If water rights can be sold separately, then these rents are separated. It is shown that a study of these rents (or capitalised value) may provide some information on future water prices. The value of land under irrigation down from the Gorge in the Lower Crocodile River is about R58 000/ha (Van Rooy, 2006). Van Rooy (2006) provides a per-ha breakdown of the market price of water and land in Table 2. Some of these investments such as development and irrigation are sunk (fixed). It is expected that water in future will be transferred to non-agriculture which means that sunk investments will have a zero opportunity cost. Some irrigation equipment, however, will have a variable cost component as replacement is needed in the long run.
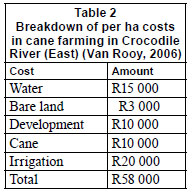
If the opportunity cost of the sunk investments is zero then the real price of water may increase from R15 000/ha for 13 000 m3 of water to a maximum of R45 000 for 13 000 m3 of water or to R3.46/m3. The transfer of rents from land to water should not affect the value of farms. The expected significant increase in water prices will provide further incentives for its conservation.
The above estimated maximum price for water should be further reduced as no site rents for land are assumed; for instance, land closer to the river may be more valuable than the figure used (R3 000). Land closer to the river will always command site rent as it costs less to convey water over a shorter distance than further away. In such a scenario the price of land closer to the river will be more than its grazing value. It is also assumed that water is given as much legal protection in terms of security and enforcement as land. However, given the uncertainty of site rents and the possibility of a variable cost component of irrigation equipment, the best estimate is that the price of water is expected to exceed the price of land (land excluding water) in future, which means that real water prices may still double.
A farmer at present may not be prepared to sell his water rights from land under irrigation (if rights are fully appropriated). The reason is that land without water will have little value (R3 000/ha is the value of bare land). If non-exercised users cannot sell water then a farmer who wants water can only purchase it from a user who irrigates. The conclusion is that no user who irrigates (exercised user) may sell his water and no sales in this category will take place until the price of water increases sufficiently. Van Rooy (2006) concurs with this conclusion and logic. It is predicted that no sales from exercised users to other exercised irrigators will take place for some time. Where farmers can also sell to non-agriculture the price of water in agriculture will be determined by what non-agriculture is prepared to pay. As cities can afford to pay more for water, such transfers will take place. It is also predicted that the price of water will increase as the rules (legal requirements) protecting irrigation rights are more effectively enforced.
Water prices in the past were depressed because of the following policies:
• Non-exercised users were able to sell
• No adequate metering was undertaken
• Past policies attributed a scarcity value to land and not water
Under riparian law, ownership of riparian land provides access to water. Farmers have been given fairly generous water quotas per ha in the past with the implication that land was the scarce resource and not water. The markets priced land and water in accordance with these past policies.
Studying water right markets in the Orange River catchment using econometric techniques
A discriminant analysis undertaken by Armitage (1999) between buyers and sellers of water rights showed that the most important variable discriminating between the 2 groups was that buyers were table grape farmers (F = 18.3) and, secondly, that buyers had a higher return per unit of water (F = 14.9). This shows that the water-market in the Lower Orange pro motes the efficiency of water use.
In a follow-up study on the Orange River the above finding was confirmed as it was shown that buyers of water rights had a higher return per unit of water (Gillitt, 2004). He used principal components, logit/probit models and ridge regression. Equation (1) shows the dominant loadings of the first principal component of variables associated with water marketing (Gillitt, 2004):
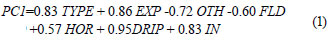
Component (PC1) shows positive loadings amongst the following variables: buyers of water entitlements (TYPE = 1 for buyer and = 0 for seller); percentage of cropped area planted to export table grapes (EXP); percentage planted to horticultural crops (HOR), percentage of advanced irrigation technology used (DRIP); income per cubic meter of water applied (IN). It also shows negative loadings for percentage of cropland planted to other grapes (OTH), and percentage of land planted to field crops (FLD). This component captures variables associated with the purchase of water entitlements and could be labelled 'Buyer'. This indicates that a water market promotes efficiency in water use and that water is transferred to high-income crops (table grapes and horticultural crops).
Modelling water use in the Eastern and Southern Cape using the willingness to pay method
Water values were estimated in order to arrive at benefits from removing water consuming alien vegetation. This study was undertaken under the Working for Water Programme. In this study the conservation value of water was approximated by its agricultural and urban use value. The runoff from the Tsitsikamma mountain catchment that does not flow into the sea is used for irrigation farming and livestock watering. The rental value of agricultural water according to WTP amounted to R0.125/m3 excluding storage and transfer cost. In the following areas water values were zero; Port Elizabeth Driftsands (no potential for municipal supply), Albany (high salinity content) and Pott River (not used for recreation). In the Kat River farmers were willing to pay R0.15/m3 for water. Hosking et al. (2002) concluded that the cost of clearing alien vegetation on these sites will exceed the benefit if non-metropolitan use is considered.
Modelling the reallocation of water use in the Great Letaba River Catchment
It is more difficult to compare the value of water use in the previous studies as value is area specific while different models were used. Williams et al. (2008) used the same technique (willingness to pay) to study water use in different sectors in the same area (Greater Letaba) which avoided the above problem. However, the WTP approach has the weakness of not being based on observed data as in the case of regression or operations research. Results are summarised in Table 3.
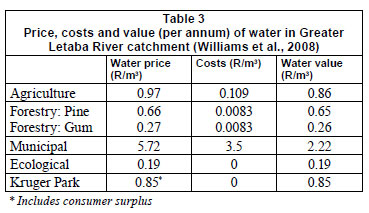
The water price is the economic price as revealed by the demand schedules at the given level of supply, i.e. the price which would be current if there were a market for water. The water value is the difference between the water price and its associated costs. The municipal value is the highest followed by agriculture.
The water price is expected to be more realistic as it is based on a study (WTP) while costs are calculated and depend, for instance, on the period of depreciation. The depreciation period is critical and should be in accordance with the benefit flow provided by the investment. The following comment refers to the price of water and problems related to cost calculations are ignored.
Williams et al. (2008) maximised social welfare using linear programming and demonstrated that a transfer of 5 Mm3 of water from agriculture to municipal use will increase welfare to society. The result is expected based upon economic theory and given their data. The question is, however, why the municipality would want to sell more water if income is lower and costs are higher. In their base scenario residential use is 25.35 Mm3 and the price is R5.72/m3 which gives a total income of R145 million. When water is transferred to municipalities, residential use is 29.91 Mm3, the price is R3.78/m3 and total income is R113.06 million. The lower price of water when water is transferred is generated in their model. Total income to the municipality falls by 22% while the cost to deliver a larger quantity of water must be more.
Modelling policy risk in water markets
An economic study on models in water markets is incomplete if attention is not given to risk. Conradie (2002) used the portfolio approach to include variances and co-variances of gross incomes in linear programming models in the Sundays River/ Fish River Canal Scheme. The researcher could then test the level of risk aversion that best explains the existing cropping area.
In a different study, the risk aversion of irrigation farmers in the Orange River was measured by the Arrow/Pratt Absolute Risk (APAR). Aversion coefficients were standardised for scale and range of data (Nieuwoudt et al., 2005). The empirical investment model shows that farmers who are more risk-averse expect to invest less in the future. Risk management strategies in an environment of risk are crucial. Policies that increase risk in agriculture will have a significant negative effect on future investment in irrigation. Farmers were tested for downside risk where there is a chance that they can lose money if they select the uncertain alternative. Farmers are more risk-averse (downside risk) than anticipated in the questionnaire as almost all the farmers picked the most risk-averse category. That is, they did not pick a choice where money could be lost. An APAR for down-side risk was estimated at 3.28 which implies in a choice situation an indifference between a certain income of R0.00 and being given a 50% chance on winning R800 000 or losing R200 000. Farmers may not take this gamble although its mean income is R300 000 (0.5 times R800 000 minus 0.5 times R200 000). This means they want a significant reward for taking a risk.
An investment model was estimated where Y is the percentage by which farmers expect to increase or decrease their investment in irrigation in the Orange River. As the regression suffered from high multicollinearity, as measured by VIF (variance inflation factor) values, a ridge regression was undertaken to reduce multicollinearity. The results of this regression are shown in Eq. (2). The model explains future investment (Y) as a function of expected profits (EXP), risk (RISK as measured by APAR), and liquidity (LSTCK). These variables are supported by economic theoretical considerations. The R-squared value is 0.55 which is considered good given the conceptual nature of the model. The F value for the model is 5.2 which is significant at the 1% level, indicating that all the variables are jointly significant.
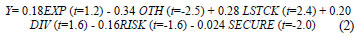
The more risk-averse farmers are expected to invest less as the RISK coefficient (APAR) was negative. It was earlier shown that irrigation farmers along the Lower Orange River are highly risk-averse, especially where down-side risk is concerned. The implication is that policies that increase the risk in agriculture will have a significant negative effect on future investment in irrigation as these farmers will attach a great cost to risk. Farmers who feel that water licences are not secure (high scores for SECURE) are further expected to invest less. The fact that both the RISK variable and the SECURE variable are entered is significant as both variables measure different dimensions of risk.
Policy risk and risk aversion appear to be important in explaining future investment in irrigation farming in the Lower Orange River. Important policy implications are that farmers should be better informed about the practical implications of the National Water Act and specifically water licences.
Assurance of supply and water quality
Assurance of supply
Data generated by the studies presented in this paper provide information on the assurance of supply. The low estimates of the price elasticity of demand for urban water indicate that urban users attach a high value to assurance and a low value to additional water. Mirrilees et al. (1994) also state that urban water users require a high level of assurance. Conradie (2002) estimates the price elasticity of demand for household, com mercial and industrial consumption as -0.47 (t = -3.10) in the Nelson Mandela Metropolis. A low (numerically less than 1.0) price elasticity means that the marginal benefit of water increases sharply with scarcity but falls rapidly with increased supply. As urban water in South Africa is purchased from municipalities one can approximate the marginal value of urban water by the prices paid to the municipalities.
The linear programming models reported in this paper generally estimate fairly elastic input demands for agricultural water if the diagrams are studied (Conradie, 2002; Louw, 2001). These estimates will vary from area to area and from crop to crop but it may be possible in agriculture to use watersaving technologies or switch to more water-efficient crops. The fact that agriculture is also a more water-intensive user than industry indicates a higher elasticity-of-input demand for irrigation (Friedman, 1962).
In agriculture high assurance of supply is needed when capital value invested in orchards and vineyards is high and crops are of a long-term nature. Table-grape farmers along the Lower Orange River do not rent water but buy it. The reason is that the investment in table grapes is high and more assurance is required. More renting of water takes place in Australia in areas where annual crops are grown (Australian Academy of Technological Sciences and Engineering, 1999).
Water quality and economic models of pollution trading offsets
Water quality is an aspect of the environmental use of water and pollution and will be studied in a specific scheme. Not only the volume of water must be conserved but its quality must be protected. With pollution of water, external costs are generated. Water quality is also a concern in the Olifants River (East), one of the main rivers in South Africa. Coal mines on this river are allegedly blamed for discharges into the river. The policy recommendations to improve the water quality in this river were highlighted after meeting stakeholders of the Olifants River (East) Forum (2006). Strong support from these stakeholders was received for policy options such as pollution permit trading and environmental offsets.
The catchment surface of the Olifants River (East) is fractured by mining activities, runoff decreases and water is drained into underground aquifers, which then seeps into streams. Pollution in the river and in Loskop Dam is high and one of the main problems is the effluent leakage from old disused mines. Mines have been permitted to release pollutants in the streams during periods of high flow, which is called the 'controlled release scheme'. During the years prior to the study in 2006, river flow was low and sufficient dilution of pollutants was not possible. Mines and power stations had to invest in desalination plants at considerable cost to dispose of pollutants.
Polluters should pay a discharge rate, in the same way as water abstraction users pay water charges. As in the case of a water market it is further proposed that a market be established for the discharge of pollutants and that this market be used to discover the optimum price for pollutant disposal. This proposal is supported by representatives of some mines (Lodewijks, 2006). All markets operate within particular rules. In a pollution-permit-trading market, rules that may be considered are that discharges into the river are allowed only when flow is sufficiently high and that trades may only occur within specific parameters. A permit-trading programme could complement desalination plants as some costs of these plants may be variable (reservoirs where the pollutants solidify/fill up).
Apart from a pollution-trading programme it is suggested that bio-diversity offsets be created to provide incentives for cooperation amongst stakeholders which may be mines, developers, environmental groups, farmers and public land agencies. Expert opinion is that the main source of pollution in the Loskop Dam is the leakage from abandoned old mines (pre1956). The problem with the defunct mines is that they leak pollutants all the time including during the period when river flow is low. DWAF has apparently accepted responsibility for these mines but they may not have the appropriate technology, which is also expensive, to desalinate the effluent. In an offsetting arrangement, incentives can be provided to existing mines to desalinate water from these defunct mines by allowing them to discharge a given amount in the Olifants River (East) when the water flow is sufficiently high. The above arrangement will cost the taxpayer nothing while discharge during low-flow periods is reduced.
Topics that need further research
The tools and models used in economic studies of water have been appropriate as they provided information on water-use values in different sectors and different uses. Understanding water markets in the various sectors assisted in policy decisionmaking. The information gained from these catchment studies also assisted in the water-marketing studies which were carried out subsequently.
The approach of the WRC to arrange meetings with stakeholders in the selected catchments to convey results from research was well received. Farmers were concerned about the application of the National Water Act of 1998, which may have a negative effect on investment, as findings indicate. The project-related meetings in catchments organised by the WRC and attended by the authors, were supported by stakeholders because all relevant issues were covered, such as efficiency, restitution, redistribution, environment, deficits and water quality. This shows that farmers want more information on all relevant issues. It also implies that a systems analysis approach to research is essential. The authors' own experience is that the South African water engineers are regarded by their counterparts as some of the best in their field. Some of the issues faced in water in South Africa require more than a technical approach, for instance, issues such as equity, environment and water quality. The economists view information differently from the engineer or hydrologist and the economist's perspective and economic studies should not be neglected.
If the purpose is to promote more efficiency in water use within sectors, then water-use-rights marketing is the correct approach and then the focus should be on improving water institutions. Water allocation through markets between sectors, irrigation schemes and farms requires a partnership between government (DWA) and market participants (private enterprise). The government cannot allocate water between farms as information to do so is not available in a centralised way.
The best way forward to promote re-allocation of water-use rights and maintain or improve water quality through market incentives, should be further researched. This is a controversial issue that receives constant media attention. In this article it is suggested that regulated market forces can provide incentives that can promote desirable outcomes.
Several of the studies recommend strengthening and support for a water-use-rights market (Nieuwoudt et al., 2008; Gillitt, 2004; Conradie, 2002; Louw, 2002; Bate et al., 1999; Armitage, 1999; Backeberg, 1997; Mirrilees et al., 1994). The studies in this article have shown that even the most sophisticated tools are blunt in trying to estimate the value of water (for example how can cost of risk in farming be measured to a high degree). The market does not only allocate water rights but provides an opportunity cost to water, which in turn provides incentives for water conservation.
It is suggested that research should focus on strengthening the water-use-rights market and how to keep transaction costs down. Water markets in South Africa are in their infancy and institutions need to be strengthened that also protect society and the environment from externalities (Backeberg, 2007). In all the studies undertaken, differences in the value of water resources between water use sectors within and between river catchments were recorded. Discussions need to be held with all stakeholders to ensure that institutions are experienced as legitimate and that the dynamics which determine water values and prices of water-use rights are well understood.
Conclusion
The tools used in the WRC research projects and reported in this article were innovative. Linear programming is useful in studying derived water use values in agriculture. The first task in a regional model is to simulate the existing cropping pattern. This can be achieved by restricting areas under different crops. This, however, limits the models' ability to simulate. Louw (2002) used positive linear programming which avoided this problem while Conradie (2002) used various risk-aversion coefficients in a risk-programming model. The problem is not that the models were not sophisticated sufficiently but the reliability of the data. Estimating the price elasticity of water using regression is problematic due to low variation in price data. This was minimised using data from poor and relatively wealthy groups of consumers. Econometric studies on risk indicate that irrigation farmers are highly risk-averse, especially where downside risk (losses possible) is concerned.
Econometric techniques of discriminant analysis, logit/ probit models and principal component analysis showed that water-use rights were sold in areas where the return per cubic meter of water is low and purchased in areas where it is higher. The economic explanation of 'best possible use' and 'efficient use' of water is that the return per cubic meter of water must be maximised. This happens in a water market as the rent return to water is maximised as water moves to a better use. In the rent return to water, risk is reflected as a cost (opportunity cost). The economic meaning of efficiency of water use and the rent return to water are thus synonymous concepts.
Water values differ significantly between sectors, between geographic areas and within geographic areas. The problem of comparing water values between the geographic regions is that different tools were used to value water. The tools used are more appropriate to study water values for different use sectors within a given study area. The value of water appears to be the highest for domestic use with agriculture being second. The third-highest use is forestry and, lastly, environmental use (estuaries). The environmental use has a public-goods component, which requires government intervention.
The focus should not only be on models but the results must be useful for decisions and actions. Some of the current investment in irrigation farming such as development cost is sunk (fixed). It is expected that water in future will be transferred to non-agriculture which implies that sunk investments will have a zero opportunity cost. This is because the cost of development of the land will have no value without water. The value (rents) now attached to land will transfer to water and water prices will accordingly increase. In the Crocodile River (East) and Berg River the future price of water was estimated to exceed the future price of land (land excluding water), which means that water prices may still double in real terms. This will probably also happen in other irrigation schemes and catchment areas. The transfer of rents from land to water should not affect the value of farms. The expected significant increase in water prices in a water market will provide further incentives for its conservation.
Through a market, water-use rights are transferred from less efficient producers who earn a lower return per cubic meter of water, to more efficient producers who earn a higher return per cubic meter of water. More importantly, a water-use-rights market discovers the opportunity costs of water that provides an incentive for conservation. If smallholder developing farmers (or previously disadvantaged individuals) are potentially adversely affected by water trading, then they must be protected through government intervention. For instance, in the case of the Crocodile River (East), it was suggested that smallscale cane growers should initially be discouraged from selling water-use rights to more capital-strong large-scale growers. Although the trading of water-use rights is an efficiency enhancing process, it should be controlled to prevent possible adverse impacts on achieving equity.
References
ARMITAGE RM (1999) An Economic Analysis of Surface Irrigation Water Rights Transfers in Selected Areas of South Africa. WRC Report No. 870/1/99. Water Research Commission, Pretoria, South Africa. [ Links ]
AUSTRALIAN ACADEMY OF TECHNOLOGICAL SCIENCES AND ENGINEERING (1999) Water and the Australian Economy. ISBN: 1875618503. [ Links ]
BACKEBERG GR (1997) Water institutions, markets and decentralised resource management: Prospects for innovative policy reforms in irrigated agriculture. Agrekon 36(4)350-384. [ Links ]
BACKEBERG GR (2007) Allocation of water use rights in irrigated agriculture: Experience with designing institutions and facilitating market processes in South Africa. Proc. USCID 4th International Conference on Irrigation and Drainage. 3-5 October 2007, Sacramento, California. [ Links ]
BACKEBERG GR and ODENDAAL PE (1998) Water for agriculture: A future perspective. Proc. 39th Ordinary General Meeting of the Fertilizer Society of SA (FSSA), 24 April, Sun City Hotel, Pilanesberg. [ Links ]
BATE R, TREN R and MOONEY L (1999) An Econometric and Institutional Economic Analysis of Water Use in the Crocodile River Catchment, Mpumalanga Province, South Africa. WRC Report No. 855/1/99. Water Research Commission, Pretoria, South Africa. [ Links ]
CONNINGARTH ECONOMISTS (2001) Regional Comparative Advantage of Water Use: The Orange River Case Study. Commissioned by USAID/Southern Africa, Pretoria, South Africa. [ Links ]
CONRADIE B (2002) The Value of Water in the Fish-Sundays Scheme of the Eastern Cape. WRC Report No. 987/1/02. Water Research Commission, Pretoria, South Africa. [ Links ]
ESPEY M, ESPEY J and SHAW WD (1997) Price elasticities for residential demand for water: A meta analysis. Water Resour. Res. 33(6)1369-1374. [ Links ]
FRIEDMAN M (1962) Price Theory. A Provisional Text. Aldine Publishing Co., Chicago, US. [ Links ]
GILLITT CG (2004) Water Markets in Irrigation Areas of the Lower Orange and Crocodile Rivers of South Africa. WRC Report No. KV 160/04. Water Research Commission, Pretoria, South Africa. [ Links ]
HOSKING SG (2010) The Valuation of Estuary Services in South Africa Specifically Regarding Changes to Estuary Services as a Result Of Reductions to Fresh Water Inflows. WRC Report No. 1413/1/10. Water Research Commission, Pretoria, South Africa. [ Links ]
HOSKING SG, DU PREEZ M, CAMPBELL EE, WOOLDRIDGE TH and DU PLESSIS LL (2002) Evaluating the Environmental Use of Water: Selected Case Studies in the Eastern and Southern Cape. WRC Report No. 1045/1/02. Water Research Commission, Pretoria, South Africa. [ Links ]
LODEWIJKS H (2006) Personal communication, 10 October 2006. Mr Henk Lodewijks, Anglo-American, Johannesburg South Africa. [ Links ]
LOUW DB (2002) The Development of a Methodology to Determine the True Value of Water and the Impact of a Potential Water Market on the Efficient Utilisation of Water in the Berg River Basin. WRC Report No. 943/1/02. Water Research Commission, Pretoria, South Africa. [ Links ]
MIRRILEES RI, FORSTER SF and WILLIAMS CJ (1994) The Application of Economics to Water Management in South Africa. WRC Report No. 415/1/94. Water Research Commission, Pretoria, South Africa. [ Links ]
NIEUWOUDT WL, GILLITT CG and BACKEBERG GR (2005) Implication of risk in irrigation water transfers in South Africa. In: Tsagarakis KP (ed.) Proc. International Conference on Water Economics, Statistics and Finance, 8-10 July 2005, Rethymno, Crete, Greece. [ Links ]
NIEUWOUDT WL, DÖCKEL JA, MOSAKA D and POTT AJ (2008) Towards the Establishment of Water Market Institutions for Effective and Efficient Water Allocation in South Africa. WRC Report No. 1569/1/08. Water Research Commission, Pretoria, South Africa. [ Links ]
NIEUWOUDT WL, BACKEBERG GR and DU PLESSIS HM (2004) The value of water in the South African economy: some implications. Agrekon 43(2)162-183. [ Links ]
RSA (REPUBLIC of SOUTH AFRICA) (1998) National Water Act (No. 36 of 1998). Gov. Gaz. 398, No. 19182. Government Printers, Cape Town, South Afrca. [ Links ]
RSA (REPUBLIC of SOUTH AFRICA) (RSA) (2004) National Water Resource Strategy (NWRS) (1st edn.). Department of Water Affairs and Forestry, Pretoria, South Africa. [ Links ]
TEWARI DD (2003) An Estimation of the Value of Water in the Commercial Forestry Sector in Selected Areas in South Africa: A Case Study of KwaZulu-Natal. WRC Report No. 1133/1/03. Water Research Commission, Pretoria, South Africa. [ Links ]
VAN ROOY D (2006) Personal communication, 9 October 2006. Mr Dawie Van Rooy, TSB Sugar, Malelane, South Africa. [ Links ]
WRC (WATER RESEARCH COMMISSION) (1998) WRC Technical Report 1998. Water Research Commission, Pretoria, South Africa. ISBN: 1-86845-436-3. [ Links ]
WRC (WATER RESEARCH COMMISSION) (2000) WRC Technical Report 2000. Water Research Commission, Pretoria, South Africa. ISBN: 1-86845-668-4. [ Links ]
WILLIAMS CJ, VECK GA and BILL MR (2008) The Value of Water as an Economic Resource in the Greater Letaba River Catchment. WRC Report No. 989/1/08. Water Research Commission, Pretoria, South Africa. [ Links ]
This paper was originally presented at the Water Research Commission 40-Year Celebration Conference, Kempton Park, 31 August - 1 September 2011.
* To whom all correspondence should be addressed. +27 33 345-1852; fax: +27 33 345-1852; e-mail: vesta@mweb.co.za

