


Services on Demand
Article
 English (pdf)
 Article in xml format
 Article references
Indicators

Related links
-
 Cited by Google
 -
 Similars in Google
Share

 Permalink
Water SA
On-line version ISSN 1816-7950
Print version ISSN 0378-4738
Water SA vol.37 n.5 Pretoria Jan. 2011
Modelling the feasibility of retrofitting hydropower to existing South African dams
SJ van Vuuren*; CL Blersch; M van Dijk
Department of Civil Engineering, University of Pretoria, Pretoria, 0001, South Africa
ABSTRACT
An investigation was carried out with the primary objective of ascertaining whether it is possible to develop a model for determining the feasibility of retrofitting hydropower to existing dams in South Africa. The need for such a model is primarily due to the growing importance of small-scale hydropower projects resulting from the global shift towards renewable energy and the South African energy crisis, the increased price of energy and the introduction of feed-in tariffs for renewables. The model is intended for engineers, typically working on behalf of a client who would like a simple first order assessment of feasibility. It therefore takes all technical, environmental, social and financial considerations into account in order to provide a recommendation on whether or not a project would be feasible.
Achieving the primary objective required an in-depth study of the theory and literature related to the current electricity situation in South Africa as well as all the different components and considerations of hydropower projects. This theoretical knowledge could then be utilised to develop a computer model which combines the most important considerations into a cohesive whole in order to make a recommendation on feasibility. The accuracy and applicability of the model could then be ascertained through testing, using actual case studies in South Africa. Three test cases were utilised which yielded positive results.
A number of difficulties were encountered. These related mainly to the development of an accurate means for pricing the different components primarily due to a lack of response from suppliers. Such issues were solved through the use of theoretical formulas and studies which provided good results. Ultimately, a model was developed which includes financial, environmental and social considerations and provides values that are accurate enough as an initial tool in determining whether or not to continue with a retrofitted hydropower project.
Keywords: hydropower, retrofitting, feasibility
Introduction
The global shift towards renewable energy and the ongoing South African energy crisis have created an environment where small-scale hydropower projects, such as those which are retrofitted to existing dams, are both environmentally and financially attractive. In the engineering field, as with all professions, time is money and constant attention is therefore paid to developing easy ways to solve complex problems as well as improving and refining the existing practices. Retrofitted hydropower, or any form of hydropower in fact, involves many interrelated inputs and components, and conducting an initial feasibility study can therefore be time-consuming. An investigation was carried out with the primary objective of testing the assertion that it is possible to develop a model to be used as an initial step in the determination of the feasibility of a retrofitted hydropower project, hence saving time and money in the earliest stage of a project.
Literature review and technical background
The current energy situation
South Africa has developed over time as a country whose economic development has been centred on energy, with the energy sector contributing about 15% of the GDP (Spalding-Fecher et al., 2003). This has resulted in an energy-intensive economy. Only 10 other countries worldwide are known to have higher commercial primary energy intensity than South Africa (U.S. Energy Information Administration, 2008).
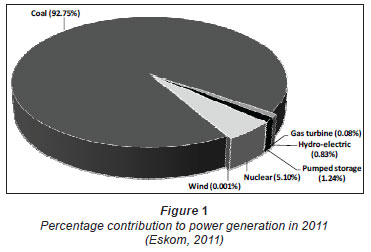
Eskom generates 95% of South Africa's electricity with the remaining 5% made up by a small group of private individuals who generate electricity mainly for their own use (Department of Minerals and Energy (DME), 2007). Eskom owns 13 coal-fired power stations, a nuclear power station, two pumped storage schemes, six hydroelectric power stations, one wind farm and four gas turbines which are only used for peak demands (Eskom, 2011). The distribution of power is shown in Fig. 1.
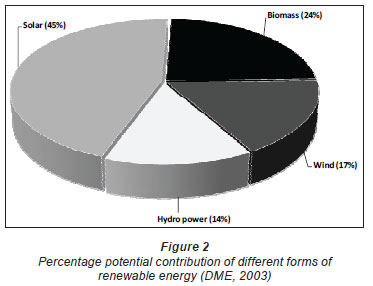
With South Africa experiencing serious electricity shortages in recent years, it has become essential to step up the plans for future electricity development. The South African Cabinet approved the Integrated Resource Plan (IRP) for Electricity (2010 - 2030) as the basis for South African power generation for the next 20 years. The approved plan is geared towards a low carbon future and aligned with the country's long-term mitigation scenarios in line with national government's aspiration. It is envisaged that 42% of the new-build programme, excluding Eskom's current committed capacity expansion programme, will be from renewable energy sources between 2011 and 2030 (Eskom, 2011). By 2030, it is anticipated that the percentage of energy generated from CO2-free sources (including nuclear energy) will be nearly 30% (Eskom, 2011). South Africa has significant potential for renewable energy production in many forms as shown in Fig. 2.
Although South Africa is a fairly dry country, there is potential for the development of all forms of hydropower in specific sites throughout the country, with the Eastern Cape and KwaZulu-Natal showing the greatest promise (DME, 2002; DME, 2003). The total technically feasible hydropower potential is estimated to be 11 000 GWh/year, with an economically feasible potential of 4 700 GWh/year. Of this small potential, 1 400 GWh/year is currently being exploited. South Africa's potential for small-scale hydropower generation amounts to 880 GWh/year of which 16 MW is currently in operation at 6 different plants (The International Journal on Hydropower and Dams, 2006).
Advantages of hydropower
Hydropower has the following advantages over other forms of energy production in terms of economics, social and environmental impacts:
• Firstly, hydropower is a form of clean renewable and sustainable energy as it makes use of the energy in water due to flow and available head without actually consuming the water itself. Unlike the burning of coal, oil and natural gas, it does not emit any atmospheric pollutants such as carbon dioxide, sulphurous oxides, nitrous oxides or particulates such as ash (Frey and Linke, 2002).
• Secondly, hydropower schemes often have very long lifetimes and high efficiency levels. Operating costs per annum can be as low as 1% of the initial investment costs (Oud, 2002).
• A third advantage is that hydropower schemes often have more than one purpose. Hydropower through water storage can be used for flood control and can supply water for irrigation or consumption, and dams constructed for hydropower can also be used for recreational purposes (Frey and Linke, 2002). Different forms of hydropower including reservoir, pumped storage and run-of-river systems of various sizes are available and can be used for different forms of electricity generation (IHA, 2005).
Retrofitted hydropower
One of the advantages of hydropower, discussed above, is that it has many different applications, ranging from very small-scale run-of-river projects to the large-scale construction of dams. This investigation focused on a lesser known form of hydropower such as retrofitting existing dams and reservoirs with hydropower plants. Instead of dams being constructed for the sole purpose of hydropower and then having different functions, reservoirs that are already in existence for other purposes are fitted with hydropower plants in order to meet base or peak electricity demands. Obviously the application of this form of hydropower is limited as there are a fixed number of dams in existence, but the advantages are numerous because the energy is there waiting to be harnessed and additional environmental impacts are minimised. This form of hydropower is particularly beneficial for smaller plants where the construction of a large dam would be completely unfeasible (ESHA, 2004).
Legislative considerations
Before a hydropower plant can be constructed on a dam, it is necessary that specific authorisations be obtained from the relevant authorities. The following should be considered:
• Dam-owner permission: Before a project can commence, it is vital to obtain permission from the owner of the dam to utilise the facility for power generation.
• Water-use licence: Permission to abstract water from the dam has to be obtained from the Department of Water Affairs (DWA). In general, the generation of hydropower does not consume water or create an additional demand, in which case the only applicable costs are the water-use charge. If, however, it is concluded that the plant has a negative influence on the quality of the water released, a water-discharge cost will be incurred once the 'polluter pays principle' is implemented.
• Generation licence: The Energy Regulation Act (No.4 of 2006) gives a very clear outline of the procedures and regulations involved in the production of electricity. Under this act, the National Energy Regulator of South Africa (NERSA) is granted the sole authority to approve applications for the generation of electricity and any person who generates, distributes, transmits, imports, exports or trades electricity can only do so with a licence granted by NERSA (RSA, 2006).
• Power-purchase agreement: Lastly, hydropower can be generated for a number of reasons and sold to an array of different people including private enterprises, local municipalities and Eskom. Whatever the case, a power-purchase agreement must be signed with the authority or purchaser of the electricity under the supervision of NERSA unless produced for own use.
Electromechanical equipment and considerations
Basic concepts
The basic concept of hydropower is that hydro turbines convert water pressure into mechanical shaft rotation which is then used to power an electric generator or some other form of electricity generating machinery. The basic mathematical relationship is that the potential power output is directly proportional to the flow through the turbine and the available pressure head. This can be stated as follows:
P=ηρ,gQH
where:
| P | = | mechanical power output | [W] |
| η | = | hydraulic efficiency of the turbine | [%] |
| ρ | = | density of water | [kg/m3] |
| g | = | gravitational acceleration = 9.81 | [m/s2] |
| Q | = | flow rate through the turbine | [m3/s] |
| H | = | effective pressure head across the turbine | [m] |
Turbines
Turbines convert the energy from falling water into rotational shaft power. They can be classified according to their type of action as either impulse or reaction turbines.
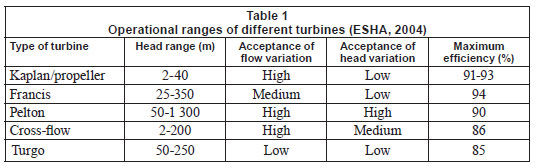
Impulse turbines make use of runners which operate in air by the action of a jet of water at a high velocity. There are three principal types including the Pelton, Turgo and cross-flow or Banki-Michell turbines. Pelton turbines are used only in high head applications, with ranges of above 50 m to almost 1 300 m, and usually have very good efficiencies (ESHA, 2004). Turgo turbines can operate using smaller-diameter runners to obtain the same power output as a Pelton turbine (Paish, 2002). They operate at heads of between 50 m and 250 m and can operate at flows of 20% to 100% of the design flow which gives them a high degree of flexibility. The third type (cross-flow or Banki-Michell), are applicable over a wide range of heads (2 m to 200 m) but have a lower efficiency than other turbines (ESHA, 2004).
Reaction turbines generate upward hydrodynamic forces to turn the runner blades by utilising oncoming flow. The most notable types are the Propeller or Kaplan and the Francis turbine (Paish, 2002). Kaplan turbines are used in low-head applications of 2 m to 40 m and are usually large as they are required to handle large flows in order to make such low-head projects viable. Francis turbines are used in medium-head situations of 25 m to 350 m (ESHA, 2004).
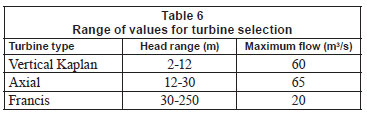
Turbine design is carried out by the manufacturer and does not fall within the engineer's scope of work on a hydropower project. This design includes sizing, layout of the turbine housing and, in the case of the compact hydro, design of the electrical component. The factors to consider in turbine selection and design are the net available head or effective pressure head across the turbine and the range of flow values which the turbine must be able to handle. A summary of the applicability of each type of turbine is given in Table 1.
Generators
Turbines are coupled to generators in a hydropower scheme in order to transform the mechanical energy produced by the turbine into electrical energy. There are two main types of generator, synchronous or asynchronous, that are used depending on what is required in terms of network characteristics. Both types of generator are being constantly improved and the newest generators have efficiencies of almost 100% (Bakis, 2007).
In applications of less than 15 MW, the range to which the hydropower retrofitting model (HRM) applies, a water-to-wire system will most likely be utilised. The manufacturer or supplier will therefore typically select the most appropriate generator for the project.
Control systems and electrical equipment
Turbine design and selection are based on the premise that operating conditions will be within the turbine's capacity in terms of flow and head. It will be necessary to regulate the conditions using devices such as gates, guide vanes, nozzles and valves if one of the design parameters changes. Small hydropower schemes often make use of automated control systems which have three significant advantages in that they can decrease maintenance costs, increase reliability and increase turbine efficiency (ESHA, 2004). Various other electrical components are necessary, including a plant service transformer; backup power supply; sensors for the measurement of head and tail-water levels; and an outdoor substation (ESHA, 2004):
Transmission lines transfer the generated power from the plant to where the demand for electricity exists. If it is possible to connect to the grid at a location very close to the transmission lines, then this will be a minor consideration. If, however, the site is more remote, the significance of transmission lines can greatly increase. The cost of transmission lines varies with distance, terrain and voltage requirements.
Civil works
Housing structure
A turbine-housing structure must be constructed to protect the electromechanical equipment including the inlet valve or gate, the turbine, the generator, the control and protection systems, and the transformer if required. Its size will be determined by the size and layout of each of the aforementioned components, the available head and the geomorphological conditions on site (ESHA, 2004). The factors that must be considered include location, cavitation, buoyancy forces, water forces due to water striking the turbine, potential flooding, layout of the components and geotechnical conditions.
Intake structures
An intake structure is required to convey the water from the dam or reservoir to the powerhouse and turbines. The intake must be designed in such a way that it minimises head losses, cost, operational and maintenance requirements as well as negative environmental impacts. This involves the consideration of hydraulic and structural aspects, operational requirements which generally relate to the design flow rate and environmental issues which will be specific to each project. Trash racks or debris grids must be placed at the entrance to the intake in order to prevent plant matter, debris and large stones from entering the intake structure.
Outlet structure
The outlet part of the system involves the design of the channel which carries the water exiting from the turbine back to the river. If the powerhouse is situated close to the river, direct transfer without any construction is possible (Price and Probert, 1997). If, however, the exit velocities are high, a tailrace or canal structure must be specially designed in order to minimise erosion, to ensure that the stability of the powerhouse is not altered, and to ensure that the operation of the turbine runner is not affected (ESHA, 2004).
Environmental and social aspects
Every construction project that takes place in South Africa is subject to environmental regulations under the National Environmental Management Act of 1998. According to the Act, plans for the construction of facilities or infrastructure for the generation of electricity which have a capacity of 20 MW or more or cover an area greater than 1 ha, require the completion of an environmental impact assessment (EIA) and are subject to regulations under the environmental authority of the province. If, however, the plant does not exceed the aforementioned limitations, only a basic assessment report (BAR) is required.
Potential environmental impacts of hydropower
A thorough review of potential impacts of retrofitted hydropower was conducted. The basic areas of consideration included:
• The actual use of land and the impact of construction processes
• The impacts of river diversion, both temporary and permanent on the downstream channel characteristics
• Type of power that will be generated and hence the type of releases that are required
• The impact on aquatic fauna and flora
• Increased noise levels occurring during the construction and operational phases
• Visual impacts of the final product after construction
• The impact on residents in the area by altering the flow of water they receive, destroying land that they deem culturally significant, or altering the natural habitat in a way that they find unacceptable
Despite all the possible negative environmental impacts, there is one major positive environmental consequence in the form of greenhouse gas emission reductions which indirectly affects wildlife, nature and the general public.
Potential social impacts of hydropower
As part of the environmental assessment phase, the interested and affected parties are identified and provided with opportunities to voice their concerns and objections with regard to the proposed project. The expectations of the public with regard to environmental and social impacts of hydropower have grown significantly over time and are therefore becoming increasingly important (Klimpt et al., 2002). The general areas of consideration are:
• The cultural heritage of the site
• Potential public health threats resulting from changes in downstream flow regimes or changes in the water quality
• Public acceptance by the community and affected parties to increase buy-in and reduce vandalism
• Impacts on downstream agricultural activities
• The balance between community upliftment and the preservation of traditional ways of life.
Financial considerations
Determining the feasibility of a retrofitted hydropower project requires analysing the monetary value of all the different components and works in terms of initial installation costs as well as maintenance and running costs and balancing these against potential incomes.
Legislative costs
Legislative costs incurred are as follows:
• Firstly, it may be required to pay a fee to the owner of the dam in order to use it.
• Secondly, costs are incurred in obtaining a water-use licence. These include the actual licensing fee and water use costs that must be paid to the DWA and the new DWA tariffs (DWAF, 2009).
• Thirdly, the costs involved in obtaining an electricity generation licence from NERSA must be considered. The actual licence itself from NERSA is free, but the costs involved in the preparation of the necessary documents and proposals to NERSA will have to be included.
Environmental and social costs
The primary environmental and social cost is incurred in conducting the necessary studies of environmental impacts. A BAR typically costs between R150 00 and R200 000, and an EIA between R600 000 and R1 000 000.
Electromechanical equipment costs
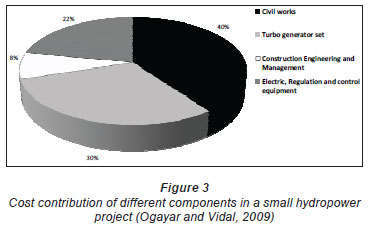
Turbine costs can contribute about 30% to 40% of the total project cost as shown in Fig. 3 (Ogayar and Vidal, 2009). Generator costs, on the other hand, contribute only about 5% of the total project cost (Bakis, 2007).
Various authors have attempted to aid engineers by researching and compiling data from many projects in order to generate an all-encompassing formula which can be used for cost determination in the early feasibility stages of a project before quotes from suppliers are obtained.
Ogayar and Vidal (2009) conducted a best-fit analysis to determine generalised formulae for the cost of electromechanical equipment involved with each type of turbine, based on installed capacity and available head. The results, converted to rands using the 2009 exchange rates, are as follows:
| Pelton: | Cem = | 201 . 645 ( 10 - 3 P ) -º - 3 6 4 4 7 2 5 H -º - 2 8 1 7 3 5 |
| Francis: | Cem = | 292 . 878 ( 10 - 3 P ) - 0 - 5 6 0 1 3 H - 0 1 2 7 2 4 3 |
| Kaplan: | Cem = | 378 . 787 ( 10 - 3 P ) - 0 - 5 8 3 3 8 H - 0 1 1 1 3 9 0 1 |
where:
| Cem | = | cost of electromechanical equipment | [R/kW] |
| P | = | installed capacity (power output) | [W] |
| H | = | effective head | [m] |
The most recent research involved a study of 81 hydropower projects in 32 countries around the world in order to determine a trend relating electromechanical costs to power output of the project. The electromechanical costs include costs of turbines, valves, cooling and drainage systems, cranes, workshops, generators, transformers, control equipment and auxiliary systems. The following formula was generated in addition to a number of graphs and curves for the different turbine types (Alvarado-Ancieta, 2009):
| Cem = | 9.742(10-6 P ) 0.7634 (106) |
where:
| Cem | = | cost of electromechanical equipment | [R] |
| P | = | installed capacity (power output) | [W] |
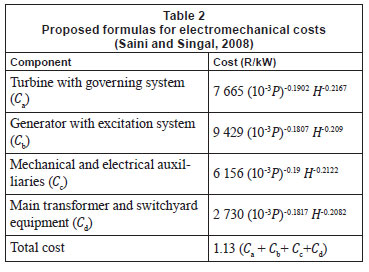
The author claims that this formula is applicable within an error range of 5% to 10%, which is significantly better than that of Ogayar and Vidal (2009). Finally, Saini and Singal (2008) proposed the formulas in Table 2, converted to rands from Indian rupees, based on costs obtained from Indian suppliers, and P and H as defined above.
Civil works costs
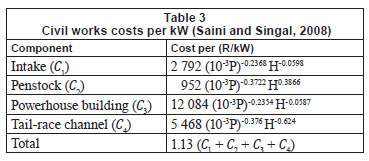
The cost of civil works can contribute about 40% of the total cost of smaller hydropower projects, as shown in Figure 3 (Ogayar and Vidal, 2009). Determination of the cost of civil works as a function of available head in metres and installed capacity in kW has been studied by various authors. Saini and Singal (2008) used actual costs of civil works in 2007 and a method of correlation to generate the following formula for civil works of retrofitting existing dams with hydropower. The formulas converted to rands are given in Table 3.
Chenal (2000) compiled an all-inclusive formula, given below, for small hydropower installations of less than 1 MW based on available head in meters and installed capacity in kilowatt. Unlike the formulas of Saini and Singal (2008), Chenal's formula applies to small-scale hydropower plants in general and not to the specific case of retrofitting existing dams with hydropower, and includes other costs which would therefore have to be subtracted in order to obtain the civil works cost. The constants have been converted to rands.
Operation and maintenance costs
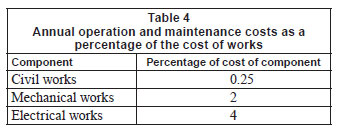
The generally accepted practice for the inclusion of operation and maintenance cost is to take a percentage of the cost of works as listed in Table 4.
Design fees
Design fees relate to the acceptable percentage of costs to be paid for engineering consultancy work in the project design. Recommendations for design fees are given by the Engineering Council of South Africa (ECSA) as part of the Registered Professions Act. Fees can be hourly rates, but generally for feasibility studies, where many assumptions are made, they are quoted as a percentage of the cost of works (ECSA, 2009). The total value for design services rendered will be the sum of the civil, structural, electrical and mechanical components based on the cost of works of each different type.
Tariffs
One of the major economic problems facing hydropower development in the past has been the low tariffs that Eskom has been willing to pay for renewable energy. With South Africa's high level of carbon emissions, reliance on coal and severe energy shortage, the government has been forced to reconsider the state of renewable energy tariffs in order to reach their target of 10 000 GWh of renewable energy by 2013 (Flak, 2009). This prompted the announcement of a set of renewable energy feed-in tariffs by NERSA at the end of March 2009. The primary aim of these tariffs was to cover generation costs with allowance for a profit potential that is sufficiently attractive to stimulate investment (NERSA, 2009). The initial REFIT tariff for small hydropower plants was 94c/kWh which was, however, reduced to 67.1 c/kWh by NERSA in March 2011. The Department of Energy (DoE), with the endorsement of NERSA, introduced the Integrated Resource Plan (IRP) for Electricity 2010-2030 (DoE, 2011). The Integrated Resource Plan (IRP) for South Africa 2010 has been subjected to public scrutiny and comments and eventually the whole process manifested into a Final Policy Adjusted IRP 2010: New-build Technology Mix. The DoE subsequently allocated different capacities across various renewable energy technologies from the total development capacity of 3 725 MW. The hydropower sector has been allocated overall capacity of 75 MW to be commercially operational by June 2014 based on a REBID scheme where IPPs (independent power producers) would competitively tender to implement projects.
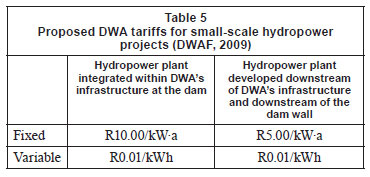
The DWA also decided to charge a fee for the use of water in small-scale hydropower production up to 20 MW. Upon suggestions from affected parties a proposal was suggested in which a rate per kWh was proposed in conjunction with a fixed cost based on kW installed as shown in Table 5.
Carbon credits
Through the signing and ratification of the Kyoto Protocol (Boom, 2001), industrialised countries are now legally bound to decrease their emissions by an average of 5.2% of the measured levels in 1990 over the period 2008 to 2012 (Capoor and Ambrosi, 2008). Besides simply reducing emissions, three flexible mechanisms arose from this which allow for compensation from emission reductions including Certified Emission Reductions (CERs) and Emission Reduction Units (ERUs) which can be sold by developing countries, like South Africa, to countries who are obliged to meet emission targets. There is, however, uncertainty on the future of the Clean Development Mechanism (CDM) after 2012 which is the end of the Kyoto commitment period.
Important rates and values
The first application of the model was in 2009 and an inflation rate of 8.4% and prime interest rate of 11% (First National Bank, 2009) were assumed. Exchange rates are based on the value as of 17 June 2009 which was R8.07/USD.
The hydropower retrofitting model (HRM)
The HRM is a comprehensive, logical and accurate model which can be used in the initial phases of a project to determine the feasibility of retrofitting existing South African dams with hydropower. The aim of the model is not to generate an actual design but rather to ascertain financial, environmental and social feasibility at pre-feasibility level and make a recommendation about whether or not the project is worth further investigation.
Technical and civil works costs and considerations
Available head
The velocity head, friction losses in the channel and penstock as well as secondary losses at the inlet and outlet were ignored in order to avoid complex initial assumptions. Therefore, only the minimum operating level (MOL), full supply level (FSL) and tail water level (TWL) are required to determine an initial estimate of the maximum and minimum available heads.
Flow
The user must decide what type of power generation is required as follows:
• A set amount of flow is drawn off constantly to produce a constant amount of power
• Peaking power is produced during the peak times of the day by condensing daily releases into the peak hours
• A variable amount of flow is drawn off up to a maximum that the turbine can handle.
This decision is left up to the engineer. The HRM requires only a minimum and maximum possible flow rate as well as the number of hours of operation per day to be inputted.
Turbine selection and electromechanical costs
Selection charts for compact hydropower were obtained from BFL (India), Ossberger (Germany), CKD Blansko Engineering (Czech Republic), UCM Resita (Romania), VA Tech Hydro (Austria) and Gilkes Hydropower (England), a series of well-known suppliers mainly based in Europe that supply turbines for hydropower all over the world. The charts were compared based on the types of turbines available, the operational ranges of each and the power output they offer, with VA Tech Hydro and Gilkes offering the most appropriate charts. The user is required to enter the MOL, FSL, TWL and minimum and maximum flow into the model and the turbine type is automatically selected based on the values given in Table 6. The HRM then refers the user to the selection chart for that specific turbine type where the appropriate size for the available flow and head can be determined.
An initial attempt to estimate turbine costs was made by contacting turbine manufacturers. However, only limited information could be obtained which resulted in referring back to the literature and the work of Alvarado-Ancieta (2009) in particular. Alvarado-Ancienta's formula for cost determination (converted to rands) of all neccessary electromechanical equipment for Francis and Kaplan turbines was chosen because it is straightforward to use, recent, all encompassing and was recommended by one of the local manufacturers.
Transmission lines
The cost involved with the construction of transmission lines can become substantial if the power station is in a remote location thus requiring the lines to cover a large distance. Attempts were made to find a simplified method for incorporating transmission line costs. However, the many different variables to consider made this impossible. Inputting a transmission line cost into the HRM is thus left up to the user based on past experience.
Civil works cost
Referring to the literature study, equations developed by Saini and Singal (2008), appeared more appropriate because they are applicable up to 15 MW, are recent and clearly indicate the cost of each different component and how they contribute to the total civil works cost.
In order to adjust these formulas developed in India for application to the South African situation, the case studies at the Vaal Dam and at the Sol Plaatje Dam and Merino Dam near Bethlehem, which will be discussed later, were used as actual values for civil works and electromechanical costs are available. The results showed that the civil works costs range from 3.54 to 4.57 (with an average of 3.98) times greater in South Africa than in India. The average value was used in the model, and its accuracy will be shown in the discussions of the case studies.
Political and legislative costs and considerations
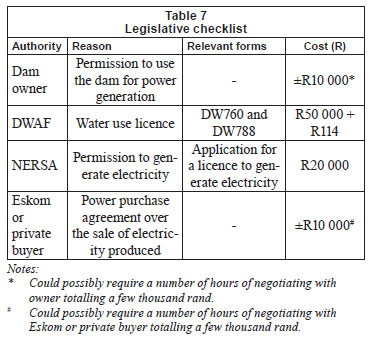
The various legislative concerns as previously discussed will be tabulated in the model as a checklist of the different permissions that must be granted. The costs of obtaining the relevant licences are assumed constant and the cost involved in preparing the different forms and documents required will be considered in the HRM as a professional fee based on the values shown in Table 7.
The only variable cost relates to the proposed DWA usage tariff outlined in the literature review. The installed capacity of the works in MW is known; therefore calculations simply involve multiplying this by the relevant costs as follows:
ICMW (365)(1000)TF = ICKWA
where:
| ICMW | = | installed capacity | [MW] |
| T | = | operational hours per day | [h] |
| F | = | fractional allowance for outages | [-] |
| ICKWA | = | annual generation capacity | [kWh/a] |
Potential outages are typically taken as 0.1 (10%) but is left at the discretion of the user in the model.
Total cost 1000ICMWFC + ICKWAVC
where:
| FC | = | fixed cost | [R/kW] |
| VC | = | variable cost | [R/kWh] |
Environmental and social costs and considerations
Environmental considerations
Possible environmental considerations and potential impacts which could result from a retrofitted hydropower project, based on the literature study, were identified and separated according to whether they are likely to occur in the construction or operation phases of the project. A manner in which to weight and categorise the different considerations was formulated based on four criteria with a value ranging from 1 to 5 assigned to each. Guidelines on assigning the values for each criterion were developed but are not presented here. The criteria include:
• Area (Ae) which can be defined as the space that the environmental impact will affect.
• Duration (De) of the impact with a scale ranging from short-term impacts during construction to long-term, permanent impacts which will be considered as most significant.
• Seriousness (Se) of the impact related to the significance of the environmental damage.
• Vulnerability (Ve) of the area affected in terms of the value of the land, ecosystems and natural environment with priority given to more ecologically valuable areas.
These were used to determine the importance of the different potential impacts using the following formula:
Importance (Ae +De+Se) X Ve
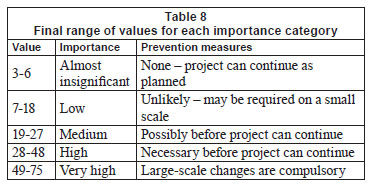
The importance categories are shown in Table 8 and the application of the categories to the considerations is shown in Table 9 and Table 10. Note that the minimum importance value is based on a vulnerability of one and maximum value on a vulnerability of five.
The only required inputs for the determination of the environmental costs are the proposed capacity and area covered by the project. These determine whether a BAR or EIA must be conducted. A cost of R175 000 was allowed for a BAR and R800 000 for an EIA.
Social considerations
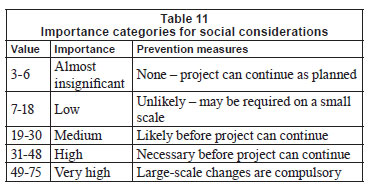
A similar weighting system as used for environmental impacts will be used to determine the importance of each of the social effects as presented in Table 11. The criteria are as follows:
• Population (Ps) or number of people that will be impacted by the process
• Duration (Ds) of the impact on the affected population
• Severity (Ss) of the impact related to the magnitude of the impact on the affected parties in terms of changes to their way of life
• Vulnerability (Vs) of the community or affected party
An identical formula to that of the environmental section is used:
Importance (Ps +Ds+Ss)Vs
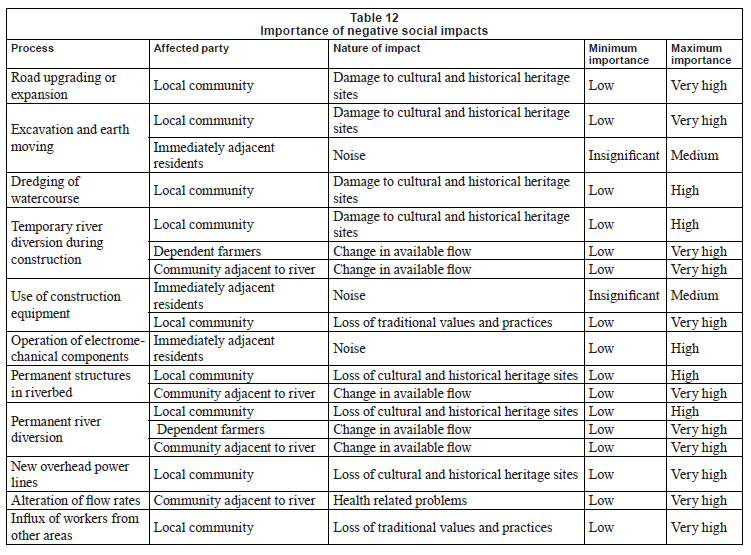
The importance ranges, as shown in Table 11, are slightly different to the environmental considerations to avoid over-conservative estimates of importance. The minimum and maximum values for each impact are given in Table 12 where the minimum value is based on the lowest possible vulnerability and the maximum is based on the highest possible vulnerability.
Unlike the environmental impacts, positive social impacts will be considered separately to the negative ones because they contain considerable weighting. A checklist was developed which combines the potential benefits of a retrofitted hydropower project into a simple list of questions to determine whether the project will promote sustainable development and growth in the surrounding region. The checklist is as follows:
• Will roads be built or upgraded that can serve the surrounding community?
• Will other types of infrastructure or services be built or upgraded to the benefit of local residents?
• Will there be potential for electricity provision in local areas from the power produced, or construction of new transmission lines that could benefit the community?
• Will the project result in emission reductions?
• Will investment be stimulated in the region?
• Will jobs be created during the construction period?
• Will jobs be created after the construction period?
Potential income
Income is calculated in the case studies based on an average Eskom electricity price of 51.7 c/kWh and installed capacity. This can, however, be changed by the user of the HRM. Income can also be generated from carbon credits but this will only be considered if the project is not viable without them.
Financial model
The model ends with a financial balance sheet of all relevant costs and benefits.
The first part is a summary of the total mechanical, electrical and civil works costs taken as initial costs occurring at the start of a project. Other initial costs that are included are:
• Legislative costs related to licensing and preparation of documents and forms
• Total environmental and social costs
• Design fees
• Contingencies taken as 10% to 15% of the cost of civil works to allow for unforeseen expenditures
• Preliminary and general costs taken as 25% of the civil works cost
The second part includes all the annual costs involved in the running of the plant throughout its projected life. The following costs are included:
• Annual legislative costs payable to DWA
• Insurance costs of between 0.15% and 0.25% of the civil and mechanical replacement value
• Operation and maintenance costs as listed in Table 4
The third part contains the potential annual income available from the sale of electricity. Additional income is only added from the sale of carbon credits if the project is not viable without them. Financing and loan repayments, depreciation, tax and inflation are also taken into consideration.
The final section of the financial model combines all the calculated incomes and expenditures into one spreadsheet. The results are then analysed using the internal rate of return which can be compared to acceptable values for a civil engineering project, typically 10%.
Final recommendation
Environmental, social and financial viability is considered individually returning a value of 'Acceptable' or 'Not acceptable'. If all three read 'Acceptable', a final recommendation of 'Viable' is returned. The project will be viable as long as all of the following criteria are met:
• None of the environmental impacts has a rating of 'very high'
• Less than half of the environmental impacts have a rating of 'high'
• None of the social impacts has a rating of 'very high'
• Less than half of the social impacts have a rating of 'high'
• If social upliftment is required, at least half of the requirements in the checklist are met
• The internal rate of return of the project is greater than 10%
It should be noted that the user must consider each of the environmental and social impacts rated as high or very high individually, to ensure that these are effectively mitigated.
Application of the model
Three case studies were conducted in order to ascertain the applicability of the model in the South African context. Two of these are described in detail this paper whilst the third case study involved an application of the model to the Jozini Dam in KwaZulu-Natal for an initial feasibility study.
Case Study 1: Bethlehem Hydro
The Bethlehem Hydro Project originally dates back to 1999 when MBB Consulting Engineers informed NuPlanet (Pty) Ltd of the potential for small-scale hydropower development in the Bethlehem area. This is due to the large and constant water flow coming from the Lesotho Highlands Water Project which emerges in the area. Pre-feasibility and feasibility studies and various legislative processes took almost 6 years to complete with construction beginning at the start of 2007 and completed by the end of 2009.
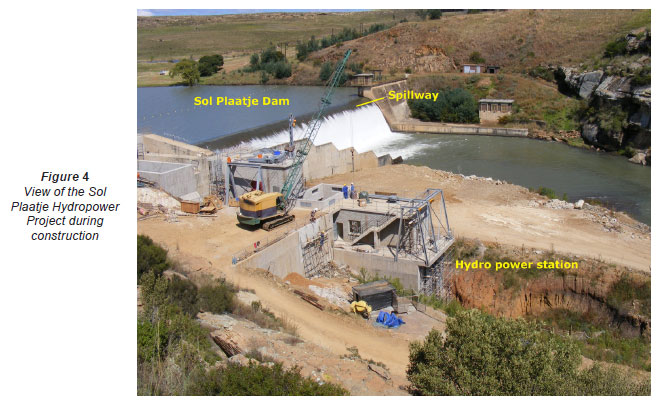
The project comprises two schemes, only one of which was considered for application of the HRM. The Sol Plaatje Power Station is located on the right-hand bank of the Sol Plaatje Dam near Bethlehem directly downstream from a new intake which was constructed within the non-overspill section of the dam (Fig. 4). The power station is a retrofitted, small-scale project which provided an ideal first candidate for the testing and refinement of the HRM.
Technical component
The required input data for the site is summarised in Table 13.
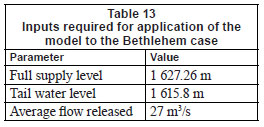
These values are inputted into the model which revealed that a 2.15 m Kaplan turbine would be most effective. In the actual project, a 2.1 m Kaplan turbine was selected. The potential power output from the HRM for the selected turbine showed only a 7% deviance from the actual value which is a good correlation. The difference can be attributed to a higher assumed efficiency.
The HRM produced an electromechanical cost of R21 million compared to the actual value of R10 million. The large difference is due to the fact that the turbines for the project were sourced from BFL India which offers much more competitive prices than the European suppliers that the formula used applies to.
The civil works costs were calculated using the method previously discussed giving a total civil works cost of R26 million. The calculated value compares well with the actual value for the project of R25 million, with only a 7.4% error.
The cost of transmission lines must be inputted by the user based on previous experience. The actual cost of R1.3 million, given by engineers working on the Sol Plaatje Project, was used for further calculations.
Environmental component
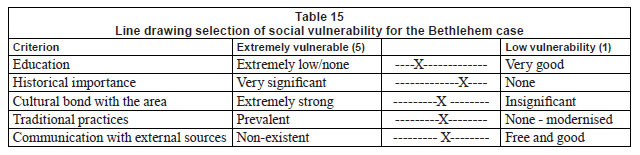
For both the environmental and social components of the HRM, it is only necessary to select the vulnerability of the area. It is recommended that all considerations be written down in a logical way for comparison. A good example of such a method is the use of a line drawing in which the extremes of each criterion are defined and the position of the particular project within the range between the extremes is denoted. The results are shown Table 14.
Considering the line drawing, a vulnerability of 3 was selected. The results from the HRM showed that no factors had very high importance and exactly half are of high importance. The project should therefore meet the environmental requirements but each of the 'high' ranked factors should be considered individually in case mitigation or prevention measures are necessary.
In the determination of environmental costs, only the area and installed capacity are required. The installed capacity is way under the 20 MW maximum for a BAR but the surface area is over 1 ha and therefore a full EIA is required.
Social component
As with the environmental component, all that is required for the user is to select a vulnerability of the surrounding population. The line-drawing analysis used is summarised in Table 15.
Because the Bethlehem area is remote and rural but has a small town with some level of modernised development, the line drawing reveals a moderate vulnerability rating of 3. The results show that only 17% of the factors are 'highly important' and none are 'very high', thus resulting in an acceptable socioeconomic impact rating.
Financial model
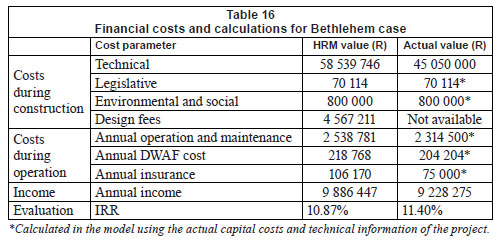
The financial modelling can now be completed based on the costs calculated in the previous sections of the HRM. A summary of the important costs, obtained using the calculated and actual values, is given in Table 16.
The actual and calculated rates of return are similar. The difference is due to the overestimation of the electromechanical costs as these costs are calculated using a formula which is applicable to European manufacturers whereas the actual supplier is from India. Using the formula of Saini and Singal (2008), which is specifically applicable to an Indian context, an electromechanical cost of R10.8 million is obtained resulting in a rate of return of 15.61% which is higher than the value obtained using the actual project costs. The model was therefore modified to allow the user to choose between Indian or European suppliers.
Final recommendation
The environmental, social and financial viability of the project are considered individually before a final recommendation is made. The following output is obtained:
Environmental viability ACCEPTABLE
Social viability ACCEPTABLE
Financial viability ACCEPTABLE
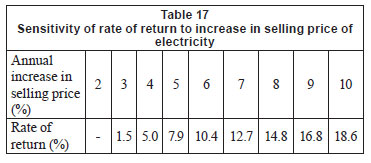
The cost of electricity sales in the HRM was increased annually by the 2009 inflation rate of 8.4%. The sensitivity of the rate of return to the annual increase in electricity sale prices is given in Table 17 using the Indian formula. It is clear from this table that with an annual increase below 6% the project would not be viable and that project viability is incredibly sensitive to electricity sale prices.
Case Study 2: Vaal Dam
A second case study examined the feasibility of retrofitting the Vaal Dam, the largest dam by area in South Africa and one of the most important dams in the country for the provision of water. The dam, located to the south of Johannesburg, is the primary supplier of water to the Gauteng region, the economic centre of South Africa. A number of different engineering firms including Aurecon, Goba and SSI have been involved in pre-feasibility analyses of retrofitting the Vaal Dam with hydropower and various locations on the dam are being considered. The primary motivation for this is that the dam releases a constant minimum flow all year round with larger flows occurring during flood periods. This means that there is always flow available for hydropower production.
Technical component
The key inputs for selection and sizing of the electromechanical components for the Vaal Dam are listed in Table 18.
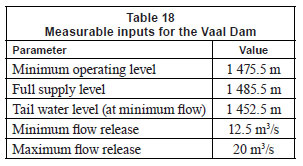
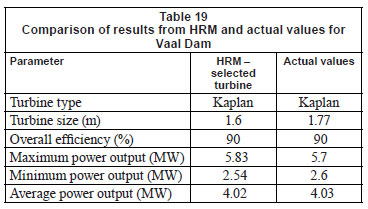
Using the average head and flow, a 1.6 m Axial Kaplan turbine would be most appropriate. The Vaal Hydro report suggests a 1600 or 1770 Axial Kaplan turbine. According to the selection charts, these would apply under maximum flow conditions over the entire head range. The selected turbine was compared with actual values from the Vaal Dam feasibility study. The results as shown in Table 19 below show excellent correlation.
The HRM assigns an electromechanical cost of R28 million to the turbine compared to the value obtained from the report of R34 million. An underestimation of about 17% is apparent which is significant. On the other hand, the civil works costs of R34 million were calculated in the HRM which is 12.3% more than the Vaal Report value. As explained in the Bethlehem case study, the cost of transmission lines must be assumed and inputted by the user. A value of R800 000 is given in the Vaal Dam report. This value will be used for further calculations.
Environmental component
Selection of the vulnerability of the Vaal Dam area was conducted using the same line-drawing method as that used in the Bethlehem case with similar criteria for selection. It was concluded that the Vaal Dam area is not highly vulnerable and a value of 2 was therefore selected. This meant that no factors have an importance of 'very high' and only 8% are highly important meaning that the Vaal Dam project will clearly pass the environmental requirements.
As with the Bethlehem case, installed capacity is much less than 20 MW and therefore a BAR will be required, provided that the total area covered is less than 1 ha. According to the Vaal Dam report, the engineers involved expect that only a BAR will be required.
Social component
In order to ascertain the social vulnerability of the Vaal Dam area, the same line-drawing technique and criteria as those used in the Bethlehem case were utilised revealing a low vulnerability of only 2 for the area. This resulted in none of the factors having a rating of 'high' or 'very high' meaning that no serious negative social impacts can be expected.
Financial model
Assumed values were taken from the Vaal Dam report, except that prime interest and inflation were taken as the current values as previously presented. A summary of the results is given in Table 20.
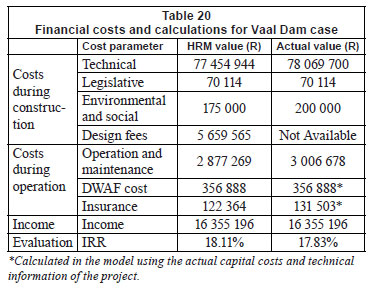
Final recommendation
The social, environmental and economic aspects are considered individually and together to determine whether the project is in fact viable. The following results are obtained:
Environmental viability ACCEPTABLE
Social viability ACCEPTABLE
Financial viability ACCEPTABLE
The final recommendation is therefore that the project is viable. If the actual costs are used, a slightly lower rate of return is obtained because of the underestimation of electromechanical and civil works costs that occurred when the HRM was used, and the modelling therefore also indicates that the project is viable. The actual report uses a different method to determine viability, through the use of similar assumptions to calculate the required price that electricity should be sold at for the project to produce a return. According to the report, this value is 47c/kWh. The conclusion that the project is viable based on the assumed tariff of 51.7c/kWh therefore agrees with the report's conclusion. Note that if the electricity sale price increases by less than 4.5% per annum the rate of return would be below 10%.
Case Study 3: Jozini Dam
The third case study involves an application of the model to the Jozini Dam in KwaZulu-Natal where the uMhlosinga Development Agency (UMDA) has proposed retrofitting the dam with a hydropower plant to promote development and investment in the area.
The social, environmental and economic aspects were considered individually and together to determine whether the project is in fact viable. The social and financial viability was acceptable but the environmental viability was found to be not acceptable.
This should not, however, be viewed as cast in stone but rather as a guideline. Each of the severe impacts must be reviewed and mitigation measures can be implemented to minimise the environmental impacts. Reducing the area, duration or seriousness of an impact will reduce its importance level and the project can thus become viable. Socially and financially, the project is acceptable with the calculated rate of return of 23% significantly higher than the minimum of 10%.
Conclusions and recommendations
South Africa has an extremely energy-intensive economy in relation to the rest of the world. The current energy crisis has opened up a window for investors to look into independent power production. Our reliance on coal as a means of energy production is not environmentally friendly or sustainable and new ways of generating electricity are therefore required. There is potential to move toward renewable forms of energy, with hydropower being a key focus.
A typical hydropower project would require the consideration of technical, legislative, environmental, socioeconomic and financial aspects. Each of these has a role to play in the determination of feasibility at the early stages of a project. These aspects were successfully combined into a computer model which requires only a few measurable inputs to produce a recommendation of viability. These include the costs of electromechanical components and civil works, legislative costs and general costs associated with any civil engineering project, which are successfully combined into a financial spreadsheet. All potentially negative environmental and social impacts are listed for consideration and a method for weighting their importance and making a recommendation in their regard was developed. The model is comprehensive in that it includes all necessary costs and factors, and simple to use in that the inputs required by the user are minimal.
In terms of the comprehensiveness of the model, on the environmental and socioeconomic side, the model is comprehensive and well-constructed without excessive simplification of the facts. However, on the technical and civil works side, the ideal method for incorporating these costs into the model would have been to obtain costs from suppliers and manufactures and use these in the model. This proved to be impossible. The less ideal solution of using formulas developed in other countries therefore had to be used. The formulas were used critically and altered as needed to suit their application in South Africa and their use can therefore be justified.
The model was tested using three case studies and its accuracy and applicability were quantified. The accuracy of the HRM was ascertained through its application to the Bethlehem and Vaal Dam cases where actual values were available for comparison. The two cases clearly highlighted areas where the HRM is inaccurate and areas in which good results are obtained. They also highlighted the sensitive areas where good assumptions are required. In general, the HRM provided good results. The Bethlehem case revealed the relevance of considering the selection of potential suppliers carefully because of lower costs, and when the Indian formulas were used very good results were obtained. In the Vaal Dam case, costs were slightly overestimated producing a lower rate of return, but being conservative in this regard is better than substantially underestimating the costs - which could result in money being wasted in pursuing a project that is not viable.
The applicability of the HRM was determined through application of the model to the Jozini Dam, a case for which no data were available for comparison and indicated the model's applicability in the earliest project stages.
In conclusion, the following recommendations are made:
• If it is possible to obtain actual costs for electromechanical equipment and a means of incorporating civil works costs based on actual South African figures, the model should be altered to incorporate these rather than the formulas used.
• If a simple method for determining transmission line costs is developed, this should be included in the HRM to eliminate the need for the user to input a value.
• The HRM should ideally be tested against more cases. This would require obtaining project information for retrofitted hydropower cases (most likely in other countries), including costs and components selected, and comparing them to values generated by the HRM. The more test cases used, the more accurate the model can become through calibration and adjustment.
Acknowledgements
The following organisations are acknowledged for their assistance and providing information for this study: Aurecon, SSI Engineers and Environmental Consultants, Department of Water and Environmental Affairs, the uMhlosinga Development Agency, VA Tech Hydro (Austria) and CKD Blansko Engineering. The authors wish to thank the Water Research Commission for assistance in this research field.
References
ALVARADO-ANCIETA CA (2009) Estimating E&M powerhouse costs. Water Power Mag. 17 21-25. [ Links ]
BAKIS R (2007) Electricity production opportunities from multipurpose dams (case study). Renew. Energ. 32(10)1723-1738. [ Links ]
BOOM J-T (2001) International emissions trading under the Kyoto Protocol: credit trading. Energ. Pol. 29(18) 605. [ Links ]
CAPOOR K and AMBROSI P (2008) State and Trends of the Carbon Market 2008. URL: www.worldbank.org (Accessed 29 April 2009). [ Links ]
CHENAL R (2000) Évaluation du cout de construction d'une petite centrale hydro-electrique nouvelle et complete et du prix revient du kWh (P < 1'000 KW). URL: www.mhylab.com/fr/pages/pdf/cout_PCH.pdf (Accessed 22 June 2009). [ Links ]
DOE (DEPARTMENT OF ENERGY, SOUTH AFRICA) (2011) Integrated Resource Plan for Electricity 2010-2030, Government Gazette No. 34263. Government Printer, Pretoria. [ Links ]
DME (DEPARTMENT OF MINERALS AND ENERGY, SOUTH AFRICA) (2002) Capacity Building in Energy Efficiency and Renewable Energy, Baseline Study - Hydropower in South Africa. Report No. COWI P54126/EE/RE/70. Department of Minerals and Energy, Pretoria, South Africa. [ Links ]
DME (DEPARTMENT OF MINERALS AND ENERGY, SOUTH AFRICA) (2003) White Paper on Renewable Energy. URL: www.dme.gov.za/pdfs/energy/renewable/white_paper_renewable_energy.pdf (Accessed 12 February 2009). [ Links ]
DME (DEPARTMENT OF MINERALS AND ENERGY, SOUTH AFRICA) (2007) Energy Security Master Plan. URL: www.dme.gov.za/pdfs/energy/energy_sec_master_plan.pdf (Accessed 11 March 2009). [ Links ]
DWAF (DEPARTMENT OF WATER AFFAIRS AND FORESTRY, SOUTH AFRICA (2009) Proposed Tariffs for the Use of DWAF Water Resources for Small Scale Hydropower Generation with a Capacity of not Greater than 20MW. Department of Water Affairs and Forestry, Pretoria, South Africa. [ Links ]
ECSA (ENGINEERING COUNCIL OF SOUTH AFRICA) (2009) Guidelines, Scope of Service, and Tariff of Fees of Persons Registered in Terms of the Engineering Profession Act, 2000. URL: www.ecsa.co.za/documents/20090101_TimebasedFees.pdf (Accessed 17 May 2009). [ Links ]
ESKOM (2007) Build Programme in South Africa. URL: www.eskom.co.za/live/content.php?Item_ID=28 (Accessed 12 March 2009). [ Links ]
ESKOM (2009) Generation Divisions Plant Mix. URL: www.eskom.co.za/live/content.php?Item_ID=28 (Accessed 12 March 2009). [ Links ]
ESKOM (2011) Integrated Report. URL: www.eskom.co.za/live/content.php?Item_ID=28 (Accessed 15 October 2011) [ Links ]
EUROPEAN SMALL HYDROPOWER ASSOCIATION (ESHA)(2004) Guide on How to Develop a Small Hydropower Plant. URL: www.esha.be (Accessed 19 March 2009). [ Links ]
FIRST NATIONAL BANK (2009) SA Economic Indicators. URL: https://www.fnb.co.za/aboutus/rates/saIndicator.html (Accessed 11 June 2009). [ Links ]
FLAK A (2009) Industry greens applaud SA's renewable tariff. Reuters, 2 April 2009. URL: http://uk.reuters.com/article/2009/04/02/safrica-renewables-idUKL221250820090402?sp=true. [ Links ]
FREY GW and LINKE DM (2002) Hydropower as a renewable and sustainable energy resource meeting global energy challenges in a reasonable way. Energ. Pol. 30(14)1261-1265. [ Links ]
INTERNATIONAL HYDROPOWER ASSOCIATION (IHA) (2005) Hydro's Contribution. URL: www.hydropower.org/downloads/F1_The_Contribution_of_Hydropower.pdf (Accessed 19 March 2009). [ Links ]
KLIMPT J-E, RIVERO C, PURANEN H and KOCH F (2002) Recommendations for sustainable hydroelectric development. Energ. Pol. 30(14)1306-1311. [ Links ]
NERSA (NATIONAL ENERGY REGULATOR OF SOUTH AFRICA) (2009) NERSA Decision on Renewable Energy Feed in Tariff. URL: www.nersa.org.za (Accessed 27 April 2009). [ Links ]
OGAYAR B and VIDAL P (2009) Cost determination of the electro-mechanical equipment of a small hydro-power plant. Renew. Energ. 34(1)6-13. [ Links ]
OUD E (2002) The evolving context for hydropower development. Energ. Pol. 30(14)1215-1223. [ Links ]
PAISH O (2002) Small hydro power: technology and current status. Renew. Sustain. Energ. Rev. 6(6)537-556. [ Links ]
PRICE T and PROBERT D (1997) Harnessing hydropower: A practical guide. Appl. Energ. 57(2/3)175-25. [ Links ]
RSA (PARLIAMENT OF THE REPUBLIC OF SOUTH AFRICA) (2006) Electricity Regulation Act. Act No. 4 of 2006. Government Gazette No. 28992. URL: www.info.gov.za/view/DownloadFileAction?id=67855 (Accessed 2 May 2009). [ Links ]
SAINI R and SINGAL S (2008) Cost analysis of low-head dam-toe small hydropower plants based on number of generating units. Energ. Sustain. Dev. 12(3)55-60. [ Links ]
SPALDING-FECHER R and WILLIAMS A (2003) Energy and environment in South Africa: charting a course to sustainability. Energ. Sustain. Dev. 4(4)8-17. [ Links ]
THE INTERNATIONAL JOURNAL ON HYDROPOWER AND DAMS (2006) World Atlas and Industry Guide. Int. J. Hydropower Dams 96-98. Aqua~Media International, Sutton. [ Links ]
U.S. ENERGY INFORMATION ADMINISTRATION (2008) Country Analysis Brief: South Africa. URL: www.eia.doe.gov (Accessed 19 February 2009). [ Links ]
This paper was originally presented at the Water Research Commission 40-Year Celebration Conference, Kempton Park, 31 August - 1 September 2011.
* To whom all correspondence should be addressed. +27 12 420 2438; fax: +27 12 362 5218; e-mail: fvuuren@eng.up.ac.za

