


Servicios Personalizados
Articulo
 Inglés (pdf)
 Articulo en XML
 Referencias del artículo
Indicadores

Links relacionados
-
 Citado por Google
 -
 Similares en Google
Compartir

 Permalink
Water SA
versión On-line ISSN 1816-7950
versión impresa ISSN 0378-4738
Water SA vol.37 no.4 Pretoria oct. 2011
Investigating water meter performance in developing countries: a case study of Kampala, Uganda
Harrison E MutikangaI,II,IV,*; Saroj K SharmaI; Kalanithy VairavamoorthyI,II,III
IUNESCO-IHE Institute for Water Education, Westvest 7, 2611 AX Delft, The Netherlands
IIDelft University of Technology, Stevinweg 1, 2628 CN, Delft, The Netherlands
IIIUniversity of South Florida, 4202 East Fowler Avenue, CGS 101, Tampa, Florida, USA "National Water and Sewerage Corporation, Plot 39 Jinja Road, Kampala, Uganda
ABSTRACT
High levels of water losses in distribution systems are the main challenge that water utilities in developing countries currently face. The water meter is an essential tool for both the utility and the customers to measure and monitor consumption. When metering is inefficient and coupled with low tariffs, the financial sustainability of utilities is at stake. Apparent water losses caused by metering inefficiencies can be reduced by assessing meters' performance and identifying the main causes of inefficiency. This paper examines the performance of 3 meter models, on the basis of failure records for a developing world water utility in Kampala city, Uganda. The influence of sub-metering on meter accuracy is also examined. The results indicate a high meter failure rate (6.6%/year) in Kampala. Over 75% of failures were observed in the volumetric (oscillating-piston) meter types with the main cause of meter failure being particulates in water. The study also indicates an average reduction in revenue water registration of 18% due to sub-metering. The reduction was not because of water use efficiency but due to the combined effect of the metering errors of the sub-meters. This clearly implies that when properties are sub-metered, customers should be charged proportionately based on master meter readings, for accurate water accountability. The findings of this study will be useful for both utility managers and meter manufacturers who work in the water industry, especially in developing countries, to make appropriate metering and sub-metering decisions.
Keywords: Developing countries, meter performance, sub-metering, water utilities
Introduction
Water losses in the distribution system are categorised as either real losses (leakage) or apparent (commercial) losses. Apparent losses occur due to illegal use, inaccuracies in metering, meter reading errors, data handling and billing errors, and have a negative impact on utility revenue and accuracy of water usage data (AWWA, 2009).
One of the tools that has received considerable attention in urban water demand management is universal metering (McKenzie and Wegelin, 2009; Sharma and Vairavamoorthy, 2009). Universal metering refers to systems where meters have been installed on all properties and billing is based on the volume of water used rather than on flat rate (or nonmetered) billing. Sub-metering has also been widely used as a tool to promote water conservation, notably in the USA. Water use reduction in the range of 10 to 30% has been reported as a result of sub-metering (AWWA, 2000). The term 'sub-metering' refers to any metering that occurs downstream of a water utility's master meter to measure individual resident water usage in apartments, condominiums, mobile home parks, and small mixed commercial properties (AWWA, 2000). However, universal metering and sub-metering has not brought the much anticipated benefits to water utilities in developing countries, most likely due to metering inefficiencies. Non-revenue water (NRW) resulting from meter inaccuracies and poor water meter management can be reduced by assessing meters' performance and identifying the main causes of malfunction.
It is now widely acknowledged that mechanical water meter's metrology becomes more and more inaccurate during their operating life due to 'wear and tear' of the measuring components (Arregui et al., 2006b; Male et al., 1985). However, most studies carried out on metering have been based on water utilities of developed countries, with well-managed water distribution networks, notably the USA, Spain, France, and Italy (Arregui et al., 2006a; Criminisi et al., 2009; Pasanisi and Parent, 2004; Richards et al., 2010). Water meter performance in water systems of the developing countries, often with poorlymanaged networks and relatively lower water quality in the distribution system, is not very well understood.
This paper attempts to close the knowledge gap by investigating water utility metering problems in developing countries, using a case study of Kampala city, Uganda. The utility meter failure records were analysed for meters of size DN 15 mm. In-situ investigations and meter testing were also carried out for in-service meters, to investigate the influence of sub-metering on utility revenue water. The following section introduces the case study, followed by the research methodology used in this study. Subsequent sections present results, conclusions and recommendations.
Profile of case study water utility
The Uganda National Water and Sewerage Corporation (NWSC-Uganda) is a public utility wholly owned by the Government of Uganda, East Africa. It was established in 1972 to operate and provide water and sewerage services in urban areas entrusted to it, on a sound, commercially- and financiallyviable basis. The total number of towns currently served by the NWSC is 23, including the capital city of Kampala (MWE, 2010). This study focuses on the Kampala Water Distribution Network (KWDN).
The universal metering policy in NWSC-Uganda was initiated in the early 1990s, and today all of the customer service connections are metered. There were 153 994 metered water service connections in Kampala at the end of December 2010. The number of service connections with meters of size 15 mm is about 92% of the total service connections (or 141 675 service connections). These connections thus represent a sizeable investment for the utility and are mainly domestic users and small commercial customers. For this size of meters, there are 2 types of in-service meter models: velocity type or inferential meters (multi-jet and single-jet) and volumetric or displacement (oscillating-piston type) meters. Three meter models were examined in this study: the volumetric meter types (Model 1 and 2) from 2 different manufacturers and the multi-jet meter type (Model 3). Models 1 and 2 are the most dominant in the network and make up about 76% of all the small meters of size 15 mm; 24% are of the velocity type. Single-jet meters were not considered for this study as they have only recently been introduced (= 1 year prior to the time of writing). The average age of the meters is about 10 years, with some meters being more than 20 years old. Until recently there was no proactive meter sampling, testing and replacement. Only reported stolen and vandalised customer meters were replaced. However, meter management has improved tremendously in the past 3 years (2007-2010) and essential meter testing equipment in the meter laboratory renewed. There are 2 meter test benches, one of which was 2 years old at the time of writing. The human resource personnel in the laboratory are well trained and headed by a graduate engineer. However, in light of the task at hand, the number of current meter management personnel (0.25 staff per 1 000 customer meters) is insufficient. There is a need for more manpower for enhanced meter management with more proactive meter sampling, testing and replacement.
The annual water delivered to the system during calendar year 2010 was 52 237 838 m3. The NRW for the year was estimated at 40.9% or 21 346 351 m3, with real and apparent losses estimated at 56% and 44% of NRW, respectively. The breakdown of apparent losses into its components can be found in Mutikanga et al. (2011). The amount of water unmeasured in Kampala by DN 15 mm meter sizes (both working and failed meters) was estimated at an average of 58 m3/meter-year. This is rather high compared to average figures of 19 to 49 m3/meter-year reported for a study done on 2 water utilities in the USA (Male et al., 1985). Most pipes in the KWDN are over 50 years old and signs of corrosion are evident whenever bursts or leaks occur. Water supply is irregular in most parts of Kampala city and asset management practices are inadequate (Mutikanga et al., 2009).
Research methodology
There are about 150 000 installed customer meters and 1.5 million users in Kampala city. Testing all of these meters and measuring consumption patterns can only be realised by defining and establishing representative samples.
The methodology used in this study for sampling and meter testing has been used by many researchers (Allander, 1996; Arregui et al., 2006a; Criminisi et al., 2009; Newman and Noss, 1982; Yee, 1999). The method for estimating weighted meter accuracy was adapted from Arregui et al. (2006a) and is summarised in Fig. 1. This methodology is used for small customer meters and is also applicable to large customers as long as each user's demand profile is assessed individually. The detailed description of the methodology(Fig. 1) and equipment used for data logging can be found in Mutikanga et al. (2011).

Sub-metering
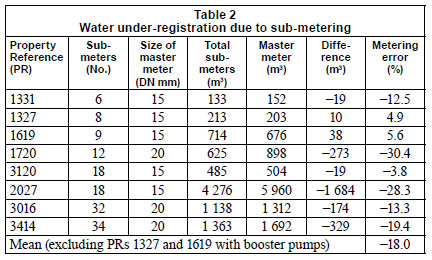
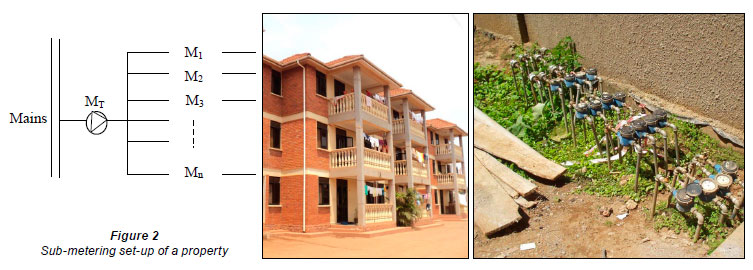
A sample of 8 sub-metered properties was selected from 4 operational zones (Administrative Branch Offices) in different parts of the KWDN to ensure a well-mixed homo geneous population that is representative of all sub-metered properties in the network. The properties were of varying sizes, with the smallest having 6 sub-meters and the larg est 34 sub-meters (Table 2). The total number of sub-meters for the 8 properties was 137, comprised of 119 residential sub-meters and 18 sub-meters for the single commercial property (mainly supermarket and office blocks). The prop erty references (Table 2) indicate actual network block maps where the properties are exactly located. The sub-meters examined in this study were of size DN 15 mm, while the master meters were of a variety of small sizes, DN 15 mm and DN 20 mm (Table 2). All of the in-service sub-meters investigated were of Class C and B multi-jet and positive displacement (piston-type meters). The distance between the master meter and the sub-meters varied from 0.5 m to 15 m depending on the premises set-up.

To assess the impact of meter separation on meter accuracy, new monitoring master meters were installed (where non existent) in series with property sub-meters for the individual apartments, as indicated in Fig. 2.
MT is the master meter and M1, M2, M3 and Mn are the n in-service sub-meters for the individual property units from 1 to n. Weekly and monthly meter readings were taken for the master meter and the sub-meters for a period of 4 months. This was done after thorough investigations to eliminate any leaks, illegal use and meter by-pass between the master meter and the sub-meters. The difference between the initial and final readings for each of the meters was obtained and taken as the volume of water consumption through the meter. The total water consumption of all of the sub-meters for each of the properties was obtained and compared to the master meter consumption for the same time period. The total difference for all of the properties was obtained and expressed as a percentage of the master meter total volume; this was taken as the metering error due to sub-metering.
In order to understand the cause of the difference in registered consumption, the smallest property with 6 sub-meters was examined in detail. Meter accuracy tests for the master meter and sub-meters were carried out to determine their level of accuracy, using the utility's meter test-benches. The volumes that were registered by these meters were then corrected using the calculated individual meter errors in accordance with the water balance equation, Eq. (1). Thereafter the master meter and all of the sub-meters were replaced by highly accurate meters (Class D, Qn = 1.0 to 1.5 m3/h, size DN 15 mm) and the experiment was repeated to eliminate any influence of the meter age on the metering error.

where:
| Qmaster meter | = | volume measured by the monitoring master meter |
| Errorsmaster meter | = | errors of the master meter |
| Qconsumer meter | = | volume measured by the sub-meters |
| Errorsconsumer meter | = | errors of the sub-meters |
Simultaneous customer demand profiling for the master meter and sub-meters was carried out to investigate whether customer demand patterns had an influence on the metering error due to sub-metering. Very accurate meters (Class D, Qn = 1.0 to 1.5 m3/h, size DN 15 mm) equipped with data loggers were used for the in-situ measurements. Meter Class (A, B, C, D) refers to the ISO classification for water meters and indicates the ability of the meter to measure low flows. Class D meters have the greatest ability to measure low flows and Class A have the least ability.
Pressure measurements were also carried out at the properties (using Hydreka Vistaplus pressure data loggers, type OCTC511LF/30) to investigate whether pressure differ ences also have an impact on the metering error due to sub metering. To determine the effect of pressure on the metering error, the experiment was carried out using Class D meters for the master meter and sub-meters under different residual pressures (5 m and 20 m) at the master meter point. Pressures were increased by isolating some parts of the network (shut ting off supply) in collaboration with the utility's water supply department.
Laboratory studies
Water meter testing
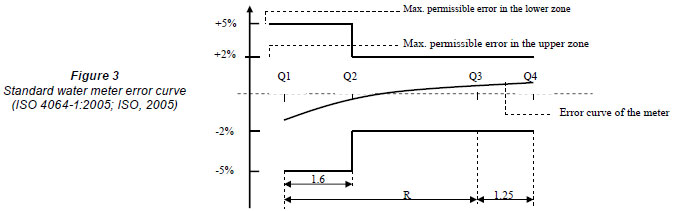
The metrological requirements for any type of water meter are given by the mean of 4 flow rates (European Commission, 2007; ISO, 2005). These are indicated on the standard meter error curve in Fig. 3, clearly indicating the minimum flow rate (Q1), transitional flow rate (Q2), permanent flow rate (Q3) or nominal flow rate (ISO 4064:1993; ISO, 1993) and the over load flow rate (Q4) or maximum flow rate (ISO 4064:1993; ISO, 1993) . The transitional flow rate occurs between the permanent and minimum flow rates, and divides the flow rate range into 2 zones: the upper zone with maximum permissible error of ±2% and the lower zone with maximum permissible error of ±5%.
The measurement characteristics of a water meter are defined by:
• Q3: continuous flow rate
• R: Q3/Q1 ratio (where Q1 is minimum flow rate)
• with secondary characteristics of:
• Q2: transition flow rate defined by Q2/Q1=1.6
• Q4: overload flow rate defined by Q4/Q3 =1.25
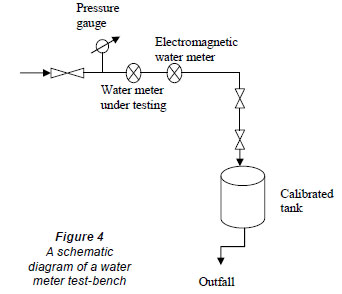
Meter testing was carried out using a volumetric calibration meter test-bench (Fig. 4) in accordance with ISO 4064-3:1993 (ISO, 1993) test methods and equipment. The test-bench consists of a water supply feed tank, pipe works, a calibrated tank for precise volume measurement, a pressure gauge, and a reference electromagnetic water meter capable of measuring very low flow rates (< 5 ℓ/h).
The mandatory ISO 4064:1993 flow rates used for testing the different metrological classes are indicated in Table 1. Meters with equal capacity (Q3) will have different minimum and transitional flow rates depending on the metrological class. Since old in-service meters are being tested, the old version of the ISO standard for water meter testing is applicable. This standard (ISO-4064-3:1993; ISO, 1993) is valid for meter models approved before October 2006, until 2016 (Arregui et al., 2006b).
The problem with the ISO and EN standards is that they are defined for new meters only. In this study, the ISO and EN standards were modified to include small flow rates that are vital for studying the performance of old meters. Metrological tests for the small property sub-meters were performed at 11 different flow rates (3.75, 7.5, 15, 22.5, 30, 120, 185, 375, 750, 1 500 and 3 000 ℓ/h) to depict as closely as possible the customer profiles, including the meter starting flow rate (Qs). The number of samples subjected to these 11 flow tests was limited due to the long flow times required to measure the extremely small flow rates and minimise uncertainty in the measurements.
The error ε, expressed as a percentage, is computed using Eq. (2).
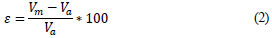
where:
Vm is the measured (registered) volume
Va is the actual volume.
Analysis of meter failure data
Meter failure records in the laboratory were also examined. However, no records were kept on meter failure until 2007. The 2007-2009 failure data was lacking in detail necessary for a meaningful analysis. The data details required for analyses included:
• The meter number and make
• The date of meter installation and date of removal from service
• The billing index (totalised registered volume) at time of removal from service
• The type and cause of failure (e.g. stuck piston).
As a result, the data used for this study was the most recent data i.e. that for the 2010 calendar year.
Data analysis
Sampling and flow measurements are all subject to uncertainties, which must be computed in order to draw conclusions about the results. Data generated in this study for field and laboratory measurements were analysed using MS Excel statistical data analysis tools (Gottfried. 2007) and the ISO/IEC (2008) guide to expression of uncertainty in measurement. Meter tests were repeated twice at medium and high flow rates and 3 times at low flow rates where variability and thus uncertainty is much higher. The commonly-used data set parameters (mean, variance, standard deviation and standard error) were examined in order to quantify uncertainties.
Results and discussion
Impact of sub-metering on revenue water
The results of measured revenue water for the 8 investigated properties with sub-meters are presented in Table 2. Properties PR 1331, PR 1327, PR 1619, PR 1720, PR 3016 and PR 3414 were residential apartments (2 to 6 floors); PR 3120 was singlefamily residential property with semi-detached houses and PR 2027 was a commercial complex (5 floors).
From Table 2 it is clear that there was meter under-registration on all properties apart from two (PR 1327 and 1619). The 2 exceptions had 1 common collection tank on the ground floor and a booster pump for pumping water to the various elevated storage tanks that feed different apartments. Since the booster pump was before the sub-meters' meters, it is likely to have increased flow rates to within the higher ranges of meter performance. The under-registration (metering errors) of revenue water due to the 6 sub-metered properties in Kampala city is estimated at 18%. The high variability in error values could be due to the inherent uncertainties in user flow rates and due to random errors during meter reading. Increasing the sample size of sub-metered properties and measurement precision could reduce the spread in error values. Despite these limitations, the results do provide insight into the effects of sub-metering on revenue water.
Influence of individual metering errors
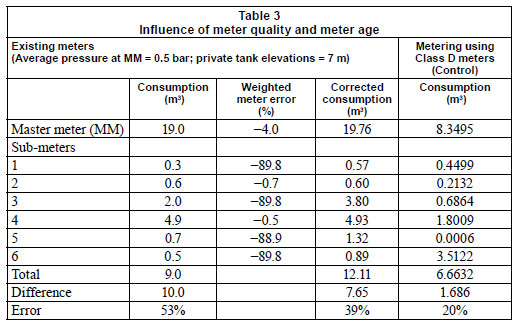
The experiment to determine the individual metering error due to sub-meters was carried out for a 1-month period and the results are summarised in Table 3. The metering error due to sub-metering was 53% before correcting for individual meter errors. After correcting for individual metering errors, the error reduced to 39%. The combined sub-metering error due to ageing was estimated as 14% (53% minus 39%). The sub-metering error using high-quality new Class D meters was 20%. This therefore implies that the error due to the individual sub-meters (including quality and age of meters) was 33% (53% minus 20%) for these premises.
Influence of pressure
By increasing residual pressure at the property master meter from 5 m to 20 m, the water under-registration (metering error) dropped to -4%, implying that the sub-meters were actually over-registering by 4%. This confirmed the earlier assumption of over-registration for properties with booster pumps. This makes sense based on the analogy of pressure-leakage flow rate relationships used to minimise leakage in water distribution networks (Thornton et al., 2008).
Since this error value was below 5%, it was concluded that, after taking care of both errors due to individual meters and errors caused by low flows due to low network pressures, the volume measured by the monitoring master meter was equal to the sum of the sub-meter volumes (Eq. (1)).
Influence of demand profile
The in-situ data logging results indicated that about 14.0% of the individual apartment usage was taking place at a flow rate below 15ℓ/h (Qmin. for a 15 mm size, Class C meter, Qn = 1.5 m3/h) and thus not recorded by the meters. Although individual sub-meters do not record these small flow rates, the master meter registers them as combined flows. For example, if each of the 6 apartments are using 10ℓ/h simultaneously, the submeters will not be able to register the flow rates but the master meter will be registering a total flow rate of 60ℓ/h with high accuracy. It is likely that other factors such as the 'ball valve effect' of the private service tanks could have amplified the metering errors of the sub-meters. Recent studies have shown that ball-valves induce very low flows through the meter thus increasing metering errors (Cobacho et al., 2008; Criminisi et al., 2009).
In Kampala service area, about 10% of total service connections (or 15 000 connections) are billed directly by submetering. Using an average annual consumption per service connection of 240 m3 and average tariff (July-June 2010) of 1 800 Ugandan Shillings (USh) per m3 (or 5.5 ZAR per m3), the annual financial loss to the utility as a result of sub-metering is conservatively estimated at USh 1.2 billion (ZAR 3.5 million). This excludes the sewerage charge component for apartments with a sewerage connection, cost of sub-meters and metering installations, cost of meter reading and billing administrative costs. Consequently, the findings of this study have policy implications for sub-metering and recommendations have been made with the aim of maximising utility revenues.
Meter failure analysis
Meter failures were grouped, based on volume used, into 6 sub-groups (0-500 m3, 500-1 000m3, 1 000-2 000m3, 2 0005 000 m3, 5 000-10 000 m3 and more than 10 000 m3). Although most previous researchers (Criminisi et al., 2009; Yee, 1999) preferred to group meters by age this was not possible in this study due to inconsistent and unreliable data about the date on which meters were first installed in the field. It was preferred to use volumes which could be easily verified. In any case it is usage and not age that affects meter accuracy and it may be prudent to measure the life of a meter based on totalised register volume rather than age (AWWA, 1999; Hill and Davis, 2005; Wallace and Wheadon, 1986).
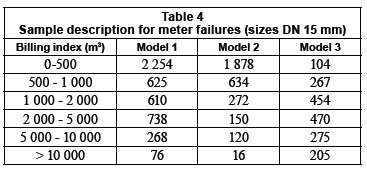
The total number of meter failures that were registered in the laboratory in the year 2010 was 10 235. Out of these, 9 891 were of size DN 15 mm, of which 9 416 were of Meter Models 1, 2 and 3, as shown in Table 4. The number of meter failures was then used with the total number of meters (DN 15 mm) in the system to estimate the meter failure rate for the KWDN for the DN 15 mm size group. The estimated failure rate for the KWDN (DN 15 mm) meters was 0.066 failures per meter per year.
However, not all reported defective meters ended up in the meter laboratory as records from the customer billing database indicated an average of about 6 000 defective meters per month for the year 2010. The technical plumbers who service and replace defective meters are often engaged in other revenue collection related tasks. Often meters are serviced on site and information is not sent to the meter laboratory for updating the database; thus the meter failure rate estimated is rather conservative. The problem of using data from the billing database is that it does not lend itself to easy analysis. Apart from numbers, it does not provide meter failure data in cohorts of size, make, type and cause of failure. It is a billing database not designed for water meter management.
The meter failure was categorised according to type and cause of failure, as shown in Figs. 5 and 6, which was observed on disassembling the meters and from laboratory records.


From Fig. 5, it is evident that Meter Models 1 and 2 have a high frequency of failure and most are actually failing 2 to 3 months after installation or before they register 500 m3. The most common cause of meter failure is related to water quality, as shown in Fig. 6. Due to high frequency of bursts and leaks coupled with poor pipe repair practices and inadequate mains flushing, a lot of silt and other suspended particulates enter the water system and get lodged in the meter drive mechanisms (reducing gear trains and oscillating piston) halting them from moving. In addition, a system with corroded pipes operating under intermittent conditions is likely to re-suspend a lot of deposited particulates in the pipe, which compounds the meter blockage problems (Vreeburg and Boxall, 2007). Over 75% of failures were observed in volumetric (oscillating-piston) type meters (Models 1 and 2). One of the disadvantages of oscillating piston meters is their sensitivity to suspended solids in water (Arregui et al., 2006b). Although 15 mm displacement meters (nutating disc and oscillating piston) are unrivalled for accuracy (Richards et al., 2010) and widely used in developed countries, they are not suitable for the KWDN, and, most likely, other water utilities in developing countries with similar water system characteristics. Inferential water meters are less affected because only part of the turbine is in the stream and does not get blocked up with particulates in water.
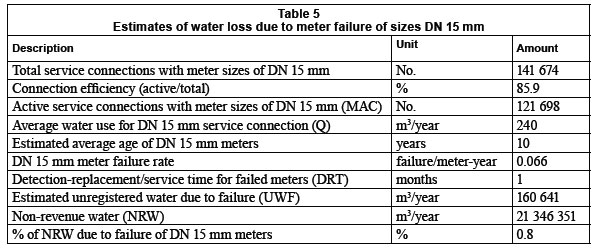
Estimation for water loss due to meter failure
The estimated water loss due to meter failure in KWDN is presented in Table 5. The estimation of the average detectionreplacement/service time (DRT) for failed meters is based on the utility meter reading policy. In the case of Kampala, the meter reading cycle (MRC) is 1 month and meter failures would be expected to exist for 15 days, on average, and 2 weeks was a reasonable time within which to service or replace the meter. DRT in this case was estimated to be 1 month.
Meter failure for small customer meters in Kampala makes up about 1% of annual NRW (Table 4). Although a lot of resources are put in by the utility to service defective meters, the impact of these on global NRW is minimal and more proactive strategies are required for cost-effective meter maintenance and sustainable reduction of water losses.
Lund (1988) reported meter failures of 1% for newer types of meters in Seattle Water Department. The meter failure rate in Kampala is about 7 times that in Seattle, probably due to the different water system characteristics. Meter failure and accuracy are greatly influenced by the water supply system in which they are installed (Wallace and Wheadon, 1986). Research has shown that meters in developing countries are more likely to malfunction due to intermittent supply (Criminisi et al., 2009). A study carried out to evaluate residential water meter performance in the USA by the Water Research Foundation indicated that meters subjected to pulsed flows decreased in accuracy at every flow rate to a greater degree than at constant-flow operation (Bowen et al., 1991). Gokhale (2000), as cited in Butler and Memon (2006), highlights meter problems associated with intermittent supply systems as:
• Sudden variations in flow rates subject the meter mechanisms to undesirable strain
• Alternate drying and wetting of meter parts; coming into contact with water is detrimental to continued satisfactory performance of meters
• Air that enters the distribution system is forced out through the meter at the start of supply causing meters to run at excessive speeds and thus increasing 'wear and tear' of meter parts
Conclusions and recommendations
Based on the analysis of performance of water meters in the KWDN, the following conclusions can be drawn:
• Sub-metering reduces utility revenue water in Kampala by 18%. This under-registration of sub-meters is due to individual ageing of sub-meters and low network pressures.
• For single-family apartments with storage elevated tanks, about 25% of water use occurred at flow rates between 0 and 35 ℓ/h. The high percentage of water use at very low flows, where meters are least efficient, contributes significantly to metering errors. In addition the ball-valve effect of the private elevated storage tanks magnifies this undermetering of revenue water.
• The volumetric positive displacement (piston-type) meters are not suitable for the KWDN due to the observed high failure frequency. They are probably more suitable for water networks with very good maintenance practices and no particulates in water.
Recommendations
In light of the key findings of this study, the following recommendations and guidelines are proposed to address the problems of billing systems based on sub-metering:
• Utilities must promote and support sub-metering as a policy in the context of promoting water conservation, and efficient and equitable use of water
• From the utility perspective of increasing the proportion of revenue vs. non-revenue water and improving cost savings, billing of multi-family apartments and commercial complexes must be based on the master meter, as is the practice in other states and cities, such as in California, Arizona, Maryland and many others in the USA (AWWA, 2000), and in Paris, France (Nguyen, 2010)
• The property owner or his agent should pass on the charges to the tenants based on actual consumption billing via the sub-meters and an agreed-upon allocation formula
• For condominium properties, formation of home owners associations (HOA) to manage water billing payments (master meter) and allocations (sub-meters) is recommended
• Development of national guidelines and policies is necessary to regulate the rapidly growing business of sub-metering to protect all stakeholders
• Use of Unmeasured Flow Reducers (UFRs) should be promoted to enhance accuracy of sub-meters. UFRs have been reported to recover about 94% and 14% of water flows below start-up flow rate and at Qmin, for domestic meters (1-7 years) of Class C turbine meters and with a Qmin of 25 ℓ/h (Fantozzi, 2009)
• As a long-term goal, where feasible, water utilities in developing countries should strive to provide 24-hour water supply of good quality and at sufficient pressures to minimise metering errors due to sub-metering
• Further studies should be carried out on more sub-metered properties, to minimise uncertainties due to a small sample size and give confidence in the results.
Finally, the most appropriate meter recommended for the KWDN is the magnetically-driven, sealed register, velocity meter designs. In a recent research study on the accuracy of in-service water meters, undertaken at Utah State University for the Water Research Foundation (USA), the multi-jet meter was found to out-perform the single-jet meter in withstanding sand particulates in water (Barfuss, 2011). This is probably explained by the way water flow impacts on the meter turbines. Unlike the single-jet where there is direct impact on the turbine from the flow of water, in a multi-jet meter there are several points at which the water rotates the turbine. This gives a much longer life and retains accuracy as the load is evenly distributed across the turbines. This makes the multi-jet water meter more attractive for developing countries. However, this should not be generalised, as laboratory conditions are quite different from real conditions of often complex water distribution networks. In addition, meter performance varies significantly between meter manufacturers and models. The decision as to which meter is best depends on local network conditions and other policy factors involved in optimal meter replacement (Arregui et al., 2011). It is advisable for each utility to undertake pilot studies to track the evolution of different meter performances over a number of years. The pilot studies on performance of the new generation of inferential meters (single-jet and multijet) are currently on-going in the KWDN and findings will be presented in a future publication.
Acknowledgments
This work was funded under the Netherlands Fellowship Program (NFP) and by the National Water and Sewerage Corporation (NWSC), Uganda. The authors are grateful to all of the staff of the Water Loss Control Section at the NWSC-Kampala Office for their support. The authors are also grateful to Maureen Hodgins of the Water Research Foundation(Colorado-USA), Allan Wyte (RTI-USA) and Dr. Apollo Tutesigensi (Leeds University, UK) for their material support. We also thank Olivia Nantongo of Makerere University, Kampala, who contributed to this work as a part of her Master's programme. Finally, the authors are very grateful to the Editor and the anonymous reviewers for their insightful critique that improved the article.
References
ALLANDER HD (1996) Determining the economical optimum life of residential water meters. Water Eng. Manage. 143 (9) 20-24. [ Links ]
ARREGUI F, CABRERA E, COBACHO R and GARCIA-SERRA J (2006a) Reducing apparent losses caused by meters inacuracies. WaterPract. Technol. 1 (4) doi: 10.2166/WPT.2006093. [ Links ]
ARREGUI F, CABRERA Jr. E and COBACHO R (2006b) Integrated Water Meter Management. IWA Publishing, London. [ Links ]
ARREGUI FJ, COBACHO R, CABRERA E Jr. and ESPERT V (2011) Graphical method to calculate the optimum replacement period for water meters. J. WaterResour. Plann. Manage. 137 (1) 143-146. [ Links ]
AWWA (1999) Water Meters -Selection, Installation, Testing, and Maintenance: Manual of Water Supply Practices (M6). American Water Works Association, Denver. [ Links ]
AWWA (2000) Water submetering and billing allocation: A discussion of issues and recommended industry guidelines. An AWWA Draft White Paper. American Water Works Association, Denver. [ Links ]
AWWA (2009) Water Audits and Loss Control Programs: AWWA Manual M36. American Water Works Association, Denver. [ Links ]
BARFUSS SL (2011) Flow meter accuracy. Paper presented at the American Council for an Energy-Efficient Economy, ACEEE, Berkeley, California, May 2011. URL: (www.aceee.org/conferences/2011/hwf/program). [ Links ]
BOWEN PT, HARP JF, ENTWISTLE JM Jr. and SHOELEH M (1991) Evaluating Residential Water Meter Performance. AWWA Research Foundation, Denver. [ Links ]
BUTLER D and MEMON FA (2006) Water Demand Management. IWA Publishing, London. [ Links ]
COBACHO R, ARREGUI F, CABRERA E and CABRERA E (Jr.) (2008) Private water storage tanks: Evaluating their inefficiencies. Water Pract. Technol. 3 (1) doi:10.2166/WPT.200825. [ Links ]
CRIMINISI A, FONTANAZZA CM, FRENI G and LA LOGGIA G (2009) Evaluation of the apparent losses caused by water meter under-registration in intermittent water supply. Water Sci. Technol. 60 (9) 2373-2382. [ Links ]
EUROPEAN COMMISSION (2007) EN-14154-1:2005+A1. Water Meters - Part 1: General Requirements. European Standards, Measuring Instruments. European Commission, Brussels. [ Links ]
FANTOZZI M (2009) Reduction of customer meters under-registration by optimal economical replacement based on meter accuracy testing programme and unmeasured flow reducers. Proc. 5th IWA Water Loss Reduction Specialist Conference, 26-30 April 2009, Cape Town, South Africa. pp. 233-239. [ Links ]
GOTTFRIED BS (2007) Spreadsheet Tools for Engineers Using Excel. McGraw Hill, New York. [ Links ]
HILL C and DAVIS SE (2005) Economics of Domestic Residential Water Meter Replacement Based on Cumulative Volume. Proc. AWWA Annual Conference, 12-16 June 2005, San Francisco, California. [ Links ]
ISO (2005) ISO-4064-1:2005. Measurement of water flow in a fully charged closed conduit - meters for cold potable water and hot water. Part 1: Specifications. International Organization for Standardization, Geneva. [ Links ]
ISO (1993) ISO-4064-3: 1993. Measurement of water flow in closed conduits - meters for cold potable water. Part 3: Test methods and equipment. International Organization for Standardization, Geneva. [ Links ]
ISO/IEC (2008) Uncertainty of Measurement - Part 3: Guide to expression of uncertainty in measurement (GUM:1995). International Organization for Standardization(ISO)/International Electrotechnical Commission (IEC), Geneva, Switzerland. [ Links ]
LUND JR (1988) Metering utility services: Evaluation and maintenance. Water Resour. Res. 24 (6) 802-816. [ Links ]
MALE JW, NOSS RR and MOORE IC (1985) Identifying and Reducing Losses in Water Distribution Systems. Noyes Publications, New Jersey. [ Links ]
McKENZIE RS and WEGELIN W (2009) Challenges facing the implementation of water demand management initiatives in Gauteng Province. Water SA 35 (2) 168-174. [ Links ]
MUTIKANGA HE, SHARMA S and VAIRAVAMOORTHY K (2009) Water loss management in developing countries: Challenges and prospects. J. Am. Water Works Assoc. 101 (12) 57-68. [ Links ]
MUTIKANGA HE, SHARMA SK and VAIRAVAMOORTHY K (2011) Assessment of apparent losses in urban water systems. Water Environ. J. 25 (3) 327-335. [ Links ]
MWE (2010) Water and Environment Sector Performance Report. Ministry of Water and Environment (MWE), Kampala, Uganda. [ Links ]
NEWMAN GJ and NOSS RR (1982) Domestic 5/8 inch meter accuracy and testing, repair, replacement programs. Proc. AWWA Annual Conference, 16-20 May 1982, Miami Beach, Florida, 341-352. [ Links ]
NGUYEN, B. (2010). Paris enters a new automated era of water metering. Water Util.Manage. Int. 5 (1) 21-23. [ Links ]
PASANISI A and PARENT E (2004) Bayesian modelling of water meters ageing by mixing classes of devices of different states of degradation. Appl. Stat. Rev. 52 (1) 39-65 (in French). [ Links ]
RICHARDS GL, JOHNSON MC and BARFUSS SL (2010) Apparent losses caused by water meter inaccuracies at ultralow flows. J. Am. Water Works Assoc. 105 (5) 123-132. [ Links ]
SHARMA SK and VAIRAVAMOORTHY K (2009) Urban water demand management: prospects and challenges for the developing countries. Water Environ. J. 23 210-218. [ Links ]
THORNTON J, STURM R and KUNKEL G (2008) Water Loss Control. McGraw-Hill, New York. [ Links ]
VREEBURG JHG and BOXALL JB (2007) Discolouration in potable water distribution systems: a review. Water Res. 41 519-529. [ Links ]
WALLACE LP and WHEADON DA (1986) An Optimal Meter Change-out Program for Water Utilities. Proc. AWWA Annual Conference, 22-26 June 1986, Denver, Colorado. pp. 1035-1042. [ Links ]
YEE MD (1999) Economic analysis for replacing residential meters. J. Am. Water Works Assoc. 91 (7) 72-77. [ Links ]
Received 14 March 2011; accepted in revised form 7 October 2011.
* To whom all correspondence should be addressed. +31(0)152151772; fax: +31(0)152122921; e-mail: h.mutikanga@unesco-ihe.org.

