


Serviços Personalizados
Artigo
 Inglês (pdf)
 Artigo em XML
 Referências do artigo
Indicadores

Links relacionados
-
 Citado por Google
 -
 Similares em Google
Compartilhar

 Permalink
Water SA
versão On-line ISSN 1816-7950
versão impressa ISSN 0378-4738
Water SA vol.37 no.4 Pretoria Out. 2011
Micro-scale heterogeneity in water temperature
HF DallasI,*; NA Rivers-MooreII
IFreshwater Research Unit, University of Cape Town, Private Bag X3, Rondebosch, 7700, South Africa
IIPO Box 152, Hilton, 3245, South Africa
ABSTRACT
Micro-scale heterogeneity in water temperature was examined in 6 upland sites in the Western Cape, South Africa. Hourly water temperature data converted to daily data showed that greatest differences were apparent in daily maximum temperatures between shallow- and deep-water biotopes during the warmest period of the year. Pool depth affected water temperature with deeper pools creating a more stable thermal environment. Groundwater-dependency affected water temperature differences with less groundwater-dependent rivers exhibiting greater differences in daily maximum temperatures. The importance of maintaining instream and riparian habitat, including pools, undercut banks, marginal vegetation, and an intact hyporheos, is discussed, giving examples of organisms utilising such habitats as thermal refugia. Considerations when choosing an appropriate model to simulate water temperatures, including groundwater-dependency, temporal and spatial scale, and study objectives, are discussed.
Keywords: water temperature, riverine ecosystems, rivers, thermal regimes, biotic responses, aquatic organisms, micro-scale heterogeneity, modelling
Introduction
Natural variation in water temperature occurs regionally at the catchment scale; longitudinally down a river system; and at a finer scale due to geomorphic variation, i.e. that of biotope (riffles, pools, backwaters, etc). Broad-scale differences between river catchments are driven by differences in climate, geography, topography and vegetation (Poole et al., 2001). Longitudinal variation often occurs down a river system, with headwaters typically cooler than lowland areas, with maximum temperatures increasing downstream (Ward, 1985; Rivers-Moore et al., 2004), while the maximum range is often found in the middle reaches (Vannote and Sweeney, 1980). At a local scale, channel complexity influences water temperature, with variation occurring laterally across the channel and in relation to side-channels and different biotopes (e.g. wood snags, off-channel biotopes) (Poole et al., 2001). Complex channels with backwaters, shallow margins, deep pools, side channels, etc., have more diverse temperature regimes, whereas simple uniform channels have more homogenous temperature regimes (Poole et al., 2001; Dallas, 2008; 2009). Backwaters may attain higher summer maxima than water of the main channel (e.g. Appleton, 1976; Harrison and Elsworth, 1958; Allanson, 1961) and marginal/lateral areas have been reported to have higher temperatures than mid-channel ones (Clark et al., 1999). Biotopes such as riffles may have a different temperature profile to pools (e.g. Nordlie and Arthur, 1981), which often exhibit vertical stratification in relation to water depth (e.g. Elliot, 2000). For example, Harrison and Elsworth (1958) reported a 10ºC gradient in a 2 m deep pool on the Berg River, Western Cape, South Africa, while Appleton (1976) observed a 0.9ºC and 1.9ºC difference in temperature of 0.70 m and 1.4 m pools, respectively, in the Gladdespruit, Mpumalanga, South Africa.
The inflow of groundwater has also been shown to greatly influence water temperature heterogeneity at a site; for example, Mosley (1983) observed a 17.7ºC range in temperature, from 17.2 to 34.9ºC, in a single reach of the Ashley River in New Zealand. This was the result of temperature differences in small side channels, which received seepage of cool underflow from the streambed. Variation within a riffle has also been linked to upwelling of groundwater at the tail of riffles, compared to down-welling of surface water at the heads of riffles (Evans and Petts, 1997). Cold water patches, which were at least 3ºC cooler than ambient water temperature, were found to be associated with side-channels, alcoves, lateral seeps and floodplain spring brooks (Ebersole et al., 2003).
Understanding of the variation in water temperature between shallow-water biotopes such as riffles and runs, and deep-water biotopes such as pools, will provide insights into potential thermal stress and thermal refugia under changing flow conditions. Riffles and runs have high productivity (Biggs and Hickey, 1994; Biggs et al., 1998), high concentrations of dissolved oxygen, accumulate organic material and generally support a high diversity and density of invertebrates. These biotopes may be more susceptible to elevated water temperatures, as they are generally shallower (often as little as 0.1 m deep during the low flow period), although this would depend on flow volume and retention time. Pools, which are typically areas of deposition and settling out of suspended sediment, may provide refuge areas for organisms during periods of high water temperatures, and may become isolated pockets of water during low flows and droughts.
The extent to which water temperatures vary amongst biotopes will also have implications for the selection of an appropriate model to simulate water temperatures, which should be governed by the purpose of the research (for example, biological stress or habitat range studies versus meeting of ecological Reserve thresholds). The aim of this research was to examine micro-scale heterogeneity in water temperature in rivers in upper catchme
Methods
Site and biotope selection
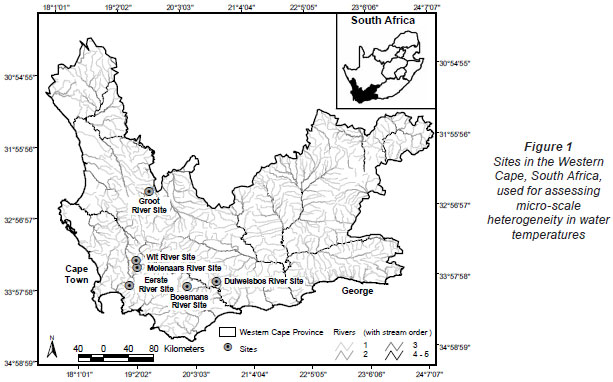
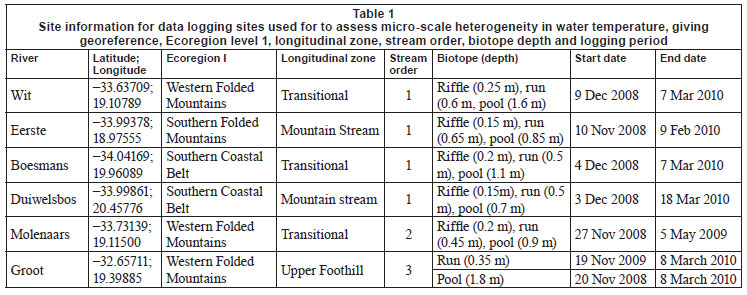
Water temperature loggers (Hobo TidbiT® v2), programmed to record hourly temperatures, were installed at upland sites on 6 rivers in the Western Cape. Four of these were retained for the entire data collection period (Fig. 1, Table 1). These streams were chosen because of their diverse hydraulic biotopes; where possible, loggers were positioned in 3 biotopes, namely, riffle, run and pool, as defined during the November/December 2008 logger installation, i.e. under summer baseflow conditions. Loggers were positioned in areas not shaded by riparian vegetation and at the maximum depth possible, with loggers resting on the channel bottom. The depth of each logger during installation is provided in Table 1.
Data analysis
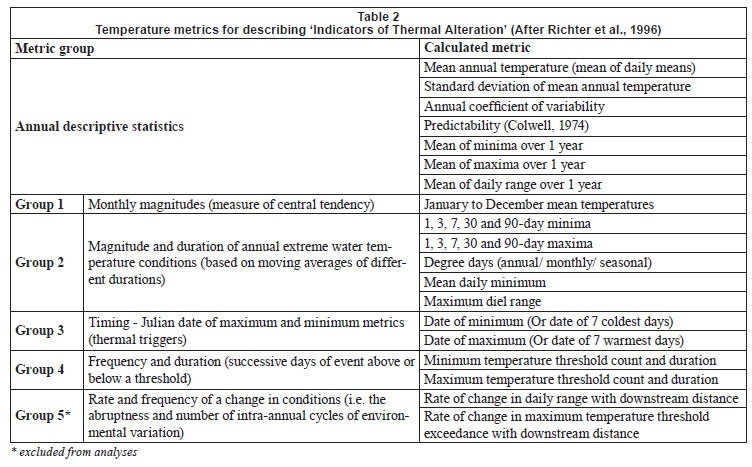
Daily mean, minimum and maximum (and their standard deviations) temperatures were calculated from hourly water temperature data for the period 1 January 2009 to 31 December 2009, or for shorter periods where the length of time for which data were available was different. Degree-days (based on mean and maximum daily temperatures), which are a measure of heating or cooling and are a way of measuring growth or development of organisms such as aquatic macroinvertebrates, were calculated for each biotope for 5 sites for the warmest period (1 January to 15 April 2009), with the exception of the Groot River site where calculations were based on a shorter time period (1 December 2009 to 28 February 2010), and the pool biotope of the Eerste River Site where data were missing for part of the year. Absolute annual minima and maxima were calculated for each site. Temperature metrics (Table 2), for describing 'Indicators of Thermal Alteration' (after Richter et al., 1996), were calculated for 4 sites, which had a full year's data (1 January 2009 to 31 December 2009). These metrics are divided into 6 broad groups, the first of which are annual descriptive statistics, while the remainder relate to timing, frequency, duration, magnitude and rate of change (Rivers-Moore et al., 2010). Sites include Wit River Site (riffle, run and pool), Eerste River Site (riffle and run), Boesmans River Site (riffle, run and pool) and Duiwelsbos River Site (riffle, run and pool). Prior to analysis, correlated variables were removed and data were normalised. Hierarchical agglomerative clustering, using group-average linking and the Euclidean distance measure of similarity, was used on the data matrix. Ordination of samples by multi-dimensional scaling (MDS) was undertaken, and stress values used to assess the reliability of the MDS ordination. Principle components analysis (PCA) was also undertaken on these metrics to confirm groupings and determine which variables contributed to the groupings. Statistical analyses were performed using PRIMER 6.
Results
Variation in daily water temperatures
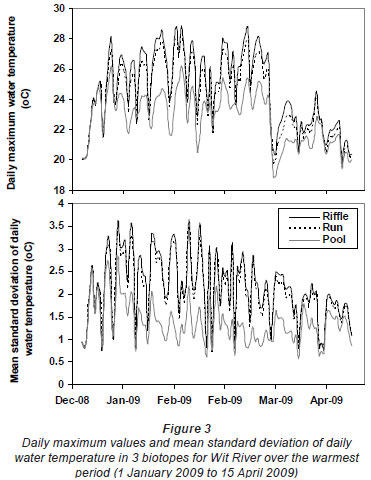
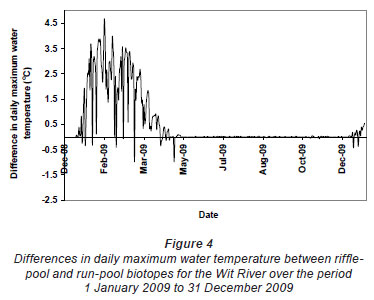
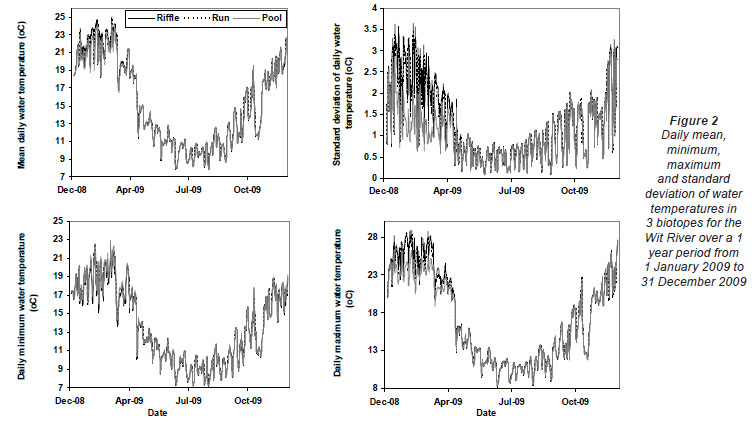
Greatest differences in water temperature amongst biotopes were recorded in the Wit and Boesmans River sites, which showed a similar trend. Daily data indicated that the greatest difference in water temperature recorded in the 3 biotopes was over the warmer period, namely, from 1 January to mid-April (Figs. 2 and 3, Wit River), and that daily maximum values in the riffle and run biotopes were consistently higher (0.5ºC to 4.5ºC) than the pool biotope (Fig. 4). Mean daily values and daily minimum values were not substantially different between biotopes, while mean daily standard deviation, representing the range of water temperatures, was greater in the riffle and run compared to the pool (Fig. 3). Examination of data for the Eerste River site, which excluded pool data for the warmest period, revealed that for the balance of the year the riffle and run biotopes were a maximum of 1.8ºC and 0.3ºC warmer than the pool biotope, respectively. Water temperature in the riffle biotope was more variable compared to both the run and pool biotopes. Differences were less distinct in the Duiwelsbos River site, with water temperature in the riffle and run biotopes marginally warmer in summer (especially daily maximum: 0.1ºC to 1.2ºC) and cooler in winter (especially daily minimum) compared to the pool biotope. Both the riffle and run were more variable in temperature than the pool, with a higher standard deviation for most times of the year. The Molenaars River site, using data for the period 1 December 2008 to 30 April 2009, displayed very little difference (<0.2ºC) in water temperature amongst biotopes. Differences in daily mean, minimum, maximum and daily standard deviation of water temperature between run and pool biotopes were observed in the Groot River site for the summer period (01 December 2009 to 28 February 2010), with maximum values in the run biotope up to 4.0ºC higher than temperatures in the pool.
Variation in degree days and absolute temperatures
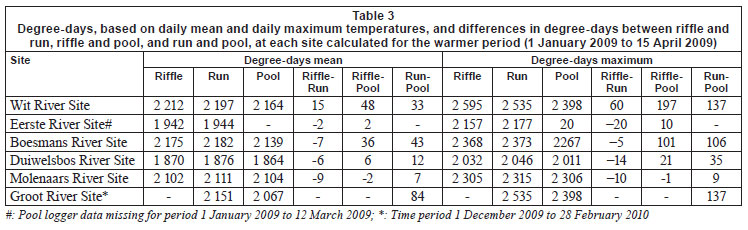
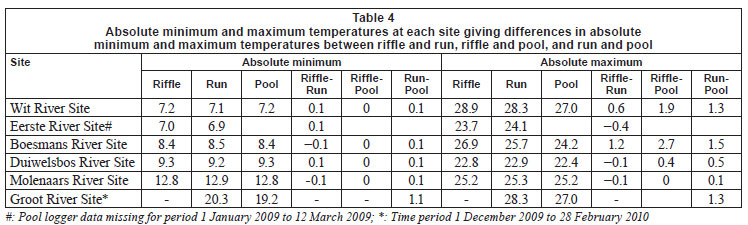
Cumulative daily mean temperatures over the summer period (i.e. 1 January 2009 to 16 March 2010) at Wit River site varied from 2 212ºC in the riffle to 2 197ºC in the run and 2 164ºC in the pool, representing a 15 and 48ºC difference between the riffle-run and riffle-pool, respectively (Table 3). In contrast, cumulative mean daily temperatures in the riffle, run and pool biotopes at the Molenaars River varied very little. Cumulative daily maximum temperatures over the summer period at the Wit River varied from 2 595ºC in the riffle to 2 535ºC in the run and 2 398ºC in the pool, a difference of 60 and 197ºC between the riffle-run and riffle-pool respectively. Similar differences were apparent in the Boesmans River (101 oC difference) and the Groot River (137ºC difference), although differences were not apparent at the Molenaars River. Absolute minimum temperature varied very little between biotopes (Table 4), with the exception of the Groot River, where there was a 1.1ºC difference between the run and pool biotopes. Differences in absolute maximum temperature were greatest between riffle and pool biotopes with differences of 2.7ºC for the Boesmans River, 1.9ºC for the Wit River and 1.3ºC for the Groot River (run), but < 0.5ºC for the Duiwelsbos River and the Molenaars River (Table 4).
Comparison of temperature metrics
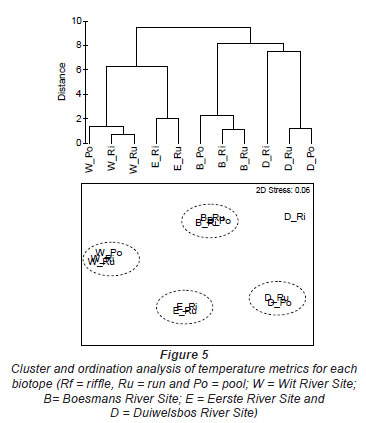
The Wit River had a coefficient of variation (CV) of 30.87 in the pool and 31.74 and 31.72 in the riffle and run, respectively. In contrast, the Duiwelsbos River had a CV of 16.31 in the pool and 17.15 and 17.00 in the riffle and run, respectively. Since CV is related to groundwater-dependency (Vannote and Sweeney, 1980), it is likely that the Wit River is surface-dependent, while the Duiwelsbos River had a greater contribution of groundwater. Cluster and ordination, using temperature metrics calculated for each biotope, indicated that metric data grouped by site and biotope (Fig. 5). The exception was the riffle biotope of the Duiwelsbos River, where further examination of the water temperature data indicated that the logger had been exposed for short periods of time during the warmer months. The Wit River and Duiwelsbos Rivers were on opposite ends of the ordination x-axis, while the Eerste and Boesmans Rivers were separated on the Y-axis.
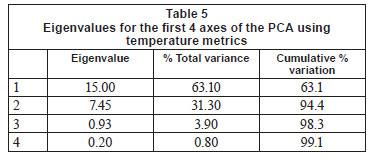
Further examination of this data using PCA analysis showed that cumulative percentage variance explained by the first 2 PCA axes was high (94%; Table 5). PCA Axis 1 was primarily influenced by the Annual Coefficient of Variation, Colwell's Predictability index and the mean of daily range over 1 year, together with metrics of the cooler months (means for June, July and August; 7-day minimum and minimum temperature threshold count). PCA Axis 2 was influenced by mean annual temperature, degree days and April and December means. Relating this to our rivers, the Wit and Duiwelsbos Rivers extend along the x-axis, with the Wit River having a more variable water temperature in all biotopes and higher winter temperatures in comparison to the Duiwelsbos River, which is less variable and has cooler winter temperatures. The Eerste and Boesmans Rivers extend along the y-axis, with the Eerste River having a lower mean annual temperature, April and December means, and degree days, in comparison to the Boesmans River.
Discussion
Hourly water temperature data indicate that there is generally a difference in water temperature between the shallow, fastflowing biotope such as a riffle, and the deeper, slow-flowing biotope such as a pool. Temperature differences between riffle (average depth+standard deviation of 0.19+0.04 m), run (average depth of 0.51+0.11 m) and pool biotopes appear to be related to pool depth (average depth of 1.16+0.44 m). Pools with a depth of less than 0.9m did not exhibit substantial differences in temperature, while pools greater than 0.9 m had temperature differences up to 4.5ºC. Greatest differences were also apparent during the warmer, summer period and for the daily maximum values. Translated to degree-days these differences represented a maximum difference of 196 oC between riffle and pool biotopes over a 2.5 month period. Greatest variance was observed in the Wit River, followed by the Eerste and Boesmans Rivers, most likely a reflection of greater dependence on surface water compared to groundwater. Thus, greatest differences in maximum temperatures amongst shallow and deep water biotopes are likely to be observed in rivers that are less groundwater dependent and which have significant pool depth.
Implications for aquatic organisms
Temperature influences many aspects of an individual organism's existence, including its metabolic (Eriksen, 1964), growth (e.g. Vannote and Sweeney, 1980) and feeding rates (Kishi et al., 2005); fecundity (e.g. Brittain, 1991); emergence (McKie et al., 2004); behaviour and ultimately survival. Organisms have an 'optimum thermal regime' (Vannote and Sweeney, 1980) at which optimal growth (adult size), reproduction and general fitness occur. Temperatures outside of this range may have a sub-lethal effect on the organism by affecting, for example, its reproductive success, or a lethal effect causing its death. The effect is dependent on the end temperature, as well as the rate of increase and the duration (Dallas and Day, 2004). Short duration exposures, in particular, may be avoided through behavioural adaptation, with organisms utilising cooler biotopes during periods of heat stress, by, for example, drifting, migrating to cooler instream areas or burying into the hyporheos.
Several studies have illustrated that fish use thermal refugia and often thermoregulate by migrating to areas of cooler water when surrounding water temperatures are outside of their preferred range or exceed their upper tolerances (e.g. Torgersen et al., 1999; Elliot, 2000; Ebersole et al., 2001; Gardner et al., 2003). Thermal refugia, which include undercut banks and overhanging vegetation (Bell, 2006), coldwater patches associated with lateral seeps, cold side-channels, floodplain tail seeps, floodplain seeps and stratified pools (Mosley, 1983; Ebersole et al., 2001), are most abundant in intact riverine systems with riparian vegetation and in systems with groundwater inflow (Torgersen et al., 1999). Instream and riparian habitat has been shown to be important in creating thermal refugia for aquatic organisms (e.g. Poole et al., 2001) and it is thus of great importance that these habitats are maintained and, if degraded, that they are restored. Deep pools, which are vertically stratified (Matthews and Berg, 1997; Elliot, 2000; Tate et al., 2006), act as thermal refugia, with fish migrating to cooler bottom water when surface temperatures exceed their incipient lethal limit, even though these pools are often lower in dissolved oxygen than the surface water, resulting in a trade-off between high temperatures and low dissolved oxygen (Matthews and Berg, 1997; Elliot, 2000).
Studies for aquatic macroinvertebrates are relatively scarce, with Mundahl (1989) showing that excessively high water temperatures (>39ºC), in an isolated stream pool in south-western Ohio during mid-July, forced freshwater crayfish, Orconectes rusticus, to abandon the pool and dig burrows in sand and gravel beneath rocks near the shoreline. Mean water temperature in these burrows was >6ºC cooler than that of the open pool. It is likely that some aquatic invertebrates that frequent shallow-water biotopes such as riffles may experience thermal stress as water levels drop and water temperature increases, and that the hyporheos presents one option for escaping temperatures outside an organism's optimum range. The hyporheic zone, which is the saturated interstitial space below the river bed and within the banks that holds a proportion of surface water (White, 1993), has been shown to be colder than surface water and warmer than groundwater (Evans and Petts, 1997). At riffle heads, for hyporheic depths of 20 cm and 40 cm, temperatures were 1.53ºC and 2.6ºC cooler, respectively, than surface water. At riffle tails hyporheic temperatures were 4.32ºC cooler than surface water and were more similar to groundwater temperatures, suggesting upwelling of groundwater. Associated studies (Dallas and Rivers-Moore, 2011; Dallas and Ketley, 2011) have shown that heptagenid mayflies, notonemourid stoneflies and philopotamid caddisflies are particularly sensitive to elevated water temperature. These taxa may utilise thermal refugia by moving to deeper biotopes such as pools during periods of thermal stress, although their other habitat requirements related to substrate, food and dissolved oxygen, as well as the risk of predation, may influence their behavioural response. Additional studies on diurnal migration of organisms will provide insight into the behavioural responses. It is also likely that, from an evolutionary perspective, thermally sensitive taxa have developed life cycles that enable them to avoid the hotter period, with development taking place during the cooler months and emergence occurring prior to the onset of temperatures exceeding their thermal tolerance. This is the focus of a study by Ross-Gillespie and Dallas (2009), which examines variation in life cycles and timing of emergence of selected taxa that inhabit rivers with different thermal and hydrological regimes. Incorporation of water temperature into the ecological Reserve is recognised as important (Rivers-Moore et al., 2008), and methods for facilitating this are underway. The biological need for thermal refugia should inform the ecological Reserve for water temperature.
Implications for modelling
The observed difference in water temperature between shallow- and deep-water biotopes, and surface water-versus groundwater-dependent streams, highlight the need to consider several aspects before choosing an appropriate model to simulate water temperatures. Key questions to ask include:
• Is the stream a gaining or losing one (i.e. is there recharge from groundwater)?
• What are the appropriate temporal and spatial scales for simulation of water temperatures?
• Is the model process-based or statistical?
In answer to the first question, the relative contribution of groundwater to overall streamflow should be assessed either directly (piezometers) or indirectly (water temperature data). Diurnal variation in stream temperatures is reduced in the gaining reaches of a stream as a result of discharging groundwater of relatively constant temperature. This is because groundwater inflows vary diurnally and annually, but with very little diurnal variation in groundwater temperatures and a small annual variation. Therefore variation in groundwater discharge generally increases variation in streamflow but decreases variability in water temperatures. For streams with large groundwater contributions, differences in water temperatures between different hydraulic biotopes are likely to be less, and a model to simulate mean versus maximum daily water temperatures is a moot point. Conversely, for streams with little groundwater input, differences will be more pronounced, and the choice between using a mean versus maximum model becomes more critical. This choice should be dictated by the overall study objectives - is the purpose of the study to relate biotic response to temperatures (in which case a maximum temperature model should be used); to study general trends down a river's axis (mean temperature model) or relative groundwater trends (minimum and maximum models). Additional considerations are:
• The turbidity of the water, since differences in maximum daily temperatures between a pool and a riffle will be more pronounced in a turbid river than in a clear river
• Residency time of water in the system, which is a function of stream velocity. The ratio of pool to riffle should inform the choice of model, i.e. a model for maximum water temperatures might be more appropriate for a stream with a large amount of riffle.
For the second question, the choice of mean versus maximum temperature model becomes less important as the temporal scale increases. In other words, it will be possible to derive daily mean and maximum temperatures from an hourly water temperature model; a daily temperature model should be explicitly mean or maximum, and the choice will be dictated by the larger study objectives; a weekly or monthly model will be less sensitive to whether mean or maximum temperatures are being used.
The third question is partially informed by the choice of time step. Statistical models are less complex and more suited to larger time steps (weekly or monthly temperatures), while process-based models are more suitable for hourly time-step models. At a daily time step, a statistical model will be less complex and can be used to simulate either mean or maximum daily temperatures. A process-based model should have the capability to include water velocity and groundwater contributions, and be able to simulate 'average' reach conditions or temperatures specific to hydraulic biotopes. Finally, temperature time-series for a pool versus a riffle might have different residuals in the data, ultimately affecting model accuracy. A statistical model might not have the capability to reflect the nuances in the data as accurately as a process-based model. Again, the study objectives should inform this decision.
Conclusions
Micro-scale heterogeneity in water temperature was observed during this study. Greatest differences were apparent in daily maximum temperatures between shallow- and deep-water biotopes during the warmest period of the year. The depth of the pool biotope affected water temperature differences, with deeper pools creating a more stable and cooler thermal environment. Groundwater-dependency affected water temperature differences with less groundwater-dependent rivers exhibiting greatest differences in daily maximum temperatures. The maintenance of instream and riparian habitat, in the form of, for example, pools, undercut banks, marginal vegetation and an intact hyporheos, will ensure the presence of thermal refugia into which aquatic organisms may temporarily escape if water temperatures exceed their optimum or preferred temperature ranges. In choosing an appropriate model to simulate water temperatures, aspects such as groundwater-dependency, temporal and spatial scale, and study objectives should inform the choice of model used.
Acknowledgments
The Water Research Commission provided funding for this research - thanks to Drs Steve Mitchell and Stanley Liphadzi, and Mr Bonani Madikizela for facilitation of this research. Thanks also to 2 anonymous referees for useful comments on the manuscript.
References
ALLANSON B (1961) Investigations into the ecology of polluted inland waters in the Transvaal. Hydrobiol. 18 1-76. [ Links ]
APPLETON C (1976) Observations on the thermal regime of a stream in the eastern Transvaal with reference to certain aquatic Pulmonata. S. Afr. J. Sci. 72 20-23. [ Links ]
BELL J (2006) The Assessment of Thermal Impacts on Habitat Selection, Growth, Reproduction and Mortality in Brown Trout (Salmo trutta L.): A Review of the Literature. Report No. EPA GRANT #WS 97512701-0. Applied Ecological Services Inc., Minnesota. [ Links ]
BIGGS BJF and HICKEY CW (1994) Periphyton responses to a hydraulic gradient in a regulated river, New Zealand. Freshwater Biol. 32 49-59. [ Links ]
BIGGS BJF, GORING DG and NIKORA VI (1998) Subsidy and stress responses of stream periphyton to gradients in water velocity as a function of community growth form. J. Phycol. 34 598-607. [ Links ]
BRITTAIN J (1991) Effect of temperature on egg development in the Australian stonefly genus Austrocercella Illies (Plecoptera: Notonemouridae). Aust. J. Mar. Freshwater Res. 42 107-114. [ Links ]
CLARK E, WEBB B and LADLE M (1999) Microthermal gradients and ecological implications in Dorset rivers. Hydrol. Process. 13 423-438. [ Links ]
DALLAS HF (2008) Water temperature and riverine ecosystems: an overview of knowledge and approaches for assessing biotic response, with special reference to South Africa. Water SA 34 393-404. [ Links ]
DALLAS HF (2009) The Effect of Water Temperature on Aquatic Organisms: A Review of Knowledge and Methods for Assessing Biotic Responses to Temperature. WRC Report No. KV 213/09. Water Research Commission, Pretoria, South Africa. [ Links ]
DALLAS HF and DAY JA (2004) The Effect of Water Quality Variables on Aquatic Ecosystems: A Review. WRC Report No. TT 224/04, Water Research Commission, Pretoria, South Africa. [ Links ]
DALLAS HF and KETLEY ZA (2011) Upper lethal limits for ten species of aquatic macroinvertebrates: comparing Critical Thermal Maxima with 96-LT5 0 values. J. Therm. Biol. 36 322-327. [ Links ]
DALLAS HF and RIVERS-MOORE NA (2011) Critical thermal maxima of aquatic macroinvertebrates - towards identifying bioindicators of thermal alteration. Hydrobiologia doi: 10.1007/ s10750-011-0856-4. [ Links ]
EBERSOLE J, LISS W and FRISSELL C (2001) Relationship between stream temperature, thermal refugia and rainbow trout Oncorhynchus mykiss abundance in arid-land streams in the northwestern United States. Ecol. Freshwater Fish 10 1-10. [ Links ]
EBERSOLE J, LISS W and FRISSELL C (2003) Cold water patches in stream: Physicochemical characteristics and the influence of shading. J. Am. Water Resour. Assoc. 39 355-368. [ Links ]
ELLIOTT J (2000) Pools as refugia for brown trout during two summer droughts: trout responses to thermal and oxygen stress. J. Fish Biol. 56 938-948. [ Links ]
ERIKSEN C (1964) Evidence of a spring rise in metabolic rate in the burrowing mayfly Ephemera simulans Walker. Hydrobiol. 23 506-510. [ Links ]
EVANS E and PETTS G (1997) Hyperheic temperature patterns within riffles. J. Hydrol. Sci. 42 199-213. [ Links ]
GARDNER B, SULLIVAN P and LEMBOR A (2003) Predicting stream temperatures: geostatistical model comparison using alternative distance metrics. Can. J. Fish. Aquat. Sci. 60 344-351. [ Links ]
HARRISON A and ELSWORTH J (1958) Hydrobiological studies on the Great Berg River, Western Cape province. Part I: General description, chemical studies and main features of the flora and fauna. Trans. R. Soc. S. Afr. 35 125-226. [ Links ]
KISHI D, MURAKAMI M, NAKANO S and MAEKAWA K (2005) Water temperature determines strength of top-down control in a stream food web. Freshwater Biol. 50 1315-1322. [ Links ]
MATTHEWS H and BERG N (1997) Rainbow trout responses to water temperature and dissolved oxygen stress in two southern California stream pools. J. Fish Biol. 50 50-67. [ Links ]
McKIE B, CRANSTON P and PEARSON R (2004) Gondwanan mesotherms and cosmopolitan eurytherms: effects of temperature on the development and survival of Australian Chironomidae (Diptera) from tropical and temperate populations. Mar. Freshwater Res. 55 759-767. [ Links ]
MOSLEY M (1983) Variability of water temperatures in the braided Ashley and Rakaia rivers. N. Z. J. Mar. Freshwater Res. 17 331-342. [ Links ]
MUNDAHL ND (1989) Seasonal and diel changes in thermal tolerance of the crayfish Orconectes rusticus, with evidence for behavioral thermoregulation. J. N. Am. Benthol. Soc. 8 (2) 173-179. [ Links ]
NORDLIE K and ARTHUR J (1981) Effect of elevated water temperature on insect emergence in outdoor experimental channels. Environ. Pollut. 25 53-65. [ Links ]
POOLE G, RISLEY J and HICKS M (2001) Issue paper 3 - Spatial and temporal patterns of stream temperature. Issue Paper 3. EPA910-D-01-003. United States Environmental Protection Agency. [ Links ]
RICHTER BD, BAUMGARTNER JV, POWELL J and BRAUN DP (1996) A method for assessing hydrologic alteration within ecosystems. Cons. Biol. 10 1163-1174. [ Links ]
RIVERS-MOORE N, DALLAS HF and MANTEL S (2010) Water Temperature and the Ecological Reserve: Report on Temperature Metrics - Guidelines to Classify Water Temperature Time Series into Ecologically Meaningful Metrics. Report No. 1799/15. The Institute for Water Research, Rhodes University and The Freshwater Consulting Group. Report submitted to the Water Research Commission, Pretoria, South Africa for WRC Project No. 1799. [ Links ]
RIVERS-MOORE N, HUGHES D and MANTEL S (2008) Links Between Water Temperatures, Ecological Responses and Flow Rates: A Framework for Establishing Water Temperature Guidelines for the Ecological Reserve. WRC Report No. KV 214/08. Water Research Commission, Pretoria, South Africa. [ Links ]
RIVERS-MOORE N, JEWITT G, WEEKS D and O'KEEFFE J (2004) Water Temperature and Fish Distribution in the Sabie River System: Towards the Development of an Adaptive Management Tool. WRC Report No. 1065/1/04. Water Research Commission, Pretoria, South Africa. [ Links ]
ROSS-GILLESPIE V and DALLAS HF (2009) Life history studies Report 1: Key Life History Traits and Thermal Cues of Selected Aquatic Macroinvertebrates. Report No. 1799/7. Freshwater Research Unit, University of Cape Town and the Freshwater Consulting Group. Report submitted to the Water Research Commission, Pretoria, South Africa, for WRC Project No. 1799. [ Links ]
TATE K, LANCASTER D and LILE D (2006) Assessment of thermal stratification within stream pools as a mechanism to provide refuge for native trout in hot arid rangelands. Environ. Monit. Assess. 124 289-300. [ Links ]
TORGERSEN C, PRICE D, LI H and MCINTOSH B (1999) Multiscale thermal refugia and stream habitat associations of chinook salmon in north-Eastern Oregon. Ecol. Appl. 9 301-319. [ Links ]
VANNOTE R and SWEENEY B (1980) Geographic analysis of thermal equilibria: a conceptual model for evaluating the effect of natural and modified thermal regimes on aquatic insect communities. Am. Nat. 115 667-695. [ Links ]
WARD J (1985) Thermal characteristics of running waters. Hydrobiol. 125 31-46. [ Links ]
WHITE DS (1993) Perspective on defining and delineating hyporheic zones. J. N. Am. Benthol. Soc. 12 (1) 61-69. [ Links ]
Received 19 January 2011; accepted in revised form 5 September 2011.
* To whom all correspondence should be addressed. +27 21 780-1644; fax: +27 86 673-0449; e-mail: helen.dallas@uct.ac.za

