


Servicios Personalizados
Articulo
 Inglés (pdf)
 Articulo en XML
 Referencias del artículo
Indicadores

Links relacionados
-
 Citado por Google
 -
 Similares en Google
Compartir

 Permalink
Water SA
versión On-line ISSN 1816-7950
versión impresa ISSN 0378-4738
Water SA vol.37 no.4 Pretoria oct. 2011
The spatial and temporal characterisation of flooding within the floodplain wetland of the Nyl River, Limpopo Province, South Africa
MD RowberryI,*; TS McCarthyII; M ThompsonIII; A NomngangaIII; L MoyoIII
IDepartment of Engineering Geology, Institute of Rock Structure and Mechanics, Academy of Sciences of the Czech Republic, V Holešovickách 41, 182 09 Prague 8, Czech Republic
IISchool of Geosciences, University of the Witwatersrand, Private Bag 3, 2050 Wits, South Africa
IIIGeoTerraImage (GTI), PO Box 295, Persequor Park, 0020 Pretoria, South Africa
ABSTRACT
The inundated area of a wetland is characterised by annual and interannual variability. This paper presents remotely-sensed imagery in order to better understand the spatial and temporal patterns of flooding within the floodplain wetland of the Nyl River, Limpopo Province. A detailed understanding of the hydrological characteristics of these flood events is essential in order to develop sustainable ecological and hydrological management plans for the area. From the results, flooding is shown to occur in 2 distinct phases. The initial phase is characterised by water ponding on the floodplain. The later phase is characterised by the input of water from tributaries to the north (e.g. Andriesspruit and Tobiasspriut) and southwest (e.g. Klein Nyl and Groot Nyl). This distinction may relate to the increasingly widespread practice of agricultural irrigation within adjacent tributary catchments. The methodology described in this study could yield valuable results when applied to other wetland systems in southern Africa.
Keywords: Landsat, remote sensing, flood dynamics, floodplain wetlands, Nyl River
Introduction
In southern Africa, a number of coastal and inland wetlands assume important hydrological and biogeochemical functions in addition to supporting high biodiversity (Tooth and McCarthy, 2007). These wetlands are threatened by a variety of developmental pressures (e.g. Mitsch and Gosselink, 2000), as well as concerns regarding the potential consequences of global environmental change (e.g. Winter, 2000). In recent decades, much research has focused on accurately characterising wetlands in order to assist with conservation and policy making. This research is usually based on detailed studies of ecological phenomena such as fish spawning, bird nesting, or plant seeding cycles (e.g. Capon and Brock, 2006; Kingsford, 2006). Far less attention is paid to the interaction between wetlands and other pertinent phenomena such as hydrology, geomorphology, or sedimentology (Tooth et al., 2009). As a result, the dynamics of many wetlands are poorly understood.
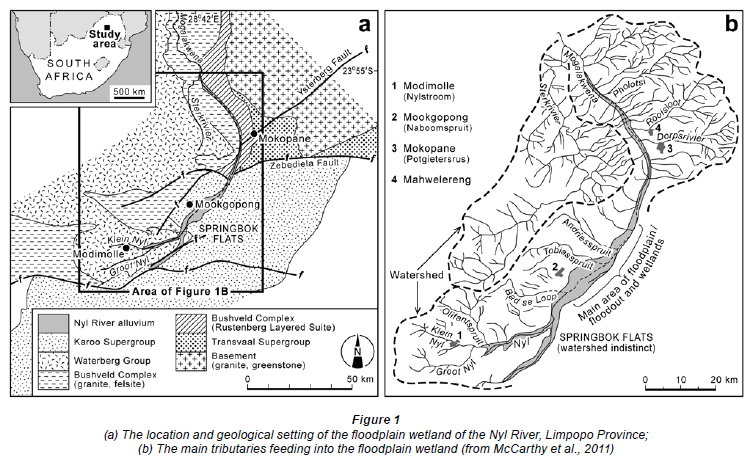
The seasonal floodplain wetland of the Nyl River is located between the towns of Modimolle and Mokopane in the Limpopo Province, South Africa (Fig. 1a). The sector of the floodplain centred on the Nylsvley Nature Reserve was declared a Ramsar Site in 1998, in recognition of the fact that it represents one of the most important conservation areas in South Africa. It is home to more than 420 bird species, including 102 water bird species. Fifty-eight water bird species breed on the floodplain, equating to 61% of the breeding population of inland water birds south of the Zambezi and Cunene Rivers. Other inhabitants of the floodplain include 70 species of mammal, 58 species of reptile, 16 species of fish, and 10 000 species of insect (Tarboton, 1987). Therefore, understanding the hydrological dynamics of this floodplain wetland is of particular importance with regard to its sustainable ecological and hydrological management (McCarthy et al., 2011). The ecological status of the floodplain is threatened by the increasing development of upstream catchments, as this affects the amount and timing of water delivered to the floodplain. Hydrological and hydraulic modelling of the floodplain wetland has formed the basis of a number of recent studies (Birkhead et al., 2007; Havenga et al., 2007; Kleynhans et al., 2007). This study further constrains the spatial and temporal pattern of flooding within this wetland system through an interrogation of remotely-sensed images. The use of satellite images is essential as the area is largely inaccessible during the wet season.
Background: The floodplain wetland of the Nyl River
Geology and geomorphology
The general area is dominated by 3 physiographic regions (Frost, 1987). The first region comprises the floodplain wetland of the Nyl River (Fig. 1b). The alluvial deposits attain widths of more than 6 km and thicknesses of more than 35 m (Porszasz, 1971; 1973). The alluvium is generally underlain by weathered basalts of the upper Karoo Supergroup. These basalts are terminated to the north by the Zebediela Fault. Thereafter, the alluvium is underlain by the mafic Rustenburg Layered Suite of the Bushveld Igneous Complex. The second region comprises the Waterberg Mountains to the northwest. These mountains have formed within the sedimentary rocks of the Waterberg Group and the granites and felsites of the Bushveld Igneous Complex. The Waterberg Group principally comprises medium- to coarse-grained sandstones but also includes greywacke, mudstones, and siltstones. The Bushveld Igneous Complex is extensively faulted hereabouts and this leads to sharp changes in the underlying geology over short distances. The third region comprises the Springbok Flats to the southeast. This subdued ground has formed across the volcanic and sedimentary rocks of the Karoo Supergroup.
McCarthy et al. (2011) recently described the geomorphic development of the floodplain wetland. The alluvial character of the river is due to the progradation of large, coarse-grained alluvial fans across the valley from the northeast. The progradation partially or completely obstructed the previously dominant axial flow, and created sufficient accommodation space to induce upstream sedimentation and floodplain formation. The sedimentary record at the distal end demonstrates that periods of alluvial fan progradation have alternated with periods of deposition in shallow lakes by axial flow. Furthermore, periods of aggradation are interspersed with erosional episodes during which incision into the older deposits occurred at the distal end. The overall accumulation of sediment has shifted its course closer to the Waterberg Mountains and raised the bed of the Nyl River by > 30 m.
Climate and hydrology
The mean annual rainfall in the area is 623 mm/yr. However, this is highly variable and can range from 250 mm/yr to 1 100 mm/yr (Tooth et al., 2002). The recorded data show alternating periods of above and below average rainfall, operating within a 15- to 21-year cycle (Frost, 1987; Tooth et al., 2002). The mean annual temperature is 19ºC and annual evaporation (unshielded class-A pan) is 2 400 mm (Rogers and Higgins, 1993). The area is characterised by 3 distinct seasons (Frost, 1987). This study focuses on the wet season, which extends from November to April. Approximately 85% of the annual rainfall occurs during these months. The maximum average monthly rainfall peaks in January at approx. 150 mm. Most of the rain falls in the form of heavy convective thunderstorms during the late afternoon (Jackson and Tyson, 1971). The intensity of an individual storm can vary greatly over short distances, although small but consistent differences in overall spatial distribution do occur (Frost, 1987). The average annual rainfall is greatest above the Waterberg Mountains, particularly at its southern end. Rainfall declines gradually with decreasing elevation and distance from the plateau. During the wet season, the mean daily maximum and minimum temperatures are 29.2ºC and 14.5ºC, respectively.
The floodplain wetland is confined by the Waterberg Mountains to the northwest and by the Springbok Flats to the southeast. The wetland has previously been thought to receive most of its surface water from the south (e.g. Klein Nyl and Groot Nyl Rivers), although a number of significant tributaries rise in the Waterberg Mountains (e.g. Bad se Loop, Tobiasspruit, and Andriesspruit). On average, the flows from these streams cause inundation of at least parts of the floodplain in 3 out of every 5 years during the summer season. Only occasionally do the floodwaters persist throughout a year to the following wet season (Havenga et al., 2007). The Springbok Flats are devoid of perennial rivers and streams. The existing watercourses only contain flowing water for short periods after floods and, therefore, little water is supplied from the east (Frost, 1987). As there is no continuous channel through the floodplain wetland, during wet years water spills beyond the end of the defined channel as laterally extensive, slow moving, shallow sheetflow (Tooth et al., 2002). Flooding is generally considered to occur from the southern end of the floodplain, although individual tributaries may cause local flooding on different parts of the floodplain. However, only about 30% of the water discharged onto the floodplain leaves the northern end of the wetland with the rest lost mainly by evapotranspiration (Morgan, 1996).
Methodology
This study is based on images derived from the Landsat 5 Program. These images have a repeat interval of 16 days. The initial phase of this study involved examining images taken between 1990 and 2008. The images would, ideally, cover a 'time-series' that followed the entire sequence of flood expansion and contraction. It was clearly necessary to exclude those images that were unusable because of excessive cloud coverage.
In total, 23 non-orthorectified images were requested from the Satellite Applications Centre (SAC). All of these raw images were orthorectified using ERDAS AutoSync to the ellipsoid UTM 35 S using WGS-84 datum. The geographical reference used during the orthorectification process was derived from the NASA EarthSAT (Stock 2000) and SRTM DEM. The images were orthorectified with a RMS error of < 1 pixels and resampled to a 30 x 30 output format using cubic convolution (Table 1).

The extent of the actual flooding was determined using a 2-step modelling process. First, digital terrain data were used to determine the potential maximum flood extent based solely on topography and associated hydrological catchments. This potential maximum flood boundary was then used as a geographic mask to clip appropriate subsets from each available satellite image, within which the physical extent of actual flood waters could then be mapped, without confusion with other non-flood features exhibiting similar (image) spectral characteristics. A Normalised Difference Vegetation Index (NDVI) was used to initially distinguish between vegetated and non-vegetated areas within the clipped images. The NDVI dataset was then appended to conventional spectral image data and used as a composite dataset from within which the actual extent of flood waters were extracted using unsupervised spectral classification procedures. In many cases the total extent of flood waters was represented by several 'spectral' output classes, as a result of local differences in water characteristics (i.e. depth, turbidity etc). These had to be amalgamated into a single 'water' information class, in order to represent the full extent of the flood waters as a single category. The final rasterbased thematic classifications of flood water extent were then converted into vector GIS coverages for further analysis.
Results
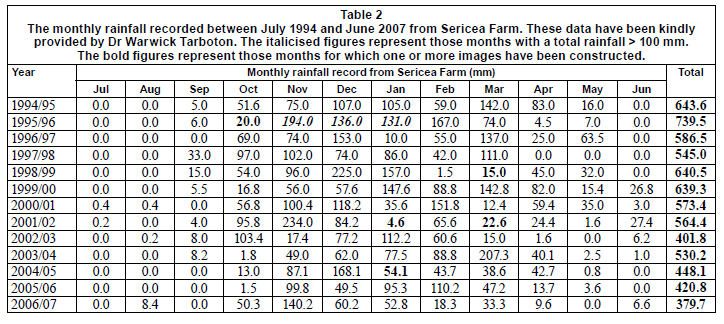
From our interrogation of the remotely-sensed data, 12 images are presented; 6 relate to the flooding that occurred during 1995-1996, whilst a further 6 relate to various flood events during 1998-1999, 2001-2002, 2004-2005, and 2007-2008. In order to place these images within their wider climatic context, the monthly rainfall recorded between July 1994 and June 2007 from Sericea Farm is shown in Table 2. The gauge is located approx. 7 km southwest of the Nylsvley Nature Reserve (http://www.nylsvley.co.za).
The flooding of 1995-1996
The most complete time-series constructed shows the extent of flooding during the 1995-1996 flood season (Fig. 2). Six, out of a possible seven, consecutive images proved to be sufficiently cloudless for flood accumulation to be visible. On 27 October 1995 (Fig. 2a), there is very little evidence of flooding within the wetland or its associated tributaries. This is unsurprising given that the rain gauge recorded almost no precipitation in the antecedent period from July to September and only 20 mm of rainfall during October. Nonetheless, a certain amount of water accumulation can be recognised in the upland tributaries to the northwest of the floodplain (e.g. Bad se Loop). On 12 November 1995 (Fig. 2b), there is again very little evidence of flooding within the wetland or its associated tributaries. Where water accumulation is recognised, it appears to be randomly distributed within small, discrete, bodies. On 28 November 1995 (Fig. 2c), the situation has changed dramatically. The rain gauge recorded 194 mm of rainfall during November. This figure represents the third-highest monthly total measured during the 13-year monitoring period at Sericea Farm. A major accumulation of water is visible within the floodplain wetland. Towards its northern end, water exists within 2 parallel swathes orientated SW-NE. These are separated by a subdued ridge within the floodplain. Much of the water appears to have collected on the surface of the floodplain rather than being derived from adjacent tributaries, suggesting that rain falling directly onto the floodplain may be responsible for this flooding. To the south, the Klein Nyl River appears to be a potential source of water although this tributary is also characterised by ponded water. It should be noted that, from the images, it is not possible to determine whether the water is actually ponded or slowly moving. However, the micro-topography of the surface of the floodplain suggests that the former is more probable. There appears to be only a minor input of water from the north-western tributaries.
On 14 December 1995 (Fig. 2d), the spatial extent of the flooding appears to have altered considerably. The rain gauge recorded another 136 mm of rainfall during December. Firstly, the total surface area affected by the flood waters has diminished markedly. It appears likely that the smaller surface area is the result of evaporation, given that there is little infiltration into the floodplain. Infiltration is comparatively unusual due to the presence of impermeable clay layers within the alluvial deposits of the floodplain. Secondly, the water appears have become concentrated into broad depressions on the floodplain. The channels are associated with the northernmost of the 2 swathes described earlier. There is also some evidence of water input from the tributaries on the north-western side of the floodplain, particularly from those to the north of Mookgopong (e.g. Tobiasspruit and Andriespruit). On 30 December 1995 (Fig. 2e), these characteristics appear even more pronounced. The total surface area affected by the flood waters has once again diminished and water is now solely concentrated into channels within the floodplain. In addition, water is clearly accumulating within in the south-western catchments (e.g. the Klein Nyl and Groot Nyl Rivers) for the first time. This water is mainly constrained within channels, although flooding is observed in the downstream sector of the Groot Nyl. Unfortunately, due to cloud, it was not possible to recognise the floodplain on the image taken on 15 January 1996. The rain gauge recorded a further 131 mm of rainfall during January 2006. On 31 January 1996 (Fig. 2f), the floodplain comprises a near continuous body of water that includes the subdued ridge indentified previously. To the north, the flood waters eventually form a single-thread channel in the vicinity of the Zebediela Fault. There is now evidence for a considerable input of water from those tributaries on the north-western side of the floodplain (e.g. Bad se Loop, Tobiasspruit, and Andriespruit) as well from those tributaries on the south-western side of the floodplain (e.g. the Klein Nyl and Groot Nyl Rivers). This water is mainly constrained within channels, although flooding is observed in the downstream sector of the Groot Nyl. It is notable that the Olifantspruit is the only tributary not affected by water accumulation in the vicinity of the floodplain. These figures suggest that the flood did not develop progressively from its southern end. Instead, the northern area was flooded separately by local tributaries.
Other flood events
Due to a number of comparatively dry years or excessive cloud coverage, only a relatively small number of images are able to follow the extent of flooding (Fig. 3). One image shows the extent of flooding during the 1998-1999 flood season (Fig. 3a). The image was taken on 12 March 1999. It is, therefore, unusual, as it comes from late in the wet season. In the antecedent period, the rain gauge recorded a negligible amount of precipitation, of 1.5 mm, during February 1999 and 15 mm during March 1999, despite very high rainfalls of 225 mm during December 1998 and 157 mm during January 1999. The figure for December 1998 represents the second-highest monthly total measured during the 13-year monitoring period at Sericea Farm. Where water accumulation is recognised, it appears to be randomly distributed within small, discrete, bodies. Although some of these bodies occur in the adjacent tributaries (e.g. Tobiasspruit), none appear to be directly connected to the floodplain.
Two images show the extent of flooding during the 2001-2002 flood season (Figs. 3b and 3c). These are not successive images and are separated by a substantial period, of 96 days. On 7 January 2002, the extent of flooding is considerable. In the antecedent period, the rain gauge recorded a negligible amount of precipitation, of 4.6 mm, during January 2002, despite very high rainfalls of 234 mm during November 2001 and moderate rainfalls of 84.2 mm during December. The figure for November 2001 represents the highest monthly total measured during the 13-year monitoring period at Sericea Farm. It comprises a near-continuous body of water across the majority of the floodplain. To the north, the flood waters form a single-thread channel in the vicinity of the Zebediela Fault. There is evidence for a considerable input of water from those tributaries on the northwestern side of the floodplain, particularly from those to the north of Mookgopong. There is also evidence for a considerable input of water from those tributaries on the south-western side of the floodplain. The water accumulated from these tributaries does not appear to flow directly into the lower part of the floodplain. It is notable that the Olifantspruit and Bad se Loop do not contribute greatly to the flooding recorded at this time. On 28 March 2002, the spatial extent of flooding has grown further. In the intervening period, the rain gauge recorded only moderate amounts of precipitation, of 65.6 mm during February, and 22.6 mm during March. Again, the flooding comprises a continuous body of water across the majority of the floodplain. There is clear evidence for a considerable input of water from those tributaries on the north-western side of the floodplain, as well as from those tributaries on the south-western side of the floodplain. In contrast to the previous image, the water derived from those tributaries on the south-western side of the floodplain does now flow directly into the lower part of the floodplain.
Two images show the extent of flooding during the 2004-2005 flood season (Figs. 3d and 3e). These are successive images separated by a period of 16 days. On 7 January 2005, there are minor accumulations of water in both the wetland and its associated tributaries. In the antecedent period, the rain gauge recorded moderate amounts of precipitation, of 99.8 mm, during November 2004, and 49.5 mm during December. Where water accumulation is recognised in the wetland, it appears to be concentrated in its central region within small, discrete, bodies. Water accumulation can be recognised in those upland tributaries on the north-western side of the floodplain. Almost no water has accumulated in those catchments to the south of the floodplain wetland. On 23 January 2005, the situation has changed considerably. The rain gauge recorded a moderate amount of precipitation, of 95.3 mm, during January 2005. A major accumulation of water is visible within the floodplain wetland. Towards its northern end, water is concentrated within a single channel. Further south, the 2 parallel swathes orientated SW-NE are once more recognised. Again, much of the water appears to have ponded on the surface of the floodplain rather than being derived from adjacent tributaries. Whilst water accumulation can be seen in those upland tributaries on the north-western side, it does not appear to flow directly onto the floodplain. Again, almost no water has accumulated in those catchments to the south of the floodplain wetland.
One image shows the extent of flooding during the 2007-2008 flood season (Fig. 3f). The image was taken on 1 February 2008. No rainfall data are available for this period from Sericea Farm. Its spatial extent is very similar to that seen in the final image constructed for the 1995-1996 flood season. The flooding comprises a continuous body of water across the majority of the floodplain. To the north, the flood waters form a wide single-thread channel in the vicinity of the Zebediela Fault. There is evidence for a considerable input of water from those tributaries on the north-western side of the floodplain. The input of water from those tributaries on the south-western side of the floodplain appears to be considerable and it is notable that this water is not constrained within channels. Once again, it is clear that the Olifantspruit is the only tributary not contributing significant volumes of water to the floodplain.
Discussion
The spatial and temporal patterns of flooding within the floodplain wetland
This paper contributes to a better understanding of the spatial and temporal patterns of flooding within the floodplain wetland of the Nyl River. It appears that flooding occurs in 2 distinct phases. The initial phase is characterised by water ponding on the surface of the wetland. The later phase is characterised by the input of water from adjacent tributaries to the north and southwest. This distinction may relate to the increasingly widespread practice of agricultural irrigation within the adjacent tributary catchments. Havenga et al. (2007) show that the tributary affected most by this irrigation is Bad se Loop (flow gauge A6H010). This study corroborates that view, as there is very little evidence for input onto the floodplain from this source. It was also shown that the Klein and Groot Nyl Rivers are affected by the effects of irrigation (Flow Gauges A6H006 and A6H011, respectively). It is notable that these tributaries only provide an input onto the floodplain after the initial period of flood accumulation. As a result, it is suggested that the spatial and temporal patterns of flooding within the wetland recognised in this study do not reflect the natural dynamics of the hydrological system. It is, already, not a natural system. This is an important point to consider in relation to the sustainable ecological and hydrological management of the floodplain wetland.
The use of remote-sensing imagery
The data interrogated in this study were derived from the Landsat 5 Program. The orbiting satellite has a repeat interval of 16 days. It was clearly necessary to eliminate those images that were unusable. In general, these were either associated with 'dry' years or excessive cloud coverage. Unfortunately, this resulted in the exclusion of a large number of images and it was only possible to generate 1 near-complete 'time-series'. Nonetheless, it is considered that the methodology described here could yield valuable results when applied to other wetlands with a suitable climatic regime, i.e. where rainfall takes place in short, intense, events. However, the methodology may be most valuable when it is applied to wetlands that are recharged by water derived from distal areas. For example, in southern Africa, the Okavango Delta forms the terminal depository of the Okavango River. This river is sourced in the highlands of Central Angola, where the summer rains fall between December and February. At the apex of the Okavango Panhandle in north-eastern Botswana, water discharge peaks around April. Thereafter, the flood wave reaches the lower end of the delta during the dry season, around July (McCarthy et al., 1991). A similar study has previously been undertaken by McCarthy et al. (2003) using the coarse NOAA AVHRR satellite images. Applying the described methodology to this example would enable the flood wave to be traced across the delta at a time when there should be minimal cloud coverage. In this example, the most conspicuous drawback relates to the size of the wetland under consideration. Away from southern Africa, other possible examples may be found in the high latitudes where wetlands are fed by glacial meltwaters.
Conclusions
This paper contributes to a better understanding of the spatial and temporal patterns of flooding within the floodplain wetland of the Nyl River. The most complete time-series constructed followed the flooding of late 1995. It appears that flooding occurs in 2 distinct phases. The initial phase is characterised by water ponding on the surface of the wetland. It is tentatively suggested that this ponding is caused by the presence of impermeable clay layers within the floodplain. The latter phase is characterised by the input of water from adjacent tributaries to the north and southwest. This pattern is markedly different from that described in the existing literature and may relate to the increasingly widespread practice of agricultural irrigation within the adjacent tributary catchments. Finally, it is considered that the methodology described in this study could yield valuable results when applied to other wetlands in remote areas with a suitable climatic regime.
Acknowledgements
Satellite Applications Centre (SAC) provided the images used in this study. The authors would like to thank the anonymous reviewers for their helpful comments.
References
BIRKHEAD AL, JAMES CS and KLEyNHANS MT (2007) Hydrological and hydraulic modelling of the Nyl River floodplain, Part 2: Modelling hydraulic behaviour. Water SA 33 9-20. [ Links ]
CAPON SJ and BROCK MA (2006) Flooding, soil seed bank dynamics and vegetation resilience of a hydrologically variable desert floodplain. Freshwater Biol. 51 206-233. [ Links ]
FROST PGH (1987) The Regional Landscape: Nylsvley in Perspective. South African National Scientific Programmes Report No. 133. [ Links ]
HAVENGA CFB, PITMAN Wv and BAILEy AK (2007) Hydrological and hydraulic modelling of the Nyl River floodplain, Part 1. Background and hydrological modelling. Water SA 33 1-8. [ Links ]
JACKSON SP and TySON PD (1971) Aspects of weather and climate over southern Africa. The Standard Encyclopedia of Southern Africa Vol. 3. Nasou Ltd., Cape Town. 258-269. [ Links ]
KINGSFORD R (2006) Ecology of Desert Rivers. Cambridge University Press, Cambridge. 368 pp. [ Links ]
KLEYNHANS MT, JAMES CS and BIRKHEAD AL (2007) Hydrologic and hydraulic modelling of the Nyl River floodplain, Part 3: Applications to assess ecological impact. Water SA 33 21-26. [ Links ]
McCARTHY JM, GUMBRICHT T, McCARTHy TS, FROST PGH, WESSELS K and SEIDEL F (2003) Flooding patterns of the Okavango Wetland in Botswana between 1972 and 2000. AMBIO 32 453-457. [ Links ]
McCARTHY TS, STANISTREET IG and CAIRNCROSS B (1991) The sedimentary dynamics of active fluvial channels on the Okavango Fan, Botswana. Sedimentology 38 471-487. [ Links ]
McCARTHY TS, TOOTH S, JACOBS Z, ROWBERRy MD, THOMPSON M, BRANDT D, HANCOx PJ, MARREN PH, WOODBORNE, S and ELLERy WN (2011) The origin of the Nyl River floodplain wetland. S. Afr. Geogr. J. doi:10.1080/03736245.2 011.619324. [ Links ]
MITSCH WJ and GOSSELINK JG (2007) Wetlands. John Wiley and Sons, Chichester. 900 pp. [ Links ]
MORGAN CS (1996) The Application of Digital Terrain Models and a Geographic Information System in the Modelling of Flooding in the Nyl River Floodplain. M.Sc. Thesis, University of the Witwatersrand, Johannesburg. [ Links ]
PORSZASZ K (1971) Provisional report of Nyl River valley subterranean water supply project. Technical Report No. GH 3407. Department of Water Affairs, Pretoria. [ Links ]
PORSZASZ K (1973) Nyl River valley: an investigation of the groundwater potential. Technical Report No. GH 2984. Department of Environmental Affairs, Pretoria. [ Links ]
ROGERS KH and HIGGINS SI (1993) The Nyl Floodplain as a functional unit of the landscape: preliminary synthesis and future research. Research Report No. 1/93: Centre for Water in the Environment, University of the Witwatersrand, Johannesburg. [ Links ]
TARBOTON WR (1987) The Nyl Floodplain. Fauna and Flora 45 3-5. [ Links ]
TOOTH S, McCARTHy TS, HANCOx PJ, BRANDT D, BUCKLEy K, NORTJIE E and McQUADE S (2002) The geomorphology of the Nyl River and floodplain in the semi-arid Northern Province, South Africa. S. Afr. Geogr. J. 84 226-237. [ Links ]
TOOTH S and McCARTHy TS (2007) Wetlands in drylands: geomorphological and sedimentological characteristics, with emphasis on examples from southern Africa. Prog. Phys. Geogr. 31 3-41. [ Links ]
TOOTH S, RODNIGHT H, McCARTHy TS, DULLER GAT and GRUNDLING AT (2009) Late Quaternary dynamics of a South African floodplain wetland and the implications for assessing recent human impacts. Geomorphol. 106 278-291. [ Links ]
WINTER TC (2000) The vulnerability of wetlands to climate change: a hydrologic landscape perspective. J. Am. Water Resour. Assoc. 36 305-311. [ Links ]
Received 18 November 2010; accepted in revised form 2 September 2011.
* To whom all correspondence should be addressed. +420 226 009 327; fax: +420 284 680 105; e-mail: rowberry@irsm.cas.cz

