


Services on Demand
Article
 English (pdf)
 Article in xml format
 Article references
Indicators

Related links
-
 Cited by Google
 -
 Similars in Google
Share

 Permalink
Water SA
On-line version ISSN 1816-7950
Print version ISSN 0378-4738
Water SA vol.37 n.4 Pretoria Oct. 2011
A forced-gradient tracer test on the Hansrivier Dyke: Beaufort West, South Africa
Y van WykI,*; K WitthueserII
IUniversity of Pretoria, Geology Department, Private Bag X20, Hatfield 0028, South Africa
IIInstitute for Groundwater Studies, University of the Free State, PO BOX339, Bloemfontein 9300, South Africa
ABSTRACT
A field-scale pumping test and uranin tracer test was carried out at Hansrivier Farm in Beaufort West to determine the hydraulic properties of the Hansrivier Dyke/Karoo sedimentary rock aquifer. Analysis of borehole images and pumping test results reveal that the fractured-rock aquifer is highly transmissive due to the influence of the Hansrivier Dyke; however its influence is concentrated on extremely limited conductive zones. Results of the tracer test show that chemical transport can take place via multiple flow paths with differing hydraulic properties, such as fracture aperture, connectivity and permeability. Furthermore, diffusion of a tracer into fractures and rock matrix has a universal retardatory travel time due to the various flow paths. In order to interpret the tracer test data, the Single Fissure Dispersion Model (SFDM) was used for inverse modelling of the breakthrough curves. The resulting effective diffusion coefficients are comparable with laboratory-derived values, and are therefore considered to be representative of the investigated part of the aquifer.
Keywords: Beaufort West, hydrogeology, fractured rock aquifer, tracer test, pumping test, Single Fissure Dispersion Model
Introduction
The fundamental characteristics of fractured rock aquifers lie in their extreme spatial variability of hydraulic conductivity and hence groundwater flow rate. Characterising these aquifers is therefore an important factor in understanding the importance of fractures on groundwater flow and transport, determining at what scale fractures become important and, finally, determining how fractures determine transport, flow velocity and flow direction (National Research Council, 1996). These factors are of importance as they form the basis of our understanding of how fractured rock aquifers behave. In groundwater investigations, hydraulic tests such as pumping and tracer tests can be used to obtain estimates of transmissivity and longitudinal dispersivity, which can provide insight into groundwater flow characteristics and contaminant transport processes of the aquifer medium. These properties are useful in determining the advective transport of contaminant plumes and assist in developing effective groundwater remediation systems.
This paper presents the methodology and results of a field scale forced-gradient tracer test on a fractured aquifer at Hansrivier Farm, Beaufort West, in order to determine the aquifer's hydraulic properties, which are understood to be influenced by a dolerite dyke.
Site location
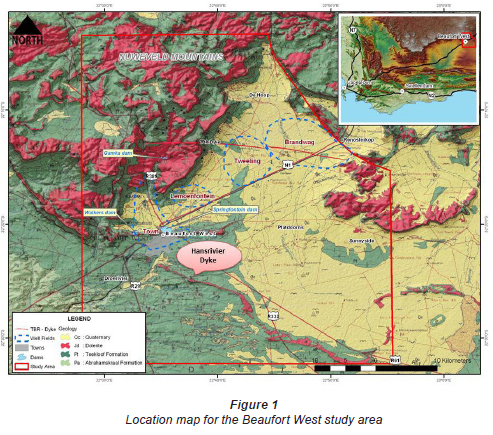
The study area is situated approximately 450 km northeast of Cape Town along the N1 route which connects Cape Town with Kimberley, Bloemfontein and Johannesburg. The site is situated between 32º 0' 10" S and 32º 5' 27" S and 22º 4'40" E and 22º9'15" E.
Immediately north of Beaufort West, the Nuweveld Mountains rise up to a plateau at approximately 1 450 m above mean sea level (m a.m.s.l.). These mountains are characteristically flat-topped, being capped by thick sheets of erosion-resistant dolerite sills. Beaufort West lies at the base of the escarpment, which acts as a watershed between north- and south-flowing rivers (Fig. 1).
Geological and hydrogeological background
Site geology
The Karoo Basin is a late Carboniferous-Middle Jurassic retroarc foreland basin developed in front of the Cape Fold Belt (CFB) due to the subduction of the palaeo-pacific plate underneath the Gondwana plate (Catuneanua et al.,1998). The Beaufort Group of the Karoo Supergroup is subdivided into the Lower Adelaide and Upper Tarkastad subgroups, of which only the former is present in the study area (Fig. 1) .The Adelaide subgroup of late Permian age (i.e. 260 Ma) attains a maximum thickness of 2 000 m and consists of the older Abrahamskraal and younger Teekloof formations of alternating bluish-grey mudstone and grey, very fine- to medium-grained sandstone (Woodford and Chevallier, 2002). The Abrahamskraal formation represents a highly-sinuous fluvial environment, and was deposited predominantly by overbank flooding from meandering rivers flowing across an extensive alluvial plain towards the receding Ecca Sea. The overlying Teekloof formation differs from the Abrahamskraal formation in the respect that it is dominated by green, grey and maroon mudrocks with minor, laterally accreted channel sandstones. The Teekloof formation represents a typical floodplain environment.
Subsequent to the deposition of the Beaufort Group and Karoo Sediments, a number of dolerite dykes and sills intruded into the sediments during a period of extensive magmatic activity over the entire South African sub-continent during the break up of Gondwanaland (Chevalier et al., 2001). This resulted in a network of dolerite dykes, sills and even inclined sheets, which are present in the study area. The 3 main dykes in the study area are:
• East-west trending dyke stretching from the Nuweveld Mountains north of the Gamka Dam in an easterly direction, cutting across the Tweeling, Brandwag and Renosterkop Farms, otherwise called the TBR dyke (Kotze and Rosewarne, 1997), terminating in the dolerite ring structure on the Renosterkop Farm, which is described as a 'saucer-like' inclined dolerite sheet
• East-west trending dyke cutting through the town of Beaufort West
• Northwest-southeast trending dyke also known as the Hansrivier Dyke acts as a preferential conduit for groundwater drainage due to pervasive jointing of the host rock (Teekloof formation)
Alluvium, calcrete and hard pan deposits cover the majority of the ground surface in the Beaufort West region, particularly in the lower-lying and flat areas. The alluvium covers the river valleys related to the predominantly ephemeral streams. These younger sediments and deposits are as a result of the weathering of the Karoo geology.
Hydrogeological background
In general, the sandstone and mudstones of the Beaufort Group are characterised by the significantly low (virtually absent) primary porosity and permeability due to diagenesis. As a result, the secondary hydrogeological properties of the rocks, such as the degree, density, continuity and interconnection of fracturing, control the occurrence, storage and movement of groundwater (Kotze and Rosewarne, 1997). According to Botha et al. (1998), Karoo fractured rocks are multi-layered, highly heterogeneous and anisotropic, with relatively low and variable permeability. Fractured-rock aquifers cover most of the study area. A combination of intergranular and fractured-rock aquifers also exist as a result of alluvial processes and/or deeply weathered Beaufort Sediments overlying much younger Karoo Sediments. Fractured-rock aquifers also tend to produce higher yielding boreholes, in excess of 5  /s, whereas those with dual porosities produce yields of between 0.1 and 0.5 /s (Rose and Conrad, 2007).
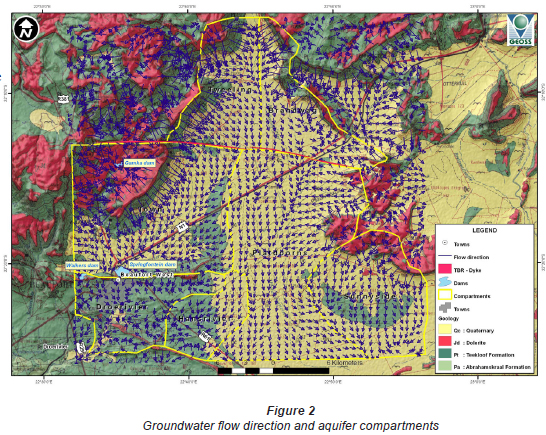
The town of Beaufort West and the area of study fall within Quaternary Catchments J21A and L11F. The groundwater recharge per catchment is estimated to be 1.8% and 2.3%, respectively (i.e. ~ 3.5 Mm3/a and 3.8 Mm3/a) (DWAF, 2005). The general groundwater flow direction is from north to south, with elevation of water levels higher in the Nuweveld Mountains than in the south (Fig. 2). The groundwater flow direction generally follows the topographic gradient but is locally impacted by abstractions and the presence of geological structures, such as dykes and sills. Geological structures have a strong bearing on groundwater flow directions, the most significant of these relating to the dolerite dykes, which are generally semi-permeable/impermeable. Due to the thermal effects, these dykes have caused fracturing of adjacent rocks (sandstone/mudstone), significantly increasing the yields of boreholes adjacent to the dykes.
Aquifer properties
Table 1 presents the average horizontal transmissivity and storativity values at a number of localities in the study area, as published in Rose and Conrad (2007). Due to limited available data for the area south of Beaufort West, the current dataset is restricted mainly to the municipal well fields situated to the north of the town (Fig. 1). This reflects the areas most extensively explored over the past 20 years (Rose and Conrad, 2007).
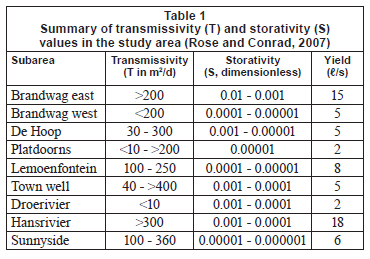
A strong correlation occurs between borehole yields and transmissivities, whereby areas with high transmissivities (>100 m2/d) are generally associated with borehole yields greater than 5 /s. The influence of dolerite dykes on the yields of boreholes can be seen by the large number of boreholes drilled in close proximity to these geological structures (Kotze and Rosewarne, 1997). Pumping test data from Rose and Conrad (2007) indicate that boreholes drilled on the Hansrivier Farm (south east of Beaufort West) on a contact zone between the dolerite dyke and fractured Teekloof formation produced sustainable yields in excess of 10 /s.
Experiments
Interpretation of EC-pH logs
In the study of flow and transport through fractured rocks, knowledge of the locations of fractures and their hydraulic properties is essential (Doughty and Tsang, 2005). For the delineation of water bearing fractures in fractured rock formations of the Karoo, electrical conductivity (EC)-pH logging with depth was carried out on 2 boreholes within the study area, namely HR.10 and G29936HB, both of which were later used for the aquifer and tracer test.
Interpretation of borehole camera log
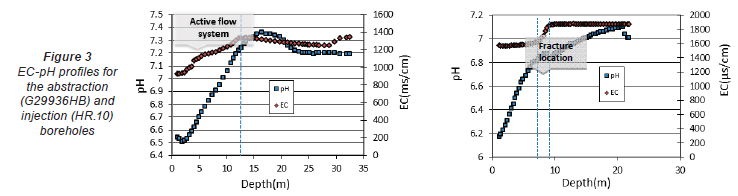
To verify historical borehole logging data on fracture location at the observation borehole, G29936HB, camera logging was also carried out within Borehole G29936HB prior to the injection of uranin. Based on the camera logging inspection, it could be seen that multiple fracture zones occur at depths of 10 m and 17 m, which concurs with historical data from the National Groundwater Archives (NGA) of the Department of Water Affairs (DWA). These multiple fracture zones were also visible in one of the EC-pH logs (Fig. 3) for Borehole HR.10. Borehole G29936HB displays an active flow system at the top of the water column, represented by low-mineralised, recently-recharged water, with more evolved, highly-mineralised/stagnant water occurring at the bottom of the borehole. Groundwater within the fracture zones exhibits a higher pH than groundwater within the host rock matrix, and can be attributed to the exsolution of CO2 in the fractures, causing precipitation of carbonates and thus altering the water composition within the fractures to become more alkaline. Vertical, sub-vertical and horizontal (bedding-plane) fractures were also shown on the camera logging inspection, with the latter contributing to the overall transmissivity of the aquifer (as shown from the aquifer test data) and accordingly the strength of the borehole yield. Notwithstanding, it was found that not all fractures are transmissive, as the majority of fractures occurring at greater depths were closed due to secondary weathering processes.
Hydraulic test
Aquifer test
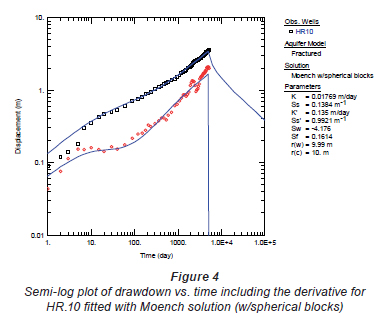
Diagnostic or qualitative analysis of drawdown data was undertaken to identify component flow geometries during the pumping test. Derivative analysis, in which the derivative of drawdown is plotted against the log of time, was used to dissect the drawdown response and to identify the component flow regimes of the aquifer test. It has been shown that the use of the derivative technique for heterogeneous systems may yield valuable information relating to the architecture of the aquifer (Raghavan, 2004). The derivative is sensitive to small variations in the rate of pressure change, which may be less obvious in the drawdown versus time plots (Bourdet et al., 1983).
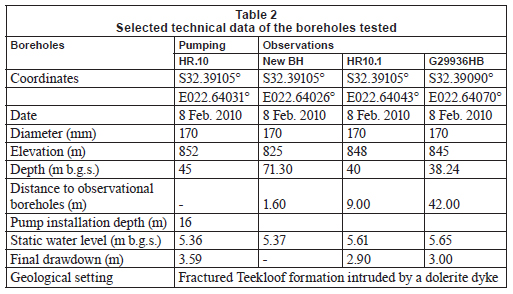
A constant-discharge aquifer test (pumping test) was carried out on 8 February 2010 at the Hansrivier site in Beaufort West with the goal of obtaining drawdown data in the pumping borehole (HR.10) and 3 observation boreholes (New BH, HR10.1 and G29936HB). It is noted, however, that monitoring data collected during the aquifer test was not available for 'New BH' drilled by the municipality. The details of the tested boreholes are presented in Table 2. The pumping test was undertaken over a period of 88 h by pumping Borehole HR.10 at a rate of 10 /s and achieving a final drawdown of approximately 3.59 m within this borehole and a maximum drawdown of 2.9 m and 3.0 m in the observation boreholes, HR.10.1 and G29936HB, respectively. Water levels during pumping and during recovery (after pumping stopped) were recorded in both the pumping borehole and observation boreholes. Packers were not used so that responses of the entire aquifer could be characterised.
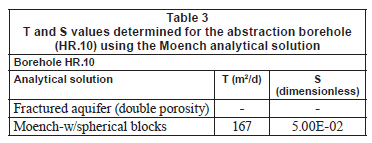
The pumping test allowed for analytical techniques to be applied to the data to determine the transmissivity (T) and storativity (S) of the aquifer. The method that was considered to give the best fit after a no-flow boundary was fitted at a distance of 9 m from the pumping borehole (HR.10) was the Moench (w/spherical blocks) analytical solution for fractured rock aquifers (Fig. 4). The estimated transmissivity and storativity values calculated from the Moench analytical solution are presented in Table 3. Both the transmissivity and storativity estimations are comparable with that of Rose and Conrad (2007), who reported T-values greater than 100 m2/d for the Beaufort West region.
Forced-gradient tracer test
Experimental setup and methodology
On 10 February 2010 a tracer experiment under radially convergent flow conditions (pumping) was conducted to obtain more constrained aquifer parameters of the area surrounding the dolerite dyke at Hansrivier Farm, Beaufort West. The boreholes utilised for the tracer test were HR.10 (pumping) and G29936HB (injection), situated a distance of 42 m from each other. The experiment consisted of 2 components: a tracer dilution in the injection borehole using non-iodated salt (NaCl) followed by the addition of the fluorescent dye uranin (C20H10Na2O5) and recovery of the tracer from Borehole HR.10. The salt injection process was carried out as a trial run prior to the actual tracer test with uranin in order to optimise the sampling schedule.
The uranin tracer was made up by dissolving 20 g of uranin in 500 m of site water and injected using a low-flow pump into Borehole G29936HB with 5 of chase fluid, once the drawdown stabilised (linear gradient).The injection process lasted less than 4 min, which can be assumed to be instantaneous with respect to the mean residence time of the tracer (~366 min). After the tracer (Dirac pulse) was injected, the water column was mixed using a slug/bailer to ensure a consistent distribution of the tracer solution throughout the entire water column, thus allowing the tracer to flow in all fracture zones at equal concentration towards the pumping borehole (HR.10). The volume of both the tracer and chase fluid were reduced to a minimal amount in order to minimise the initial spreading of the tracer plume around the injection borehole. A spectrofluorometer was installed above the pump and was used to measure the uranin concentration at 2-min intervals. Due to the rapid arrival of the uranin tracer observed in the pumping well, HR.10 (indicating good fracture connectivity between the 2 boreholes), the sampling interval was reduced to 10 s.
Assessment of the breakthrough curve (BTC)
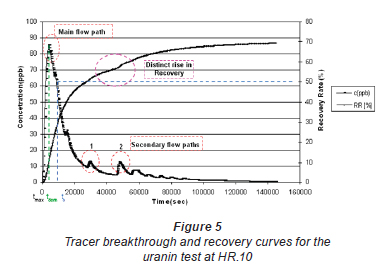
Linear groundwater flow velocities were calculated from the tracer test by dividing the distance between the injection borehole (G29936HB) and the pumping borehole (HR.10) by the travel time of the tracer. The calculated linear flow velocities are an underestimation of the actual flow velocities as groundwater will flow naturally along more complex tortuous flow paths. The first appearance of the uranin at HR.10 was after approximately 140 s (tmax), which corresponds to a maximal flow velocity (vmax) within the fractured dolerite dyke of 0.29 m/s. The maximal flow velocity is normally defined as 'worst case', because it is directly connected to the first appearance of the tracer at the sampling site and reduced with the analytical detection limit for the tracer (Käss, 1998). To avoid the above constraint, it is beneficial to report the mean (vmean) or dominant (vdom) flow velocities, which in this instance equate to 0.0036 m/s and 0.0112 m/s, respectively. The mean flow velocity is the ratio of the flow distance (injection - observation borehole) and corresponds to the time (tmean) at which 50% of the recovered tracer mass passed the observation borehole, which occurred after 11 755 s. Whereas the dominant flow velocity, corresponds to the time (tdom) at which the maximal tracer concentration was observed, which equalled 3 750 s (Käss, 1998). The breakthrough continued for approximately 1.7 d, after which the monitoring was stopped as the tracer concentration reached 0.36 µg/, close to the background value of 0.17 µg/. A good recovery of 70% of the injected mass was observed for the dolerite dyke section.
The tracer-breakthrough curve (BTC), generated by plotting measured tracer concentration at the Hansrivier Dyke site versus time, is presented in Fig. 5. The BTC is characterised by a narrow peak and flat extended tailing, indicating dominant advective transport in the fracture(s) with diffuse coupling to the matrix (tailing). The majority of the tracer mass was recovered after 5.5 h. It is understood that, provided that the migration of the tracer follows a discrete fracture set connecting both boreholes directly, the dispersion of the tracer into the matrix will be small. However, should the tracer migration follow several discrete fracture sets intercepting each other, the dispersivities would increase due to interstitial mixing between different fracture sets (Maloszewski et al., 1999). The multiple peaks at intermediate times of the breakthrough curve (Fig. 5) suggest the existence of secondary flow paths within the fracture network, allowing the uranin tracer to travel at different velocities. This can also be seen in the distinct rise of the relative recovery curve.
Analytical modelling
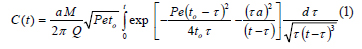
The Single Fissure Dispersion Model (SFDM), developed by Maloszewski and implemented in the software Traci95, was used to fit the observed BTC (Käss, 1998). The Traci95 software was also used for modelling the tracer breakthrough curves and determining the hydraulic properties of the main and secondary flow paths shown in Fig. 5. The theoretical tracer breakthrough curves were simulated using the best-fit method on the basis of measured concentrations. The parameters of the SFDM obtained by fitting Eq. (1) to the tracer concentration measured at HR.10 are summarised in Table 4.
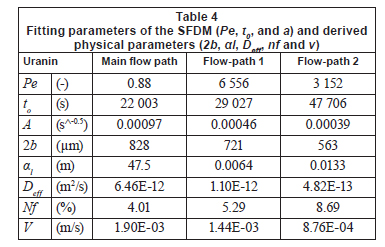
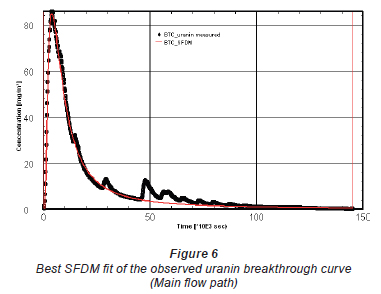
Based on the BTC, the mean residence time (t0) and longitudinal dispersivity (αl) of the main flow path (Fig. 6) were 6 h and 47.5 m, respectively. The high longitudinal dispersivity (47.5 m) is a result of an extensive tailing effect of the BTC. The fracture aperture and porosity shown in Table 4 were calculated using the following equations (Maloszewski et al., 1999):
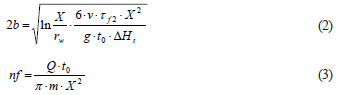
For the main and secondary flow paths the derived values for the fracture aperture (2b) and fracture porosity (nf) were in the range of 563 to 828 µm and 4.00 to 8.69%, respectively.
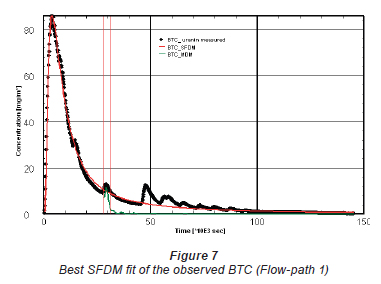
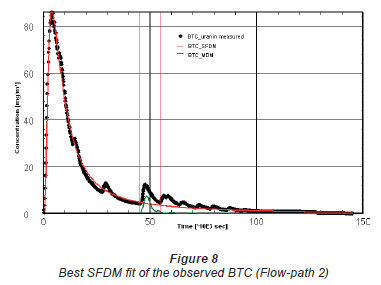
While the overall fit of the BTC is good (Fig. 6), there are obvious deviations from the fitted SFDM at intermediate to late times. This suggests the existence of secondary flow paths, as mentioned previously. Interpretation of these deviations can be based on the assumption that the final BTC is a superposition of several BTCs in each flow path. This can be modelled by applying the multi-channel model (MCM) of the SFDM (Maloszewski et al., 1999). Figure 7 and Figure 8 are the BTCs to which the MCM of the SFDM was applied, with the relevant parameters given in Table 4 as Flow-paths 1 and 2. In general, minor variations of the modelled parameters are observed, with the exception of the Peclet (Pe) and longitudinal dispersivity (αl) values. The Peclet number can be defined as the ratio of the rate of advection of a physical quantity by the flow to the rate of diffusion of the same quantity driven by an appropriate gradient. The MCM gave Pe values, which ranged from 0.8 for the main flow path to 6 556 for the secondary flow paths (Flow-paths 1 and 2). This implies that the modelled peaks on the BTC travelled purely by advection, with very small longitudinal dispersivities, in the order of 0.0064 to 0.0133, for the secondary flow paths.
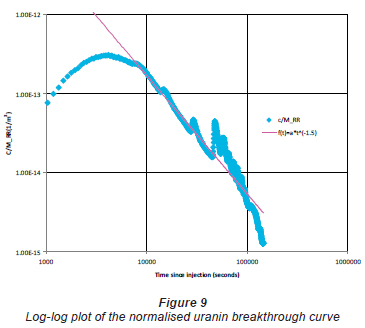
In order to accurately interpret the BTCs with respect to matrix diffusion, the tailing effects needed to be characterised. Becker and Shapiro (2000) have shown that extensive tailing of BTCs conducted in fracture networks of crystalline rocks is not always a characteristic of diffusion processes, but rather an advective-dominated process caused by spatial and temporal heterogeneous transport. A typical diffusion tailing can, however, be identified by a decrease in the concentration of the tailing according to t-1.5 (Tsang, 1992). From Fig. 9 it can be seen that matrix diffusion is indeed evident in the BTC as the data plot on a straight line fitted with a slope of -1.5, up to a time of 50 000 s. Thereafter the graph displays oscillating peaks that do not appear to fit the straight line section fitted with t-1.5. It is considered that there is an underdamp hydraulic pressure response in the abstraction borehole (HR.10), which could be as a result of power fluctuations in the pumping rate, allowing for the retarded release of the tracer from the injection borehole.
The derived effective diffusion coefficient (molecular diffusion coefficient in free water, multiplied by matrix tortuosity) (Deff) for the main flow path equalled 6.46E-12 m2/s, which concurs with laboratory derived values for sandstones (1.69E-11 to 7.10E-11 m2/s) given by Boving and Grathwohl (2001).
Conclusions
The tracer test results have confirmed the existence of a good hydraulic connectivity between Boreholes HR.10 and G29936HB, situated 42 m from each other. Furthermore the test suggested that transport occurred via multiple pathways with different hydraulic properties. The large fracture apertures determined for the main and secondary flow paths (828, 721 and 563 µm) can result in significant channelling of fluid flow, accelerating the movement of solutes in a particular direction, which may differ locally with respect to the main flow direction for high to low hydraulic potential. Tracer diffusing into stagnant water zones within the fracture and the matrix was identified as an important retardation mechanism. Modelling of the experimental data with the multi-channel SFDM fitted the overall response of the BTCs well, and gave estimates of the transport parameters. Furthermore, the high transmissivity and borehole yields obtained from the pumping test confirmed the aquifer's potential as a major source of water supply, which needs to be managed sustainably. An outlook to protection zoning around these water supply boreholes (HR.10, HR10.1 and G29936HB) is important, as they are being used to augment the current water supply to Beaufort West.
Acknowledgements
The financial support of the Water Research Commission and the Institute for Groundwater Studies is gratefully acknowledged. We thank the anonymous reviewers for providing valuable suggestions and critical comments that improved this manuscript.
References
BECKER MW and SHAPIRO AM (2000) Tracer transport in fractured crystalline rock: Evidence of nondiffusive breakthrough tailing. Water Resour. Res. J. 36 (7) 1677-1686. [ Links ]
BOTHA JF, VERWEY JP, VAN DER VOORT I, VIVIER JJP, BUYS J, COLLISTON WP and LOOCK JC (1998) Karoo Aquifers: Their Geology, Geometry and Physical Properties. WRC Report No. 487/1/98. Water Research Commission, Pretoria. [ Links ]
BOURDET D, WHITTLE TM, DOUGLAS AA and PIRARD YM (1983) A new set of type curves simplifies well test analysis. World Oil 196 95-106. [ Links ]
BOVING TB and GRATHWOHL P (2001) Tracer diffusion coefficients in sedimentary rocks: correlation to porosity and hydraulic conductivity. J. Contam. Hydrol. 53 85-100. [ Links ]
CATUNEANUA O, HANCOX PJ and RUBIDGE BS (1998) Reciprocal flexural behaviour and contrasting stratigraphies: A new basin development model for the Karoo retroarc foreland system, South Africa. Basin Res. 10 (4) 417-439. [ Links ]
CHEVALLIER L, GOEDHART M and WOODFORD A (2001) The influences of dolerite sill and ring complexes on the occurrence of groundwater in Karoo Fractured Aquifers: A morpho-tectonic approach. WRC Report No. 937/1/01. Water Research Commission, Pretoria. [ Links ]
DOUGHTY C and TSANG CF (2005) Signatures in flowing fluid electric conductivity logs. J. Hydrol. 310 157-180. [ Links ]
DWAF (DEPARTMENT OF WATER AFFAIRS AND FORESTRY, SOUTH AFRICA) (2005) Groundwater Resource Assessment Phase 2. Department of Water Affairs and Forestry, Pretoria. [ Links ]
KASS W (1998) Tracing Technique in Geohydrology. A.A Balkema Publishers, Rotterdam. [ Links ]
KOTZE JC and ROSEWARNE P (1997) Brandwag aquifer and well field groundwater flow model. SRK Consulting Report No. 227331/3. Report by SRK Consulting to Beaufort West Municipality. [ Links ]
MALOSZEWSKI P, HERRMANN A and ZUBER A (1999) Interpretation of tracer test performed in fractured rock of the Lange Bramke basin, Germany. J. Hydrol. 7 209-218. [ Links ]
NATIONAL RESEARCH COUNCIL (COMMITTEE ON FRACTURE CHARACTERIZATION AND FLUID FLOW, NATIONAL RESEARCH COUNCIL) (1996) Rock Fractures and Fluid Flow - Contemporary Understanding and Applications. National Academy Press, Washington D.C. [ Links ]
RAGHAVAN R (2004) A review of applications to constrain pumping test responses to improve on geological description and uncertainty. Am. Geophys. Union Trans. 42 1-29. [ Links ]
ROSE R and CONRAD J (2007) A regional reconnaissance to identify areas for groundwater development in Beaufort West. GEOSS Report No: G2007/05-03. GEOSS (Geohydrological and Spatial Solutions International (Pty.) Ltd.), Cape Town. [ Links ]
WOODFORD AC and CHEVALLIER L (2002) Hydrogeology of the Main Karoo Basin: Current knowledge and future research needs. WRC Report No. TT 179/02. Water Research Commission, Pretoria. [ Links ]
Received 16 February 2011; accepted in revised form 2 September 2011.
* To whom all correspondence should be addressed. +2712 420-2794; fax: +2712 362-5219; e-mail: yazeed.vanwyk@up.ac.za

